

Translate this page into:
Contamination and health risk assessment of potentially toxic elements in Al-Ammariah agricultural soil, Saudi Arabia
⁎Corresponding authors. ssalarifi@KSU.EDU.SA (Saad S. Alarifi), asmohamed@KSU.EDU.SA (Abdelbaset S. El-Sorogy),
-
Received: ,
Accepted: ,
This article was originally published by Elsevier and was migrated to Scientific Scholar after the change of Publisher.
Peer review under responsibility of King Saud University.
Abstract
The purpose of this study is to determine the potentially toxic elements (PTEs) in the agricultural land of Al-Ammariah their potential non-carcinogenic and carcinogenic risks for residents’ health due to exposure to PTEs. As, Cu, Co, Cr, Fe, Mn, Ni, Zn, V, and Pb were measured in 34 soil samples collected from palm and citrus plantations using Inductively Coupled Plasma - Atomic Emission Spectroscopy. The values of the chronic daily intake “CDI”, the hazard index “HI”, and the life cancer risk “LCR” can be used to predict the health risks via ingestion and dermal pathways. The following was the order of the average HM levels (μg/g): Fe (11581) > Mn (180) > Zn (52.17) > Ni (26.94) > Cr (19.97) > V (18.94) > Cu (11.36) > Pb (5.08) > Co (3.89) > As (3.78). Our average levels were mostly lower than those reported in worldwide soils. HI decreased in the order of Fe > As > Cr > V > Pb > Ni > Mn > Cu > Co > Zn for adults and children, and was less than 1.0, indicating its insignificance on the human body. The carcinogenic risks for As and Pb, as well as their LCR, were less than (1 × 10⁻⁶), implying no significant health risks. Values of LCR due to exposure for Cr in the ingestion pathway in children were higher than (1 × 10⁻⁴) implying unacceptable risk.
Keywords
Soil contamination
Agricultural impacts
Potentially toxic elements
Carcinogenic risk
Saudi Arabia

1 Introduction
Soil pollution is recognized worldwide as a serious environmental problem, and it is important to investigate the potential ecosystem and human health effects of PTEs in soils. Excessive PTEs in the soil can lead to a reduction in soil quality as well as health risks (Alharbi et al., 2022; Al-Kahtany and El-Sorogy, 2023). PTEs can enter the body through the following three main routes, inhalation of air, ingestion of dust/ soil, and interaction with the skin (Naveedullah, et al., 2014; Al-Kahtany et al., 2023). Studies have shown that excessive PTEs linked to human illnesses, such as cardiovascular, neurological, and chronic kidney diseases, cancers, and even tumors in the human body, as well as general physical health deterioration due to DNA damage and gene expression effects (Song and Li, 2014; Pan et al., 2018).
Urban soils polluted by PTEs, mainly originated from the chemical industry, coal combustion, vehicle emissions, municipal solid waste, the sedimentation of dust, and suspended substances in the atmosphere (Gu et al. 2016). This diverse range of sources makes it difficult to control soil heavy metal contamination, which is a significant environmental pollution issue. Children and infants tend to be subject to PTEs because they are in the complex, delicate, and easily disrupted stages of early childhood (Ma et al., 2016). Children and even older people often face respiratory illnesses due to PTE pollution (De Miguel et al., 2007). Children are susceptible to acute respiratory infections, whereas adults suffer from chronic bronchitis (Peled, 2011; Rahman et al. 2021).
Al-Ammariah is located in the northwest of Riyadh city and characterized is by agricultural farms that produce dates, citrus, leafy green plants, and vegetables. The goals of the current study are (i) to determine the levels of As, Cu, Co, Cr, Fe, Mn, Ni, Pb, V, and Zn contamination in the agricultural soils of Al-Ammariah, (ii) to compare the levels of PTEs in the study area with other worldwide soils and backgrounds, and (iii) to assess the noncarcinogenic and carcinogenic humans health risk from ten different PTEs.
2 Material and methods
2.1 Study area, sampling, and analytical methods
The present study was conducted in the Al-Ammariah region, northwest Riyadh, Saudi Arabia, at 24°0.79040 – 24°0.82500 N and 46°0.42997 – 46°0.49333 E (Fig. 1). The study area consists mainly of marine carbonates and siliciclastics from the upper Jurassic Hanifa Formation, Jubaila Formation, and Quaternary sediments (Hussein et al., 2012; El-Sorogy and Al-Kahtany, 2015; El-Asmar et al., 2015; Youssef and El-Sorogy, 2015; Tawfik et al., 2016; El-Sorogy et al., 2016, 2018; Al-Dabbagh and El-Sorogy, 2016; Khalifa et al., 2021; Alarifi et al., 2022). Thirty-four soil samples were collected at a depth of 5–15 cm in plastic bags for storage and transportation from palm and citrus farms (3 replicates from each site). Soil samples were dried at air temperature and sieved. In a graphite hotplate, approximately an amount of 0.50 g of the 32–63 μm fraction of each prepared sample is digested with nitric acid (HNO3) and hydrochloric acid (HCl) aqua regia for 45 min, before analyzing. Deionized water was used for both solution preparation and dilution. Inductively coupled plasma-atomic emission spectrometry (ICP-AES) was used to analyze Zn, Cu, Co, Cr, Fe, Mn, Ni, Pb, V, and As in the ALS Arabia Lab, Saudi Arabia. The instrument was calibrated for each metal prior to analysis using a set of known standards. All of the calibration curves demonstrated excellent linearity.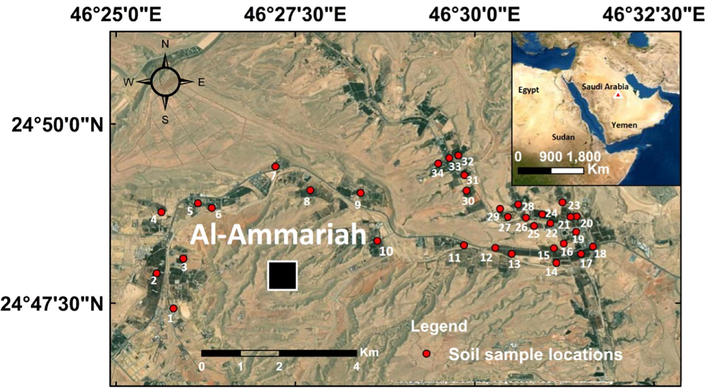
Location map of the study area and sampling sites.
2.2 Data analysis
The CDI (mg/kg/day) was used to calculate the potential health hazard of PTEs via oral ingestion and dermal absorption on exposed skin pathways, using the equations below (Mondal et al., 2021):
The exposure factors in Table 1 are used in CDI measurement. Cr, As, and Pb have the ability to cause carcinogenesis they were thus chosen to estimate the carcinogenic risks (IARC, 2012), while, V, Fe, Co, As, Mn, Ni, Pb, Cr, Zn, and Cu have been estimated as well for noncarcinogenic risk. The hazard index “HI”, which represents the cumulative noncarcinogenic hazard, is calculated by the hazard quotient “HQ” as follows:
Parameter
Value
PTEs
RfD (mg/kg/day)
IngR
100 mg/day (adult), 200 mg/day (children)
V
0.0090
EF
350 days
Cr
0.0030
ED
24 years (adult), 6 years (children)
Cu
0.0371
BW
70 kg (adult), 15 kg (children)
Ni
0.0200
AT
365 × ED adult/children
Pb
0.0035
CF
1 × 10⁻⁶ kg/mg
Fe
0.7000
SA
5700 cm2 event − 1
Mn
0.1400
AFsoil
0.07 mg/cm2
Co
0.0200
ABS
0.001
Zn
0.3000
As
0.0003
The RfD in Table 1 is the reference dose for each PTE. If the HI value is less than 1, no significant risk of noncarcinogenic effects is assumed. If the HI value is greater than 1, there is a chance that non-carcinogenic risk effects will occur, this tends to increase as the HI increases (IRIS, 2020). The following equations are used to calculate the LCR:
CSF denotes the carcinogenic slope factor, which is defined as the risk created by a lifetime average (mg/kg.day) for Cr (0.5), As (0.0085), and Pb (1.5) (IRIS, 2020). If the LCR value between (1 × 10⁻⁶ and 1 × 10⁻⁴) indicates that the carcinogenic risk is acceptable. If the value is greater than (1 × 10⁻⁴), the risk is considered unacceptable. LCR values less than (1 × 10⁻⁶) indicate that no significant health risks exist (Mondal et al., 2021).
3 Results and discussion
3.1 Concentrations of potentially toxic elements
Table 2 presented the concentration of the PTEs (μg/g) in the soil. The average PTEs levels in the Al-Ammariah area were in the following descending order: Fe (11581) > Mn (180) > Zn (52.17) > Ni (26.94) > Cr (19.97) > V (18.94) > Cu (11.36) > Pb (5.08) > Co (3.89) > As (3.78). Table 3 compares the average values in the study area to international background references, and sediment quality. The average PTE concentrations in Al-Ammariah soil were lower than those observed elsewhere in soils around the world (Kabata-Pendias, 2011), Earth’s crust (Turekian and Wedepohl, 1961; Yaroshevsky, 2006), and the continental crust (Taylor, 1964; Rudnick and Gao 2003). However, average value of As showed fluctuating values among the last mentioned references. Hierarchical cluster analyses “HCA” and Pearson correlation coefficient used to identify the sources of PTEs in the investigated in soils (Alharbi and El-Sorogy, 2021). Q-mode HCA classified the soil samples into three groups (Fig. 2). The first group accounts for 16 samples (S1, S3, S4, S6, S7, S10, S11, S13, S15, S16, S22, S23, S26, S31, S32, and S33), which had the lowest concentration of all PTEs, except Cu and Zn. The second group includes 18 samples (S2, S5, S8, S11, S9, S12, S14, S17-S21, S24, S25, S27- S30, and S34), which had the highest concentrations of Co, Cr, Fe, Pb, V, Mn, Ni, and As. The positive correlations result between Fe-As, Fe-Co, Fe-Cr, Fe-Mn, Fe-Ni, Fe-Pb, and Fe-V (Table 4), indicate a similar source for these PTEs, mainly from natural factors due to the presence of Mn and Fe (Wang et al., 2021; Alharbi and El-Sorogy, 2023). In the other hand, there is negative and weak correlations between Fe and each of Cu and Zn, suggesting that these two PTEs may be came from different sources, primarily from agricultural applications and P fertilizers (Alharbi and El-Sorogy, 2019; Nuralykyzy et al., 2021).
S.N.
As
Cu
Co
Cr
Fe
Mn
Ni
Pb
V
Zn
S1
2.00
12.0
3.00
13.0
8900
165
23.0
4.00
13.0
39.0
S2
6.00
16.0
8.00
34.0
18,100
289
44.0
8.00
33.0
46.0
S3
5.00
8.00
4.00
18.0
10,300
163
22.0
4.00
19.0
26.0
S4
4.00
10.0
4.00
19.0
10,900
182
23.0
5.00
19.0
36.0
S5
3.00
22.0
5.00
22.0
11,700
202
28.0
5.00
20.0
65.0
S6
1.00
18.0
1.00
8.0
6900
93
5.00
2.00
7.00
78.0
S7
3.00
7.00
4.00
16.0
9400
145
19.0
4.00
16.0
22.0
S8
5.00
13.0
6.00
29.0
15,400
245
40.0
6.00
29.0
38.0
S9
5.00
10.0
4.00
21.0
12,700
190
27.0
6.00
21.0
33.0
S10
4.00
5.00
2.00
13.0
8600
116
16.0
4.00
15.0
14.0
S11
4.00
4.00
2.00
12.0
7200
139
14.0
3.00
11.0
23.0
S12
4.00
11.0
6.00
26.0
15,300
227
32.0
5.00
25.0
31.0
S13
4.00
7.00
3.00
14.0
9200
133
22.0
4.00
16.0
23.0
S14
3.00
7.00
3.00
15.0
12,000
157
16.0
5.00
14.0
28.0
S15
3.00
9.00
3.00
20.0
11,000
151
22.0
8.00
20.0
34.0
S16
2.00
7.00
2.00
12.0
8400
101
9.00
3.00
9.00
27.0
S17
5.00
11.0
3.00
19.0
11,700
170
26.0
7.00
17.0
51.0
S18
6.00
10.0
4.00
23.0
13,000
191
35.0
7.00
22.0
32.0
S19
5.00
13.0
5.00
27.0
15,100
226
43.0
6.00
26.0
31.0
S20
4.00
12.0
5.00
23.0
11,800
195
34.0
5.00
20.0
41.0
S21
5.00
13.0
6.00
30.0
15,100
254
45.0
7.00
27.0
46.0
S22
1.00
4.00
2.00
10.0
8500
104
8.00
3.00
8.00
155
S23
3.00
10.0
3.00
17.0
10,300
145
26.0
6.00
17.0
33.0
S24
4.00
13.0
4.00
22.0
12,000
181
31.0
6.00
20.0
37.0
S25
5.00
10.0
4.00
22.0
12,700
145
31.0
5.00
22.0
35.0
S26
4.00
30.0
4.00
21.0
10,400
205
27.0
4.00
17.0
261
S27
5.00
13.0
6.00
33.0
15,600
275
51.0
6.00
30.0
39.0
S28
3.00
16.0
4.00
24.0
13,200
311
33.0
5.00
22.0
89.0
S29
5.00
14.0
5.00
25.0
13,600
214
37.0
7.00
24.0
51.0
S30
4.00
12.0
4.00
24.0
13,300
210
35.0
6.00
22.0
46.0
S31
3.00
6.00
2.00
16.0
9500
128
20.0
5.00
15.0
21.0
S32
4.00
9.00
4.00
19.0
10,800
168
29.0
3.00
18.0
30.0
S33
2.00
5.00
2.00
10.0
7000
84
11.0
3.00
8.00
14.0
S34
3.00
8.00
4.00
20.0
12,300
167
30.0
6.00
20.0
28.0
Location and reference
Ni
Zn
Cu
As
Pb
Cr
V
Co
Present study
26.94
52.17
11.36
3.78
5.08
19.97
18.94
3.89
Worldwide soils (Kabata-Pendias 2011)
29.00
70.00
38.90
6.83
27.00
59.50
129.0
11.30
Earth’s crust (Yaroshevsky, 2006)
58.00
83.00
47.00
1.70
16.00
83.00
90.00
18.00
Continental crust (Rudnick and Gao, 2003)
47.00
67.00
28.00
4.80
17.00
92.00
97.00
17.30
Earth’s crust (Turekian and Wedepohl, 1961)
68.00
95.00
45.00
13.00
20.00
90.00
130.0
19.00
Continental crust (Taylor, 1964)
75.00
70.00
55.00
1.80
12.50
100.0
135.0
25.00
Maximum allowable concentrations Kabata-Pendias (2011)
60.00
300.0
150.0
20.00
300.0
200.0
150.0
50.00
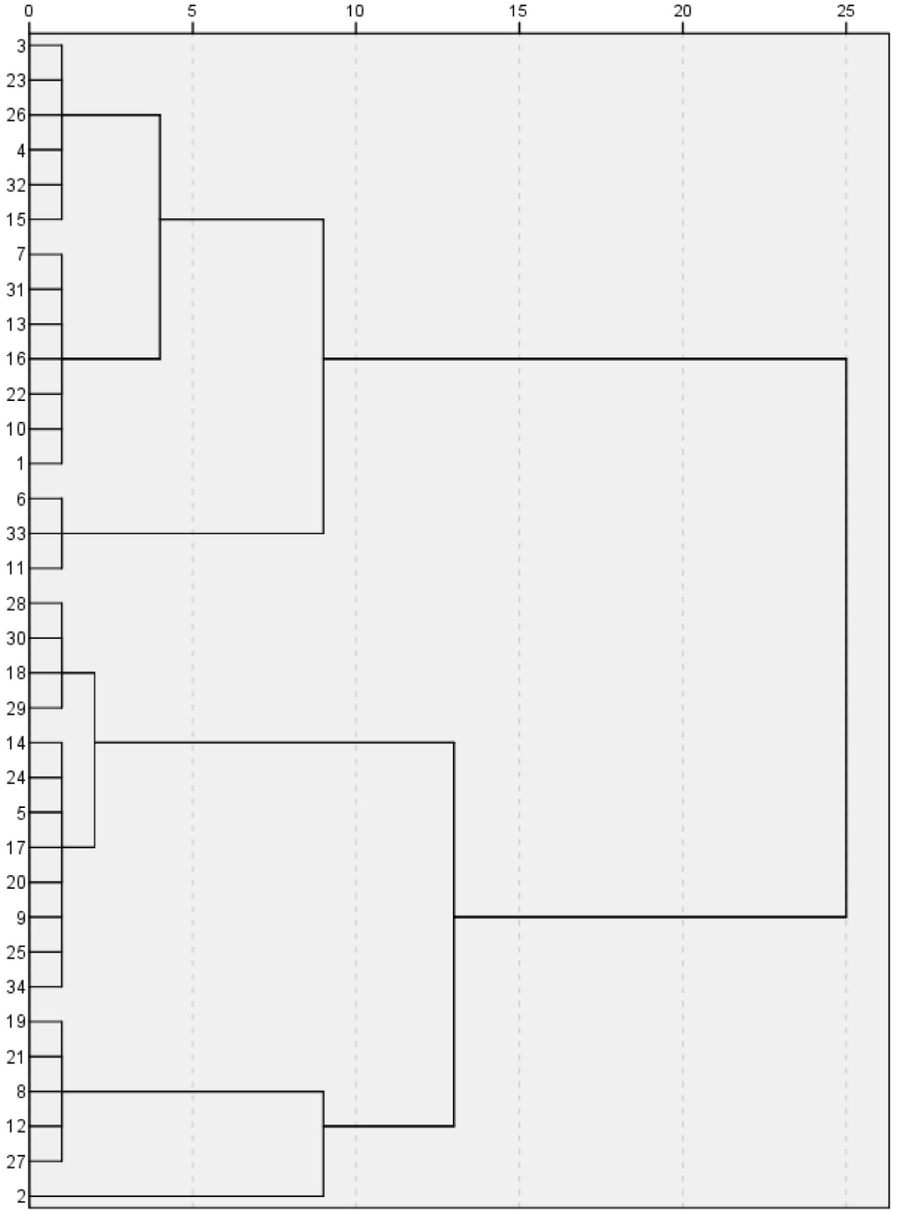
Q mode HCA of soil samples.
As
Co
Cr
Cu
Mn
Ni
Pb
V
Zn
Fe
As
1
Co
0.681**
1
Cr
0.743**
0.933**
1
Cu
0.160
0.418*
0.436**
1
Mn
0.599**
0.855**
0.906**
0.523**
1
Ni
0.749**
0.879**
0.960**
0.396*
0.873**
1
Pb
0.634**
0.615**
0.746**
0.186
0.604**
0.718**
1
V
0.786**
0.925**
0.977**
0.349*
0.872**
0.946**
0.765**
1
Zn
−0.178
−0.015
−0.004
0.650**
0.130
−0.055
−0.162
−0.113
1
Fe
0.705**
0.910**
0.958**
0.346*
0.872**
0.905**
0.764**
0.953**
−0.059
1
3.2 Health risk assessment
3.2.1 Non-carcinogenic risk
The CDI, HQ, and HI for noncarcinogenic risk of PTEs from exposure pathways such as ingestion and dermal contact are depicted in Table 5. In comparison between the two pathways of PTEs, it is noticed that the ingestion of soil particles for all metals was hundreds of magnitudes much higher than absorption with soil particles, and generally followed the order of non-dietary ingestion > dermal contact, suggesting that ingestion was the most common route of exposure for both children and adults. In adults, the average HQs ranged between 0.000215 and 0.022557 in non-dietary ingestion, and from 8.59E-07 to 6.91E-05 in dermal contact. In children, the average HQs ranged between 0.000215 and 0.161698 in non-dietary ingestion, and from 8.59E-07 to 0.000323 in dermal contact. The average HI of PTEs for the adults and children decreased in the order of Fe > As > Cr > Ni > Pb > V > Mn > Cu > Co > Zn. HI values were greater in children rather than in adults. The noncarcinogenic risks of heavy metal exposure for children are higher than for adults due to their physiological characteristics. Children ingest significant quantities of soil due to their finger sucking behavior, therefore, children are always more susceptible to a given dose of toxin (Zhao et al., 2013; Pan et al., 2018). Values of HI varied from 0.000239 to 0.017258 in adults, and from 0.002228 to 0.161038 in children. Meanwhile, the health risk for adults was lower compared to the risk for children (Fig. 3). According to USEPA (2002), the reported hazard index among all ages was less than the US EPA threshold limit for not cancerous risks. The higher HI due to ingestion of soils by the children may be attributed to the fact that children are particularly more sensitive to the exposure to toxic metals in soil than adults because they may absorb much more PTEs from soil during their outdoor play activities (Parlak et al., 2022).
HMs
Adults
CDI Ing.
CDI Dermal
HQ Ing.
HQ Demal
HI
As
5.2E-06
2.07E-08
0.017325
6.91E-05
0.017258
Cr
2.73E-05
1.09E-07
0.009092
3.63E-05
0.009156
Pb
6.97E-06
2.78E-08
0.001991
7.95E-06
0.001998
V
2.59E-05
1.03E-07
0.002874
1.15E-05
0.002895
Cu
1.51E-05
6.03E-08
0.000407
1.62E-06
0.000421
Ni
3.68E-05
1.47E-07
0.001841
7.35E-06
0.001853
Zn
6.46E-05
2.58E-07
0.000215
8.59E-07
0.000239
Co
5.28E-06
2.11E-08
0.000264
1.05E-06
0.000267
Fe
0.01579
6.3E-05
0.022557
9E-05
0.022753
Mn
0.000245
9.76E-07
0.001747
6.97E-06
0.001764
HMs
Children
CDI Ing.
CDI Dermal
HQ Ing.
HQ Demal
Hi
As
4.85E-05
9.68E-08
0.161698
0.000323
0.161038
Cr
0.000255
5.08E-07
0.08486
0.000169
0.085287
Pb
6.97E-06
2.78E-08
0.001991
7.95E-06
0.018606
V
0.000241
4.82E-07
0.026824
5.35E-05
0.026966
Cu
0.000141
2.81E-07
0.003801
7.58E-06
0.003923
Ni
3.68E-05
1.47E-07
0.001841
7.35E-06
0.017259
Zn
6.46E-05
2.58E-07
0.000215
8.59E-07
0.002228
Co
4.93E-05
9.83E-08
0.002463
4.91E-06
0.002491
Fe
0.14737
0.000294
0.210529
0.00042
0.211939
Mn
0.002283
4.55E-06
0.016307
3.25E-05
0.016436
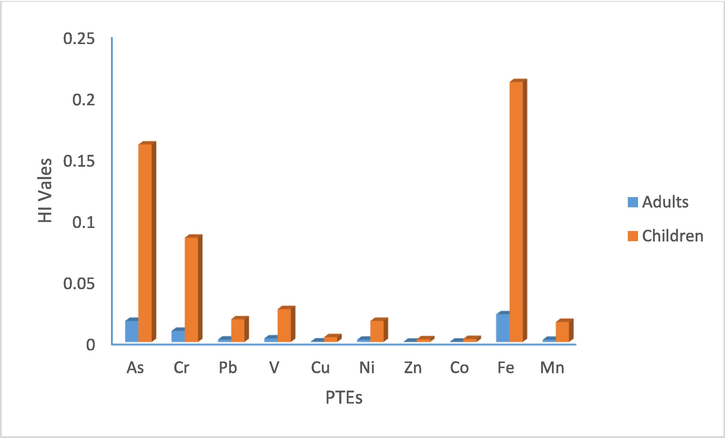
Average values of HI in adults and children due to PTEs.
3.2.2 Carcinogenic risk
The cancer risks were only estimated for Cr, As, and Pb (Table 6), due to lack of a carcinogenic SF for the remaining PTEs. Results showed that the risks were decreased in the sequence of Cr > As > Pb. The carcinogenic risk level via non-dietary ingestion was significantly higher than the risk level via dermal contact for both adults and children. The carcinogenic risks in children ranged from 2.36 × 10⁻¹⁰ to 1.45 × 10⁻⁷ in dermal contact, and from 5.92 × 10⁻⁸ to 1.27 × 10⁻⁴ through ingestion. In adults, the average values of the carcinogenic risks varied from 2.36 × 10⁻¹⁰ to 3.11 × 10⁻⁸ in dermal contact, and from 5.92 × 10⁻⁸ to 1.36 × 10⁻⁵ through ingestion (Table 6, Fig. 4). Levels of carcinogenic risks for these PTEs were lower than the tolerable range (1 × 10⁻⁶ – 1 × 10⁻⁴), indicated no significant health effects (Nour et al., 2022). The average level of carcinogenic risk of Cr in children due to ingestion exposure was greater than 1 × 10⁻⁴ exceeded the acceptable level. In the investigated soil, the total cancer risk was largely contributed by ingestion and followed by dermal pathway. The total cancer risk (LCR) for adults due to Cd, As and Cr was 5.94 × 10⁻⁸, 7.83 × 10⁻⁶, and 1.37 × 10⁻⁵, respectively, and 5.94 × 10⁻⁸, 7.29 × 10⁻⁵, and 1.27 × 10⁻⁴ for children. The LCR values reported in the study were acceptable for adults as well as children, as they located within the United states environmental protection agency (1 × 10⁻⁶ – 1 × 10⁻⁴). Some individual samples showed LCR values for ingestion way for Cr in children higher than 1 × 10⁻⁴ (e.g., S2-S5, S7-S9, and S27-S31), implying unacceptable risk.
HMs
Adults
Children
CR Ing.
CR Dermal
LCR
CR Ing.
CR Dermal
LCR
As
7.8 × 10⁻⁶
3.11 × 10⁻⁸
7.83 × 10⁻⁶
7.28 × 10⁻⁵
1.45 × 10⁻⁷
7.29 × 10⁻⁵
Cr
1.36 × 10⁻⁵
5.44 × 10⁻⁸
1.37 × 10⁻⁵
1.27 × 10⁻⁴
2.54 × 10⁻⁷
1.27 × 10⁻⁴
Pb
5.92 × 10⁻⁸
2.36 × 10⁻¹⁰
5.94 × 10⁻⁸
5.92 × 10⁻⁸
2.36 × 10⁻¹⁰
5.94 × 10⁻⁸
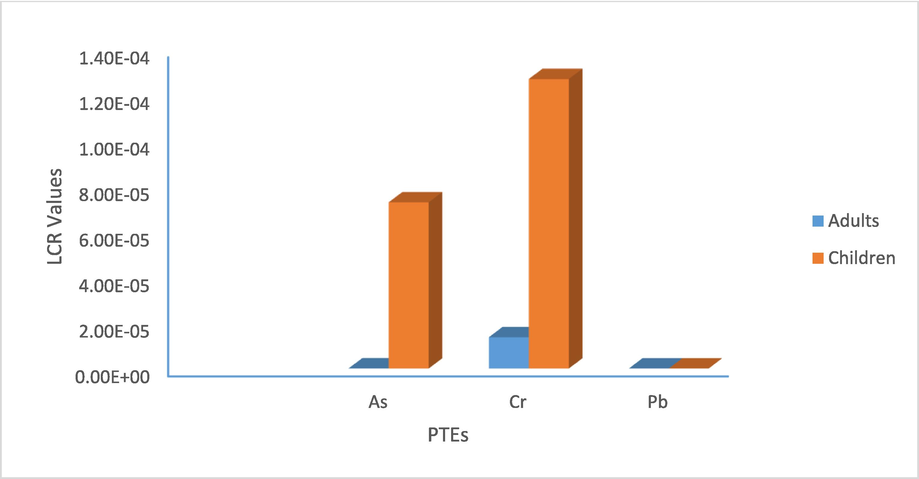
Average values of LCR in adults and children due to PTEs.
4 Conclusions
The contamination, carcinogenic, and noncarcinogenic hazards associated with As, Cu, Co, Cr, Fe, Mn, Ni, Pb, V, and Zn in agricultural soil from Al-Ammariah area. The pathways considered for humans were ingestion and dermal contact. The hazard index was estimated to be below than one, while excess cancer risks of As and Pb were located between 1 × 10⁻⁶ and 1 × 10⁻⁴, indicated acceptable for both children and adults. Some LCR values of Cr for ingestion way in children showed values higher than 1 × 10⁻⁴ implying unacceptable risk. Environmental protection agencies recommended to continuous assess of the PTEs exposure in soils, and more work is needed to assess the risks to the residents, especially children.
Acknowledgments
The authors extend their appreciation to the Deputyship for Research and Innovation, “Ministry of Education” in Saudi Arabia for funding this research (IFKSUOR3-447-1).
Declaration of Competing Interest
The authors declare that they have no known competing financial interests or personal relationships that could have appeared to influence the work reported in this paper.
References
- Contamination and environmental risk assessment of potentially toxic elements in soils of palm farms in Northwest Riyadh, Saudi Arabia. Sustainability. 2022;14:15402.
- [CrossRef] [Google Scholar]
- Diagenetic alterations of the upper jurassic scleractinian corals, hanifa formation, jabal al-abakkayn, central saudi arabia. J. Geol. Soc. India. 2016;87:337-344.
- [Google Scholar]
- Contamination and health risk assessment of arsenic and chromium in coastal sediments of Al-Khobar area, Arabian Gulf, Saudi Arabia. Marine Pollut. Bull.. 2022;185:114255
- [CrossRef] [Google Scholar]
- Assessment of seawater pollution of the Al-Khafji coastal area, Arabian Gulf, Saudi Arabia. Environ. Monitor. Assess.. 2019;191:383.
- [Google Scholar]
- Spatial distribution and risk assessment of heavy metals pollution in soils of marine origin in central Saudi Arabia. Mar. Pollut. Bull.. 2021;170:112605
- [Google Scholar]
- Risk assessment of potentially toxic elements in agricultural soils of Al-Ahsa Oasis, Saudi Arabia. Sustainability. 2023;15:659.
- [CrossRef] [Google Scholar]
- Contamination and health risk assessment of surface sediments along Ras Abu Ali Island, Saudi Arabia. J. King Saud Univ. – Sci.. 2023;35:102509
- [CrossRef] [Google Scholar]
- Heavy metal pollution in surface sediments and human health assessment in southern Al-Khobar coast, Saudi Arabia. Marine Pollut. Bull.. 2023;187:114508
- [CrossRef] [Google Scholar]
- Risk-based evaluation of the exposure of children to trace elements in playgrounds in Madrid (Spain) Chemosphere. 2007;66(3):505-513.
- [Google Scholar]
- Facies analysis and depositional environments of the Upper Jurassic Jubaila Formation, Central Saudi Arabia. J. Afr. Earth Sc.. 2015;110:34-51.
- [Google Scholar]
- Contribution to the scleractinian corals of Hanifa Formation, Upper Jurassic, Jabal al-Abakkayn Central Saudi Arabia. Hist. Biol.. 2015;27(1):90-102.
- [Google Scholar]
- Depositional architecture and sequence stratigraphy of the Upper Jurassic Hanifa Formation, central Saudi Arabia. J. Afr. Earth Sc.. 2018;139:367-378.
- [Google Scholar]
- Microfacies and diagenesis of the reefal limestone, Callovian Tuwaiq Mountain Limestone Formation, central Saudi Arabia. J. Afr. Earth Sc.. 2016;115:63-70.
- [Google Scholar]
- Contamination, bioaccessibility and human health risk of heavy metals in exposed-lawn soils from 28 urban parks in southern China’s largest city, Guangzhou. Appl. Geochem.. 2016;67:52-58.
- [Google Scholar]
- Potentiality of secondary aquifers in Saudi Arabia: evaluation of groundwater quality in Jubaila limestone. Int. J. Geosci.. 2012;3:71-80.
- [Google Scholar]
- IARC, 2012. A Review of human carcinogens: Personal habits and indoor combustions; World Health Organization: Lyon, France, Volume 100.
- IRIS. Program Database., 2020. Available online: https://cfpub.epa.gov/ncea/iris/search/index.cfm (accessed on 18 September 2020).
- Kabata-Pendias, A., 2011. Trace Elements of Soils and Plants, fourth ed., CRC Press, Taylor & Francis Group, LLC, USA, p. 505.
- Microfacies architecture and depositional history of the Upper Jurassic (kimmeridgian) Jubaila Formation in central Saudi Arabia. J. Afr. Earth Sc.. 2021;174:104076
- [Google Scholar]
- Estimation of the daily soil/dust (SD) ingestion rate of children from Gansu Province, China via hand-to-mouth contact using tracer elements. Environ Geochem Health. 2016
- [CrossRef] [Google Scholar]
- Health Risk and Geochemical Assessment of Trace Elements in Surface Sediment along the Hooghly (Ganges) River Estuary (India) Water. 2021;13:110.
- [Google Scholar]
- Concentrations and Human Health Risk Assessment of Selected Heavy Metals in Surface Water of the Siling Reservoir Watershed in Zhejiang Province, China. Pol. J. Environ. Stud.. 2014;23(3):801-811.
- [Google Scholar]
- Assessment of heavy metal contamination and health risk in the coastal sediments of Suez Bay, Gulf of Suez, Egypt. J. Afr. Earth Sci.. 2022;195:104663
- [CrossRef] [Google Scholar]
- Heavy metal contents and assessment of soil contamination in different land-use types in the Qaidam Basin. Sustainability. 2021;13:12020.
- [CrossRef] [Google Scholar]
- A review of heavy metal pollution levels and health risk assessment of urban soils in Chinese cities. Environ. Sci. Pollut. Res.. 2018;2018(25):1055-1069.
- [CrossRef] [Google Scholar]
- Heavy metals in soil and sand from playgrounds of Çanakkale City (Turkey), and related health risks for children. Sustainability. 2022;14(3):1145.
- [CrossRef] [Google Scholar]
- Elemental analysis in surface soil and dust of roadside academic institutions in Dhaka city, Bangladesh and their impact on human health. Environ. Chem. Ecotoxicol.. 2021;3:197-208.
- [Google Scholar]
- A review on human health consequences of metals exposure to, e-waste in China. Environ. Pollut.. 2014;196C:450-461.
- [Google Scholar]
- Sequence stratigraphy of the late middle Jurassic open shelf platform of the Tuwaiq Mountain Limestone Formation, central Saudi Arabia. Proc. Geol. Assoc. Proc. Geol. Assoc.. 2016;127:395-412.
- [Google Scholar]
- Abundance of chemical elements in the continental crust: a new table. Geochim. Cosmochim. Acta. 1964;28:1273-1285.
- [Google Scholar]
- Distribution of the elements in some major units of the Earth’s Crust. Geol. Soc. Am. Bull.. 1961;72:175-192.
- [Google Scholar]
- USEPA, 2002. Supplemental guidance for developing soil screening levels for superfund sites. U. S. Environmental Protection Agency, Office of Emergency and Remedial Response, Washington.
- USEPA, 2011. Exposure Factors Handbook 2011 Edition (Final)., U.S. Environmental Protection Agency. Washington, DC, EPA/600/R-09/052F, https://www.nrc.gov/docs/ML1400/ML14007A666.pdf
- Dong, H. source and health risk assessment of heavy metals in soil-ginger system in the jing river basin of Shandong province, North China. Int. J. Environ. Res. Public Health. 2021;18:6749.
- [CrossRef] [Google Scholar]
- Abundances of chemical elements in the Earth’s crust. Geochem. Int.. 2006;44(1):48-55.
- [Google Scholar]
- Palaeoecology of benthic foraminifera in coral reefs recorded in the Jurassic Tuwaiq Mountain Formation of the Khashm Al-Qaddiyah area, central Saudi Arabia. J. Earth Sci.. 2015;26(2):224-235.
- [Google Scholar]
- Source identification and health risk assessment of metals in urban soils around the Tanggu chemical industrial district, Tianjin, China. Sci. Total Environ. 2013 468–469C:654–662
- [Google Scholar]


