

Translate this page into:
Construction of an optical sensor for molybdenum determination based on a new ionophore immobilized on a polymer membrane
⁎Corresponding author. asamin2005@hotmail.com (Alaa S. Amin)
-
Received: ,
Accepted: ,
This article was originally published by Elsevier and was migrated to Scientific Scholar after the change of Publisher.
Peer review under responsibility of King Saud University.
Abstract
Objectives
In this study, a new optical chemical sensor to assess molybdenum ion by incorporation of 1-(2-benzothiazolylazo)-2-hydroxy-3-naphthoic acid (BTAHN), dibutylphthalate (DBP) and sodium tetraphenylborate (NaTPB) to the plasticized poly vinyl chloride (PVC) matrices were prepared.
Methods
When DBP was added to the membrane, the ionophore's tendency to act as a chromoionophore was greatly increased. Great stability, reproducibility, extended life time, and respectable selectivity for Mo6+ ion assessment throughout a wide number of transition, lanthanides, and heavy metals were all advantages of the accomplished sensor.
Results
At optimum compositions and investigational circumstances, the sensor response was linear cross range of 8.5 × 10⁻⁸ to 4.4 × 10⁻⁵ mol/L. Sensor detection and quantification limits realistic on the definition that the sample amount results in a signal equal to the blank signal plus three and ten times of its standard deviation were establish to be 2.5 × 10⁻⁸ and 8.3 × 10⁻⁸ mol/L. The sensor reaction time (characterized as the time it required for the absorbance value to reach 95 %) was 3.0–5.0 min.
Conclusions
The achieved optical sensor was successfully applied to assess Mo6+ ion content in water, food, plant, and environmental samples.
Keywords
Molybdenum determination
Optical sensor
Plasticized poly vinyl chloride membrane
Colorimetry
Environmental analysis

1 Introduction
Molybdenum (Mo) is crucial for the catalysis of redox processes, including the oxidation of aldehydes as well as other purines (Stiefel, 1996), and reduction of nitrates and molecular nitrogen. A Mo lack in the human nutrition harmfully influences growth and can result to neurological problems. Intake of high levels of Mo causes severe gastrointestinal irritation owing to cardiac failure (Das et al., 2007). Extra Mo can also result in muscle distortion, caries-prone teeth, and problems with fat and protein metabolism. Foods provide varying levels of Mo in the diet. Mo is known to accumulate in considerable concentrations in some natural plants, notably leguminous ones. Also, leafy vegetables and spices are high in Mo. The excess quantities of Mo in the liver are owing to the metal being stored, principally as a constituent of the Mo cofactor. The great and frequent intake of the above-revealed foodstuffs can improved the Mo intake considerably. Since Mo levels in foods and drinks are so low, it is critical to improve sensitive, selective, efficient, and cost-effective analytical procedures for assessing it, even when it's exist in trace amounts.
Weathering, including the use of molybdenum components in agriculture and industrial activities, can liberate molybdenum into the surroundings. Diet is the most essential source of molybdenum for the public contamination; its content is generally low in water and air. Molybdenum has a low toxicity when compared to several metals used in industry (Sb, As, Be, Cd, Cr, Pb, and Hg), but it can be harmful at greater amounts. Furthermore, the assessment of Mo in seawater is very significant; subsequently this metal is a part of biochemical phenomena in most marine flora and fauna (Filik et al., 2009).
Because of its special characteristics and relevance in nature, Mo has received much interest when it comes to establishing evaluation techniques. Techniques currently recognized include several optical approaches (Ferreira et al., 2003), electroanalytical techniques (Ensafi et al., 2004). Detection of Mo by flow injection analysis followed by various techniques such as ETAAS (Santos et al., 2001), ICP-OES (Madrakian and Ghazizadeh, 2008), and spectrophoto-metry (Nakano et al., 2010) has also been established. There are diverse analytical methodologies accessible for the Mo assessment like inductively coupled plasma-mass spectrometry (Koplik et al., 2006) (ICP-MS), inductively coupled plasma-atomic emission spectrometry (ICP-OES) (Madrakian and Ghazizadeh, 2008), flame atomic absorption spectrometry (FAAS) (Ferreira et al., 2003), adsorptive stripping voltammetry (AdSV) (Rojas-Romo et al., 2020). These procedures can represent a wide linear range and good detection limits, whereas, most of them need to employ very expensive devices in the laboratory and a qualified staff for the application. However, spectrophotometric methods have several advantages over sophisticated methods as cost, fast response time, in addition to highly precision.
Lately, an interest has enhanced on the optical sensors achievement compared to electrochemical sensors (Ganjali et al., 2009). The optical chemical sensor technology includes the key processes of analytes chemical recognition of significant and consequent transduction of the analytical signals. These sensors have greater analytical properties and they do not require internal and external reference instruments, their preconditioning time are rapid and are not subjected to electrical noise (Absalan et al., 2010). The sensor choice matrices are influenced by parameters like analyte permeability, price, mechanical features, and chromophore immobilisation appropriateness, as well as uptake (Kalyan et al., 2009).
The most widely employed polymers are PVC groups. They list a variety of attractive characteristics and perform well in most applications when compared to sol–gel matrices (Rastegarzadeh et al., 2010). Several sensors have been stated in trace analysis of various analytes like metal ions, anions and organic compounds (Beiraghi et al., 2011). Generally, in combination, sensors are applied with cheap spectrophotometric procedures to offer easy and rapid assessment procedures with better selectivity (Amin, 2018). In optical sensors that applied for heavy metals, various techniques have useful for immobilization of reagents, like electrostatic attraction to a resin (Badini et al., 1995), electrostatic attraction to a resin (Mahendra et al., 2002), and incorporation into PVC membranes (Shamsipur et al., 2006). Subsequently particularly PVC and polymer matrix can simply trap the ionophore depend on liquid membrane system, a reasonable deal of interesting has dedicated on the PVC-based membranes (Rouhollahi and Shamsipur, 1999). Spectrophotometric procedures offer various appealing features such as: easy instrumentation, short response times and simple operation.
In this paper, highly selective and sensitive optical sensor for Mo6+ was illustrated and successfully used for the environmental samples analysis. The achieved sensor has several advantages: (1) Highly sensitive for Mo6+ ion and selective; (2) Operation in the visible range; (3) easily preparation of ionophore with great yield in rapid time; (4) broad dynamic working range; (5) Applicability in various matrices; (6) Low RSD, minimal detection limit and greater recoveries comparable with costly devices like NAA, ICP-MS ICP-AES and FAAS.
2 Materials and methods
2.1 Instrumentation
An Orion research model 601 A/digital analyzer pH meter was employed to investigate he pH of solutions. A Hamilton syringe (10 μL) was used to deliver small volumes of reagent metal into the cell. UV–vis spectrophoto-meter model V 53 from JASCO (Tokyo, Japan) was achieved for assessing the spectra and the absorbance assessments. A Perkin-Elmer model 5300 DV; ICP-AES (Waltham, MA, USA) was applied for all ICP-AES measurements. The operating factors were set as received by the manufacturer. The absorbance assessments were set by mounting the optical membrane sensors samples inside a quartz cuvette. The absorbance of the optical membrane sensor samples was detected in respect to air and a blank optode sample.
2.2 Reagents
Except for vacuum drying, all reagents from Merck (Dermasdat, Germany) were analytical reagent quality and used as purchased, with no additional purification. In the spectrophotometric solution investigations, sodium tetraphenylborate (NaTPB) was applied as an ionic strength stabilizer and an additive (in the membranes). High molecular weight poly vinyl chloride (PVC), dibutyl phthalate (DBP), and newly distilled tetrahydrofuran (THF) were utilized to prepare the membranes. The metal ions that were evaluated were the nitrate salts of the metal ions. All the solutions were prepared using reagent grade substances and doubly distilled water. Standard stock solution of Mo6+ (100 µg/mL) was prepared by dissolving of 0.0184 g of (NH4)6Mo24·4H2O (Merck) in bi-distilled water and diluted to 100 mL in a standard flask and subsequent standardization by EDTA titration. Analar grade or comparable grade water-soluble salts were used to make a large number of inorganic ions. Special dissolve procedures were used for insoluble compounds. Throughout the experiment, double-distilled water was supplied.
1-(2-Benzothiazolylazo)-2-hydroxy-3-naphthoic acid (BTAHN) used in the present paper was synthesized according to the procedure ascribed previously (Amin, 1999; Amin, 2000). Acetate, borate, thiel, phosphate and universal buffer solutions of various pH values 2.0–12 were prepared. Interfering ion stock solutions of 20000 µg/mL were made by dissolving specified quantities of relevant salts in double distilled water.
2.3 Preparation of the membrane sensor
The sensor membranes were prepared by mixing 62 mg plasticizer (DBP), 31 mg PVC, 2.5 mg of BTAHN and 4.5 mg NaTPB. These components were fully dissolved in 2.0 mL THF. The THF cocktail was poured and put onto the glass plate at a volume of 200 µ L. All glass plates were washed with pure THF to eliminate dust and organic contaminants subsequent to coating. The membrane was left to dry in air for 15 min after 3.0 min of spinning (by a spin-on instrument) at 600 rpm. The thickness of the membrane was 5.0–7.0 µm. The reference membrane was identical to the test membrane except that it was devoid of reagent.
2.4 Procedure
The sensor membrane was inserted in a spectrophotometer cell with 2.5 mL of pH 7.25 acetate buffer. Then adding calculated amount of Mo6+ ion solution, the sample's absorption spectra was evaluated at 1.0 cm intervals against a reference blank membrane in the wavelength range 400–750 nm.
2.5 Analysis of water samples
A tap water sample was gathered from Benha city line, a commercial natural drinking water and mineral water collected from local market in Benha, Egypt. These samples were analyzed to its Mo6+ ion content. The water samples were filtered through Whatman filter paper (No. 40). Then the previous technique was used after applying 2.5 mL of pH 7.25 buffer solution.
A seawater sample was filtered to eliminate suspended particles. A 100-mL portion of the sample was taken into a 250-mL flask and diluted with water to the mark (dilution was required to reduce a high ionic strength of the solution). The Alexandria seawater was employed as a matrix for the verification of the procedure. Molybdenum that existent initially in the sample was precipitated with a 0.1 % solution of α-benzoinoxime at pH 1.0–7.0. The precipitate was extracted with chloroform quantitatively. The analysis was achieved by the added–found method 5.0–60 ng/mL Mo6+ was added.
2.6 Procedure of soil sample
A sample (3.0–4.0 g) of air-dried soil was pre-calcined at 450 °C and placed in a glassy-carbon crucible. Concentrated H2SO4 (0.6 mL per 1.0 g of soil) was added to the sample, the mixture was gently heated until the dissolution was accomplished. The residue accomplished was dissolved in 2.0 mol/L NaOH to the complete precipitation of Fe(OH)3. The Fe(OH)3 precipitate was separated carefully by filtration through a white-ribbon filter. The filtrate was acidified with HCl added drop wise to pH ∼ 2.0, 30 mL of water was added. The solution was moved to a 250-mL flask and diluted with water to the mark. To verify the procedure, the total molybdenum was assessed in soil sample by the added–found method. Several replicates, was prepared approximately 0.08 or 0.16 wt% molybdenum was added, and the initial amount of Mo6+ in the sample was neglected. The achieved solution was light yellow; and the previous procedure was applied for the assessment of molybdenum.
2.7 Determination of molybdenum in human urine samples
The recommended procedure has been applied to assess Mo6+ level in urine samples “normal” individuals human urine samples between 25 and 50 years old. The samples were acidified with 1.0 % HNO3 to the pH of the standard Mo6+ solution and evaporated if necessary to known volume. The above method was used after adjustment of pH to 7.25 for the assessment of Mo6+ in urine samples. Some of the samples containing high concentration of Mo6+, and thus it were essential to dilute them to known volume prior to analysis.
2.8 Procedure for food and beverage samples
For the assessment of Mo in food samples, approximately 1.0 g of the each sample (apple, banana, cucumber, peas, rice, soybeans, tomato, and tea) was first ashed at 500 °C for 6.0 h in a crucible. The ash was slightly moistened after cooling with 2.0 mL of 1:1 (v/ v) HNO3. Then, the content was heated to proximate dryness using a hotplate. In 5.0 mL 1.0 mol/L HNO3, the residue was dissolved. The solution was gathered in a 25 mL measuring flask after filtration and diluted with water to the mark. Then, 1.0 mL of the resulting clear solution was poured into a 50 mL measuring flask, made up to volume with water and analyzed by means of both the proposed and independent ICP-AES procedures under the optimum conditions. Externally spiked three point standard addition calibration curves at various concentration levels were used to characterize the amounts of Mo6+, depending on the type and composition of the sample.
For the beverage samples analysis, a wet digestion method was applied. A 3.0 mL of concentrated HNO3 and 5.0 mL of 30 % (w/w) H2O2 were added to 30 mL of beverage sample. Then, to eliminate excess H2O2, minimize the matrix influence, and analyte loss due to volatilization, the samples were evaporated near dryness and diluted to 50 mL with 0.1 mol/L HNO3 solution. Then, the pH of samples was adjusted to approximately 7.25 by using the NH4OH solution of 2.0 mol/L, and aliquot of 10 of these diluted solutions was analyzed. In order to suppress the interference effect of WO42− ions, masking agents like sodium–potassium tartrate was added whenever necessary. The solution was filtered and then examined using the above-mentioned technique.
2.9 Procedure for leaves of plants samples
The plants leaves (mint, pepper black and fenugreek) were gathered from growing lands in a city vicinity of Moshtohor, Egypt. The samples were positioned in plastic bags. To remove any debris or soil, the leaves of the plants were carefully rinsed with tap water before being cleansed with distilled water. At 25 ± 2.0 °C, the samples were dried on a sheet of paper to avoid any excess moisture. The leaves were dried in an oven at 80 °C before being pulverized in a mortar and sieved to achieve a consistent particle size. The samples were then kept in a clean, dry glass container with a stopper.
About 1.0–2.0 g of each oven-dried plant sample was put in a silica crucible, which was mineralized by heating it to 550 °C for 2.0 h and then maintaining it at this temperature for another 2.0 h. After moistening the ash with 1.0–2.0 mL of water, 1.0 mL of concentrated HCl was added. On a hot plate, the mixture was heated to near-dryness. The residue was dissolved in 10 mL of bi-distilled water, filtered and the insoluble part was washed again with 5.0 mL of hot water. The filtrate and washings were placed in a 25 mL measuring flask, which was then filled with bi-distilled water to bring the total volume to 25 mL. The above method was applied assessment of Mo6+.
3 Results and discussion
BTAHN is a photometric reagents for molybdenum (Amin, 1999), niobium (Amin, 2000), cadmium (Amin, 2001), gallium (Amin and Moalla, 2016) and palladium (Hassan and Amin, 2017) ions, and its selectivity can be achieved or enhanced by suitable combination or separation with masking agents. Molybdenum ion react with BTAHN in basic media of pH 7.5 forming 1: 1 and 2:1 (Mo: BTAHN) complex in aqueous media including 30 % (v/v) ethanol as represented in Scheme 1. In the current work Mo6+ react with BTAHN in the sensor membrane and the absorbance maximum wavelengths of the membrane are displayed at 619 nm. This wavelength was chosen for further works owing to great selectivity and sensitivity at this λmax. The spectral characteristics of the immobilized BTAHN and its complex with Mo6+ are ascribed at Fig. 1. In aqueous solutions of pH 7.25 BTAHN demonstrates an absorption band at 477 nm while for its complex with 2.5 × 10⁻⁵ mol/L of Mo6+ fixed an absorption spectra at 619 nm, because of the extraction and complexation of Mo6+ ion into the membrane.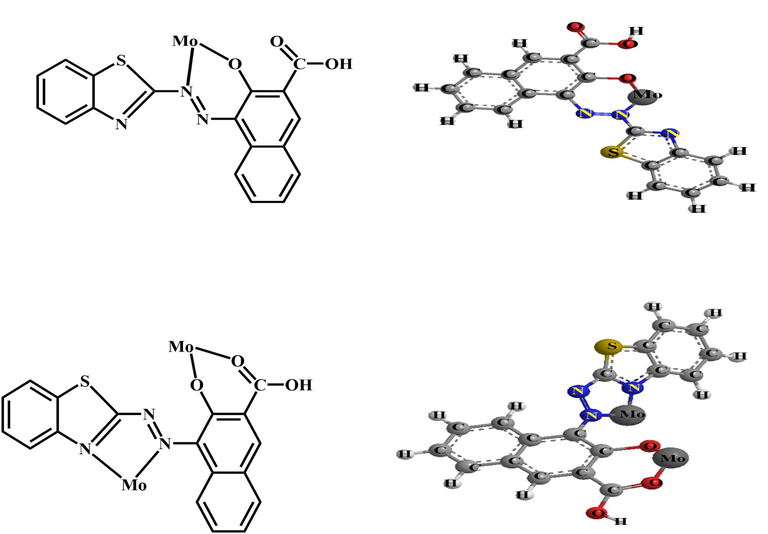
A schematic diagram to illustrate the 1:1 and 2: 1 (Mo: BTAHN) complexes.
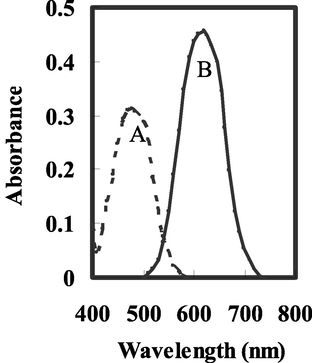
Absorbance spectra of the optical sensors using A- BTAHN in the presence of B- 2.5 × 10⁻⁵ mol/ L of Mo6+ ions at the optimum conditions.
It was essential to elucidate the influence of all factors that can possibly affect on the prepared sensor. In this technique, these factors were type and amount of buffer solution, amount of BTAHN as an ionophore, plasticizers and type and amount of lipophilic additive.
3.1 Effect of reagent
The influence of reagent amount within range of 0.25–3.25 mg at fixed concentration of Mo6+ (2.5 × 10⁻⁵ mol/L) was demonstrated. In the absence of reagent and because of low complexation and low sensitivity is illustrated. By adding BTAHN up to 2.5 mg, the amount of Mo6+ ion migrates to membrane increased expressively and complex amount increased significantly. More reagent addition does not have a significant effect on the sensitivity sensor and response. So, 2.5 mg of BTAHN is described for successive investigations.
3.2 Effect of membrane compositions
It is well recognized that the sensitivity and selectivity accomplished for a specified ionophore established on composition of the membrane and the solvent mediator and additives nature expressively (Oehme et al., 1998). As a result, the influence of the plasticizer kind, ionophore concentration, and NaTPB as a lipophilic additive (anionic site) on the response behaviour of the provided sensor was investigated. As revealed in Fig. 2, an response improvement of the applied sensor and further addition of NaTPB did not effect significantly on its response as a result in increasing of NaTPB amount level up to 4.5 mg. So, 4.5 mg of NaTPB is favorable for consequent works.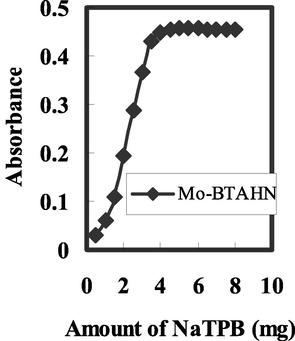
Effect of amount of Na-TPB on theresponse of the sensor of BTAHN with 2.5 × 10⁻⁵ mol/L of Mo6+ at the optimum conditions.
Addition of plasticizer (solvent mediator) compatible with PVC as a common polymer is needed to have a homogenous organic phase. DBP, DES, and DMS were accurate as possible plasticizers with varying polarity in the suggested investigation. Addition of DMS to membrane causes improper physical properties. Membranes that rely on the other two plasticizers have comparable qualities and sensitivity, while the inclusion of DBP improves the preferred sensor's feature and signal characteristics. In 2.5 × 10⁻⁵ mol/L of Mo6+ for BTAHN, absorbance measurements for the sensor membrane with several kinds of plasticizer were accomplished against a reference membrane. Furthermore, addition of 62 mg of DBP is the optimum amount to achieve the satisfactory results.
3.3 Effect of pH
View glance to the ionophore structure presents the existence of hydroxyl group and nitrogen atoms as more reactive atom for binding Mo6+ ions with high pH dependency of their complexation tendency. Thus, the sensor response depends on incorporation of BTAHN ionophore expressively influenced by the buffer pH. In the pH range of 2.5–12, the influence of pH on the sensor response (extent of complexation) in buffer and non-buffer solutions was investigated, and the findings are seen in Fig. 3. The sensor response reached its best value at pH 7.25, as ascribed. This pH was ideal for future research. At lower pH possibly owing to reactive sites protonation and proton competition with Mo6+ ions the sensitivity decreased considerably. At higher pH because of hydrolysis of Mo6+ ion and/or probably because of carriers deprotonation and charged species creation in membrane and their possible bleeding from membrane to aqueous solution, the sensitivity is reduced. On the other hand, at higher pH, ionophores' bleeding to bulk solution increased significantly, possibly owing to the negative charge appearance, resulting in a decrease in optode response and sensitivity.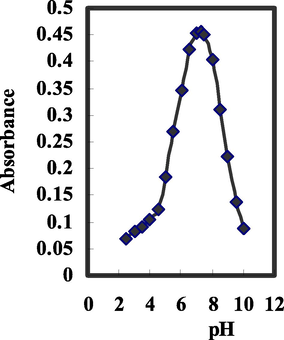
Effect of pH on the response of the proposed optodes of BTAHN with 2.5 × 10⁻⁵ mol/L of Mo6+ at the optimum conditions.
3.4 Response time
The recommended sensor response time significantly indicates the needed time for the analyte diffusion from the bulk of solution into the membrane interface followed by association of ionophore for 2.5 × 10⁻⁵ mol/L of Mo6+ ions. The sensor dynamic response time (distinguished as the time required to reach 95 % of the last equilibrium) that was established to be 3.0–5.0 min for BTAHN based sensor in solution with various levels of Mo6+ ion was checked as a time function. The concentration of the Mo6+ ion, which governs its passage into the membrane, moreover the ionophore loading procedure, influence response time (Absalan et al., 2004) and membranes thickness. The response time of other methods (Pelle et al., 2019; Nakano et al., 2010) is more higher than 15 min, demonstrating that the response time of the proposed sensor method is quick.
3.5 Life time
The sensor membrane lifetime was assessed by the addition of buffer solution of pH 7.25 in cuvette containing membrane. The absorbance was detected at λmax of 619 cross a period of time (about 10 h). During this time, there is no significant loss of carriers. A stable absorbance versus time was achieved by radiation exposure to membrane, which might be attributable to the constant membrane composition (absence of significant carrier bleeding from membrane to the bulk aqueous solution). No drift in absorbance was occurred. However, prepared membrane was preserved under water when not in use to avoid them from drying out.
3.6 Sensor selectivity
The coexisting ions effects in various water samples on the molybdenum recovery were also demonstrated. In these experiments, 2.5 mL solutions were containing 2.5 × 10⁻⁵ mol/L of Mo6+. The tolerated levels of each ion were taken as those, which caused less than a ± 5.0 % alteration in the absorbance. Under the optimum conditions for the proposed sensor especially the effect of plasticizers and type and amount of lipophilic additive; a selectivity coeffcient higher than 12,500 was achieved for NH4+, Na+, K+, Li+, Tl+, Mg2+, Ca2+, F−, Cl−, Br−, I−, ClO4−, NO3−, SO42−, PO43−, and thiourea; and higher than 7500 for Fe2+, Ni2+, Mn2+, Pd2+, La3+, Y3+, Sc3+, Cd2+, Ga3+, Al3+, Cr3+, Cr6+, citrate and tartrate; and higher than 1000 for oxalate, Fe3+, Cu2+, Sm3+, Yb3+, Nb5+, Co2+, La3+, Lu3+, V5+ and Zn2+. The interfering effect of W6+ could be eliminated by adding of sodium–potassium tartrate.
In biological samples, abundant elements include Na, K, Ca, Mg, Fe, O, C, N, and P and major microelements like Cu, Mn, Zn, Ni, Co, Cr and Al, other elements being current in only trace amounts. It was establish that the tolerance limits for these elements were mostly in excess of 1.0 mg, especially K, Na, Ca, Mg, and Fe with tolerance limits > 5.0 mg. This property can be developed to create a favorable procedure for the assessment of trace molybdenum without any separation in plants, foods and seeds. An ultra trace level of molybdenum was assessed in biological samples simply by increasing the sample mass owing to better selectivity of the suggested method.
3.7 Repeatability and regeneration
The sensor response repeatability at λmax 619 nm using a single membrane was measured by performing various replicate measurements for 2.5 × 10⁻⁵ mol/L. For these assessments, the relative standard deviation (RSD) was estimated to be 2.1 %. The regeneration of the membrane response was tested by multiple usages of each sensor for Mo6+ ion detection in test solutions of 2.5 × 10⁻⁵ mol/L Mo6+ solution. After each absorbance reading, the membrane was regenerated by 0.1 mol/L EDTA solution, rinsed with deionized water and soaked in thiel buffer solution of pH 7.25 for a few minutes. Good regeneration was developed for Mo6+ ion of 2.5 × 10⁻⁵ mol/L. The corresponding RSD value was ± 2.22 %. The sensor's short-term stability was evaluated by assessments of absorbance variance in contact with 2.5 × 10⁻⁵ mol/L of Mo6+ ion solution at pH 7.25, after a period of 8.0 h. From the absorbance taken every 15 min (n = 32), after 8.0 h of checking, it was revealed that the reaction is complete, with just a 2.65 % increment in absorbance. The membrane lifetime was assessed across a 50-day period, during which four produced membranes were stored at 4.0 °C in 5.0 % (v/v) ethanol. The mean absorbance variances of the membranes were found to be 0.022 (±0.002) and 0.028 (±0.003), before and after this period, respectively.
3.8 Dynamic range
Under the optimal circumstances, the dynamic range of Mo6+ ions concentration assessed was linear from 8.5 × 10⁻⁸ to 4.4 × 10⁻⁵ mol/L (Table 1). Both of detection and quantification limits were established to be 2.5 × 10⁻⁸ and 8.4 × 10⁻⁵ mol/L. It was seen that the LOD gained is much lower than earlier demonstrated procedures (Comitre and Reis, 2003; Shrivas et al., 2009; Varghese et al., 2006; Lopez-Garcıa et al., 2007; Sung et al., 1997; Filik et al., 2009; Carvalho et al., 2020; Rojas-Romo et al., 2020; Pelit et al., 2013; Soylak et al., 1997; Madrakian and Ghazizadeh, 2008; Ahmed et al., 2014; Santos et al., 2001) [Table 2]. In this case, it founds that the DPB increased the more Mo6+ ions extraction from the aqueous phase and consequently enhanced the sensitivity of sensor. In addition, exhibits higher sensitivity as compared to other reported procedures for Mo6+ ions. Although BTAHN is a photometric reagents for niobium (Amin, 2000), cadmium (Amin, 2001), gallium (Amin and Moalla, 2016) and palladium (Hassan and Amin, 2017) ions, its selectivity can be achieved and increased by using the proposed sensor which is more selective compared to the above previously methods [Table 2].
Parameters
Proposed
sensorParameters
Proposed
sensor
pH
4.75
Quantification limit
0.083
λmax (nm)
619
(µmol/L)
Beer’s range (µmol/L)
0.085 – 44
Regression equation
Ringbom range (µmol/L)
0.10–80.5
Slope (µg/mL)
22.8
Molar absorptivity (L/mol cm)
1.82 × 10⁶
Intercept
– 0.07
Sandell sensitivity (ng/cm2)
0.009
Correlation coefficient (r)
0.9992
Detection limit (µmol/L)
0.025
RSD a (%)
2.15
Sorbent or reagent
Analytical method
LOD
(ng/mL)Ref.
Thiocyanate and methyl trioctyl ammonium chloride
LLE-spectrophotometry
5.0
Shrivas et al., 2009
Potassium thiocyanate
and stannous chlorideLLE-S
4.6
Comitre and Reis, 2003
Amberlite IRA 743
LC-ETAAS
2.0
Varghese et al., 2006
Amberlite XAD-8
spectrophotometry
---
Lopez-Garcıa et al., 2007
Polyuretane foam/thiocyanate
CP-OES
1.5
Sung et al., 1997
Phenylhydrazine
CSPE-Reflectance spectroscopy
20
Filik et al., 2009
8-hydroxyquinoline
Square wave adsorptive stripping voltammetry
80
Lopez- Carvalho et al., 2020
Ex-situ bismuth screen-printed carbon electrode
Adsorptive stripping voltammetry
0.7
Rojas-Romo et al., 2020
Pyrogallol red
IL-spectrophotometry
0.74
Pelit et al., 2013
Bromopyrogallol red
Spectrophotometry
0.10
Lopez- Soylak et al., 1997
Activated carbon/calmagite
ICP-OES
0.75
Madrakian and Ghazizadeh, 2008
benzoylacetone-benzoyl hydrazone
Spectrophotometry
0.30
Ahmed et al., 2014
Muromac A-1
ETAAS
0.25
Santos et al., 2001
BTAHN
Optode
spectrophotometry0.34
This work
3.9 Analytical applications
The validity of the achieved sensor was further proven by analyzing spiked Mo6+ ion (water, soil and urine) samples. For this purpose, molybdenum solutions with the concentration between 5.0 ng/mL and 70 ng/mL were spiked to sample prepared by using 100 mL of water sample. Molybdenum was detected by direct calibration method after homogenizing the samples and using the method. In calculations, analytical factors derived from standard studies assumed in the achieved sensor were used. Table 3 listed the results of spiked molybdenum samples. RSD were less than 2.15 %. Calculated recoveries were found between 98.0 and 102.2 % for waters. Accuracy was measured by comparing results with these achieved using ICP-AES. Applying the paired t-test and F-value (Miller and Miller, 2005) no significant variance at 95 % confidence level was detected.
Sample
Added
ng/mLFounda (ng/mL)
Recovery
(%)t- testb
F-valueb
Proposed
ICP-AES
Mineral waterc
–
n.db
n.db
–
10.0
10.2 ±□ 0.47
9.7 ± 0.8
102.00
1.13
2.37
20,0
19.7 ± 0.24
20.7 ± 0.9
98.50
1.27
2.58
Rain
waterc
–
n.db
n.db
–
5.0
4.9 ± 0.45
5.2 ± 1.0
98.00
1.63
3.26
10.0
10.1 ± 0.22
9.7 ± 0.7
101.00
1.48
2.83
Tap
waterd
–
n.db
n.db
–
15.0
15.2 ± 0.21
14.6 ± 0.9
101.33
1.23
2.59
30.0
30.4 ± 0.43
29.2 ± 1.0
101.33
1.59
3.13
Waste
waterd
–
3.2 ± 0.12
3.0 ± 1.6
–
25.0
28.0 ± 0.18
28.8 ± 1.7
99.29
1.47
2.88
50.0
53.5 ± 0.20
52.0 ± 1.8
100.56
1.67
3.53
Sea
watere
–
n.db
n.db
–
30.0
30.5 ± 0.26
29.0 ± 1.0
101.67
1.36
2.87
60.0
59.3 ± 0.18
61.2 ± 0.8
98.83
1.71
3.69
River
waterf
–
n.db
n.db
–
27.5
27.8 ± 0.13
28.0 ± 1.3
101.09
1.54
3.06
55.0
56.0 ± 0.15
54.1 ± 1.8
101.82
1.43
2.67
Soil
–
14.3
14.5
–
Moshtohor
17.5
31.8 ± 0.17
32.4 ± 1.6
100.32
1.37
2.93
35.0
50.0 ± 0.21
48.8 ± 1.9
101.42
1.62
3.44
Soil
–
26.5 ± 0.09
26.4
–
Shoubra
32.5
59.5 ± 0.12
58.5 ± 1.1
100.85
1.16
2.39
65.0
90.7 ± 0.16
92.0 ± 1.4
99.13
1.32
2.78
Urine (1)
–
n.db
n.db
–
22.5
22.6 ± 0.08
22.3 ± 1.3
100.44
1.52
3.17
45.0
44.7 ± 0.11
45.5 ± 1.7
99.33
1.36
2.89
Urine (2)
–
n.db
n.db
–
35.0
35.4 ± 0.09
34.5 ± 0.3
101.14
1.73
3.77
70.0
71.1 ± 0.13
68.7 ± 0.4
101.57
1.59
3.21
Moreover, the suggested procedure accuracy was certified by applying the method to assess molybdenum in some food and plant leaves samples collected from supermarkets in Benha, Egypt. The recommended method was applied to many categories of samples containing, peas, native banana, rice, tomato, cucumber, apple, soybeans, green tea, pepper black leaves, fenugreek leaves, and mint leaves with diverse matrix cation and anion concentration. The results are listed in Table 4–6. It can be described that the molybdenum content varies from 34.7 to 110.8 ng/g. Also, recovery values accomplished by the standard addition method proved that the advanced procedure is not effected by matrix interferences and can be applied reasonably for natural food and plant leaves analysis. Reliability was tested either by spiking the sample or/and comparing the achieved results with data assessed by ICP-AES. The spiked samples recovery is improved, and there is reasonable agreement between the results and data obtained by ICP-AES analysis, indicating that the recommended technique is reliable for the sample type tested, according to the results.
The present optode
ICP-AES
Samples
Added,ng/mL
Founda, ng/mL
Recovery %
RSD %
Founda, ng/mL
Recovery %
RSD %
t-testb
F-testc
Peas
–
2.90 ± 0.08
–
1.75
2.85 ± 0.09
–
3.25
1.38
5.00
7.95 ± 0.12
100.63
2.10
7.70 ± 0.21
97.47
3.68
–
3.23
10
12.80 ± 0.09
99.22
2.15
13.10 ± 0.34
101.55
3.22
–
Native
banana
–
3.25 ± 0.11
–
1.85
3.20 ± 0.30
–
3.44
3.51
10.00
13.15 ± 0.16
99.25
2.15
13.35 ± 0.24
101.14
2.93
–
20
23.35 ± 0.13
100.43
2.11
23.00 ± 0.35
99.14
3.45
3.44
Rice
–
1.90 ± 0.07
–
1.83
1.85 ± 0.25
–
3.64
–
15.00
16.80 ± 0.14
99.41
1.76
17.10 ± 0.36
101.48
2.84
2.87
30
32.10 ± 0.07
100.63
2.10
31.60 ± 0.32
99.22
3.13
–
Tomato
–
2.75 ± 0.09
–
1.40
2.65 ± 0.25
–
3.68
2.93
25.00
27.60 ± 0.10
99.46
1.75
27.90 ± 0.27
100.90
3.33
–
50
53.00 ± 0.12
100.47
2.15
52.50 ± 0.36
99.72
2.96
3.65
Cucumber
–
2.00 ± 0.07
–
1.67
1.95 ± 0.26
–
3.03
1.36
–
20.00
21.85 ± 0.11
99.32
1.73
22.25 ± 0.33
101.37
1.88
3.22
40
42.40 ± 0.15
100.95
2.05
41.60 ± 0.29
99.17
2.58
–
Apple
–
1.55 ± 0.08
–
1.84
1.65 ± 0.17
–
4.17
3.66
30.00
31.75 ± 0.11
100.63
1.95
31.45 ± 0.21
99.37
2.65
1.86
–
60.00
61.25 ± 0.09
99.51
2.15
62.00 ± 0.27
100.57
2.82
3.78
Soybeans
–
3.50 ± 0.08
–
1.85
3.40 ± 0.26
–
2.78
1.32
–
12.50
15.90 ± 0.14
99.38
2.14
16.20 ± 0.35
101.89
3.11
–
3.56
25.00
29.00 ± 0.06
101.75
1.98
28.20 ± 0.41
99.29
3.62
1.28
–
Green tea
–
3.50 ± 0.16
–
2.13
3.60 ± 0.12
–
3.23
–
2.96
22.50
26.25 ± 0.12
100.96
2.03
25.75 ± 0.21
98.66
3.45
1.56
–
55.00
58.20 ± 0.10
99.49
2.15
59.00 ± 0.28
100.68
3.74
–
3.08
Sample
Added
(µg/g)Founda
(µg/g)Recovery
(%)ICP-AESa
(µg/g)
Rice flour
–
0.45 ± 0.06
–
0.43 ± 0.27
2.00
2.50 ± 0.07
102.04
2.35 ± 0.29
4.00
4.40 ± 0.09
98.88
4.50 ± 0.31
6.00
6.55 ± 0.11
101.55
6.25 ± 0.35
Black tea
–
0.35 ± 0.05
–
0.35 ± 0.21
3.00
3.40 ± 0.07
101.49
3.20 ± 0.38
6.00
6.30 ± 0.10
99.21
6.50 ± 0.42
9.00
9.50 ± 0.13
101.60
9.15 ± 0.37
White bean
–
0.38 ± 0.07
–
0.40 ± 0.29
2.50
2.90 ± 0.09
100.69
2.80 ± 0.34
5.00
5.30 ± 0.13
98.51
5.60 ± 0.31
7.50
8.00 ± 0.11
101.52
7.55 ± 0.36
Spring
wheat–
0.65 ± 0.05
–
0.65 ± 0.38
1.50
2.20 ± 0.08
102.33
2.25 ± 0.43
3.00
3.75 ± 0.14
102.74
3.45 ± 0.30
4.50
5.25 ± 0.12
101.94
5.00 ± 0.29
Pepper
black
leaves–
1.05 ± 0.06
–
1.10 ± 0.15
1.25
2.35 ± 0.09
102.17
1.20 ± 0.21
2.50
3.50 ± 0.13
98.59
3.80 ± 0.27
3.75
4.90 ± 0.15
102.08
4.70 ± 0.34
Fenugreek
leaves–
0.45 ± 0.05
–
0.45 ± 0.52
1.00
1.50 ± 0.08
103.45
1.35 ± 0.40
2.00
2.40 ± 0.11
97.96
2.55 ± 0.44
3.00
3.35 ± 0.14
97.10
3.65 ± 0.38
Mint leaves
–
0.40 ± 0.08
–
0.38 ± 0.41
2.00
2.45 ± 0.12
102.08
2.50 ± 0.37
4.00
4.35 ± 0.09
98.86
4.30 ± 0.24
6.00
6.50 ± 0.09
101.56
6.20 ± 0.32
Sample
volume,
mL[Mo6+], µg/L
Recoveryb
%RSD
% b
t-testc
F-testd
optode a
ICP-AES
Nonalcoholic beverages
Peach juice
30
7.26 ± 0.17
7.40 ± 0.18
97.5–101.5
2.34 (2.43)
1.27
1.12
Orange juice
30
5.45 ± 0.13
5.54 ± 0.14
97.5–102.3
2.48 (2.18)
1.05
1.16
Cherry juice
30
4.37 ± 0.12
4.45 ± 0.14
98.4–102.1
2.75 (3.15)
0.97
1.36
Mango juice
30
5.25 ± 0.48
5.31 ± 0.52
98.3–102.2
3.15 (3.37)
0.51
1.17
Guava juice
30
25.35 ± 0.80
25.41 ± 0.90
98.8–101.5
3.16 (3.54)
0.11
1.27
4 Conclusion
The synthesized molybdenum membrane sensor based on BTAHN complexation shows very great selectivity for Mo6+ over other several metal ions. The membrane indicates minimal detection limit and high sensitivity, which is satisfactory for direct detection of the analyte in food, environmental samples and natural water. The membrane is easily prepared, and the establishment of a covalent bond among BTAHN and the membrane resulted in optodes with a long lifetime and quick response time, as well as no evidence of reagent leaching. The membrane may be easily regenerated by an EDTA solution and have the probability of multiple usages for environmental monitoring of Mo6+ ions. Due to the advantages of the proposed procedure with respect to previously reported ones (Table 2). It may be used as an alternative method for Mo6+ determination in water, food, plant, and environmental samples.
Author’s contributions
Salah El-Bahy and Abeer Hassan supplied analyzed, collected, designed interpreted data and wrote the paper. The paper has been read and approved by all authors. Alaa S. Amin conceived and designed the work; and wrote the paper.
Acknowledgements
The authors gratefully acknowledge financial support from Taif University Researchers Supporting Project number (TURSP-2020/135), Taif University, Taif, Saudi Arabia.
Declaration of Competing Interest
The authors declare that they have no known competing financial interests or personal relationships that could have appeared to influence the work reported in this paper.
References
- Constructing a new optical sensor for monitoring ammonia in water samples using bis(acetylacetoneethylendiamine)tributylphosphin cobalt(III) tetraphenyl-borate complex-coated triacetylcellulose. Anal. Sci.. 2004;20:1433-1436.
- [CrossRef] [Google Scholar]
- Design of a cyanide ion optode based on immobilization of a new Co(III) Schiff base complex on triacetylcellulose membrane using room temperature ionic liquids as modifiers. Sens. & Actuators (B). 2010;147:31-36.
- [CrossRef] [Google Scholar]
- A simple spectrophotometric method for the determination of trace levels of molybdenum in industrial, environmental, biological and soil samples using benzoylacetone-benzoylhydrazone. Anal. Methods. 2014;6:2282-2293.
- [Google Scholar]
- Determination of molybdenum in human urine by spectrophotometric method using thiazolylazo compounds as chromogenic reagents Anal. Lett.. 1999;32:1575-1587.
- [CrossRef] [Google Scholar]
- The surfactant-sensitized analytical reaction of niobium with some thiazolylazo compounds. Microchem. J.. 2000;65:261-267.
- [CrossRef] [Google Scholar]
- Spectrophotometric determination of cadmium using thiazolylazo chromogenic reagents in the presence of triton x–100: application in environmental samples. Anal. Lett.. 2001;34:163-176.
- [CrossRef] [Google Scholar]
- Optical chemical sensor of lutetium(III) in water based on 2-nitro-6-(thiazol-2-yldiazenyl)phenol immobilized on polymethyl methacrylate and 2-nitrophenyl octyl ether matrix. Eurasian J. Anal. Chem.. 2018;13:1-12.
- [Google Scholar]
- Utility of solid phase extraction for UV-visible spectrophotometric determination of gallium in environmental and biological samples. RSC Adv.. 2016;6:1938-1944.
- [CrossRef] [Google Scholar]
- Impregnation of a pH-sensitive dye into sol-gels for fiber optic chemical sensors. Analyst. 1995;120:1025-1028.
- [CrossRef] [Google Scholar]
- A selective optical sensor for beryllium determination based on incorporating of 1,8-dihydroxyanthrone in a poly (vinyl chloride) membrane. J. Hazard. Mater.. 2011;190:962-968.
- [CrossRef] [Google Scholar]
- Chemometric optimization of the methodology for determination of molybdenum in soils and plants by square wave adsorptive stripping voltammetry. J. Braz. Chem. Soc.. 2020;31:716-723.
- [Google Scholar]
- A review on molybdenum determination in solid geological samples. Talanta. 2007;71:987-1000.
- [CrossRef] [Google Scholar]
- Application of adsorptive cathodic differential pulse stripping method for simultaneous determination of copper and molybdenum using pyrogallol red. Anal. Chim. Acta. 2004;505:201-207.
- [CrossRef] [Google Scholar]
- The determination of molybdenum in water and biological samples by graphite furnace atomic spectrometry after polyurethane foam column separation and preconcentration. Talanta. 2003;61:789-795.
- [CrossRef] [Google Scholar]
- Rapid sensing of molybdenum by combined colorimetric solid-phase extraction—Reflectance spectroscopy. Sens. & Actuators (B). 2009;141:491-497.
- [CrossRef] [Google Scholar]
- Selective cloud point extraction and graphite furnace atomic absorption spectrometric determination of molybdenum (VI) ion in seawater samples. J. Hazard. Mater.. 2009;169:766-771.
- [CrossRef] [Google Scholar]
- Novel erbium (III)-selective fluorimetric bulk optode. Sens. & Actuators (B). 2009;142:90-96.
- [CrossRef] [Google Scholar]
- Solid phase extraction and spectrophotometric determination of palladium with 1-(2-benzothiazolylazo)-2-hydroxy-3-naphthoic acid. Anal. Chem. Lett.. 2017;7:724-736.
- [CrossRef] [Google Scholar]
- Membrane optode for mercury(II) determination in aqueous samples. J. Hazard. Mater.. 2009;166:377-382.
- [CrossRef] [Google Scholar]
- Speciation analysis of elements in cereal flours by liquid chromatography– inductively coupled plasma mass spectrometry. Food Chem.. 2006;99:158-167.
- [CrossRef] [Google Scholar]
- Liquid chromatography–electrothermal atomic absorption spectrometry for the separation and preconcentration of molybdenum in milk and infant formulas. Anal. Chim. Acta. 2007;597:187-194.
- [CrossRef] [Google Scholar]
- Cloud-point preconcentration and spectrophotometric determination of trace amounts of molybdenum(VI) in steels and water samples. J. Hazard. Mater.. 2008;153:695-700.
- [CrossRef] [Google Scholar]
- Investigation of a Cu(II) fibre optic chemical sensor using fast sulphon black F (FSBF) immobilised onto XAD-7. Sen. & Actuators (B). 2002;81:196-201.
- [CrossRef] [Google Scholar]
- Statistics and Chemometrics for Analytical Chemistry (5th Ed.). London: Prentice-Hall; 2005.
- Flow-injection catalytic spectrophotometic determination of molybdenum(VI) in plants using bromate oxidative coupling of p-hydrazinobensene sulfonic acid with N-(1-naphthyl) ethylenediamine. Talanta. 2010;81:786-791.
- [CrossRef] [Google Scholar]
- The effect of polymeric supports and methods of immobilization on the performance of an optical copper(II)-sensitive membrane based on the colourimetric reagent Zincon. Talanta. 1998;47:595-604.
- [CrossRef] [Google Scholar]
- A spectrophotometric method for determination of molybdenum in water samples by using pyrogallol red and a water soluble ionic liquid. Anal. Methods. 2013;5:5792-5798.
- [CrossRef] [Google Scholar]
- High-performance carbon lack/molybdenum disulfide nanohybrid sensor for cocoa catechins determination using an extraction-free approach. Sen. & Actuators (B). 2019;296:126651
- [CrossRef] [Google Scholar]
- An optical chemical sensor for thorium(IV) determination based on thorin. J. Hazard. Mater.. 2010;173:110-114.
- [CrossRef] [Google Scholar]
- Determination of molybdenum(VI) via adsorptive stripping voltammetry using anex–situ bismuth screen–printed carbon electrode. Microchem. J.. 2020;154:104589
- [CrossRef] [Google Scholar]
- Triiodide PVC membrane electrode based on a charge-transfer complex of iodine with 2,4,6,8-tetraphenyl-2,4,6,8-tetraazabicyclo[3.3.0]octane. Anal. Chem.. 1999;71:1350-1353.
- [CrossRef] [Google Scholar]
- Enrichment and determination of molybdenum in geological samples and seawater by ICP-AES using calmagite and activated carbon. Anal. Chim. Acta. 2001;426:79-84.
- [CrossRef] [Google Scholar]
- Copper(II)-selective fluorimetric bulk optode membrane based on a 1-hydroxy-9,10-anthraquinone derivative having two propenyl arms as a neutral fluorogenic ionophore. Spectrochim. Acta (A). 2006;63:43-48.
- [CrossRef] [Google Scholar]
- Trace level determination of molybdenum in environmental and biological samples using surfactant-mediated liquid–liquid extraction. J. Hazard. Mater.. 2009;161:325-329.
- [CrossRef] [Google Scholar]
- Determination of molybdenum in water and geological samples from Sorgun-Yozgat region after separation and preconcentration: comparative results. Kuwait J. Sci. Eng.. 1997;24:87-92.
- [Google Scholar]
- Molybdenum bolsters the bioinorganic brigade. Science. 1996;272:1599-1600.
- [CrossRef] [Google Scholar]
- Use of muromac A-1 chelating resin for determination of copper and molybdenum in seawater by atomic absorption with on-line preconcentration. Spectrochim. Acta (B). 1997;52:755-764.
- [CrossRef] [Google Scholar]
- Simultaneous determination of titanium and molybdenum in steel samples using derivative spectrophotometry in neutral micellar medium. Spectrochim. Acta (A). 2006;64:383-390.
- [CrossRef] [Google Scholar]
Further reading
- Spectrophotometric determination of molybdenum(VI) with bromopyrogallol red in the presence of Triton X-114. J. Anal. Chem.. 2006;61:638-640.
- [CrossRef] [Google Scholar]
- An improved flow-injection system for spectrophotometric determination of molybdenum and tungsten in tool steels. Talanta. 2006;69:927-931.
- [CrossRef] [Google Scholar]


