

Translate this page into:
Computational modeling of 4-Phenoxynicotinamide and 4-Phenoxypyrimidine-5-carboxamide derivatives as potent anti-diabetic agent against TGR5 receptor
⁎Corresponding author. shola4343@gmail.com (Shola Elijah Adeniji)
-
Received: ,
Accepted: ,
This article was originally published by Elsevier and was migrated to Scientific Scholar after the change of Publisher.
Peer review under responsibility of King Saud University.
Abstract
Computational study was carried out to develop a Quantitative structure-activity relationship (QSAR) model and molecular docking studies on 4-Phenoxynicotinamide and 4-Phenoxypyrimidine-5-carboxamide derivatives as potent anti-diabetic agent. Chemical structure of these molecules were optimized with Density Functional Theory (DFT) utilizing the B3LYP with 6-31G∗ basis set. Five QSAR models were generated using Multi-Linear Regression and Genetic Function Approximation (GFA). Model one was selected as the optimum model and reported based on validation parameters which were found to be statistically significant with squared correlation coefficient (R2) of 0.9460, adjusted squared correlation coefficient (R2 adj) value of 0.9352 and cross validation coefficient ( ) value of 0.9252. The chosen model was subjected to external validations and the model was found to have (R2test) of 0.8642. Molecular docking studies revealed that the binding affinities of the compounds correlate with their pEC50 and the best compound has binding affinity of −10.4 kcal/mol which formed hydrogen bond and hydrophobic interaction and with amino acid residues of TGR5 receptor. QSAR model generated and molecular docking results propose the direction for the design of new anti-diabetic agent with better activity against TGR5 target site.
Keywords
Anti-diabetic
Applicability domain
Binding affinity
Molecular docking
QSAR

1 Introduction
Non-insulin-dependent diabetes mellitus (NIDDM) which is usually refers to as type 2 diabetes mellitus (T2DM), is a metabolic disorder characterized by high glucose level in the blood. Wide range of anti-diabetic drugs and treatments are available for this metabolic syndrome problem. Many patients suffering from this type of diabetes are unable to get satisfactory glycemic control with these treatment (Saydah et al., 2004). This led to development and designing of novel drugs with better activities against multi-drug resistance and uncontrolled T2DM (See Fig. 1).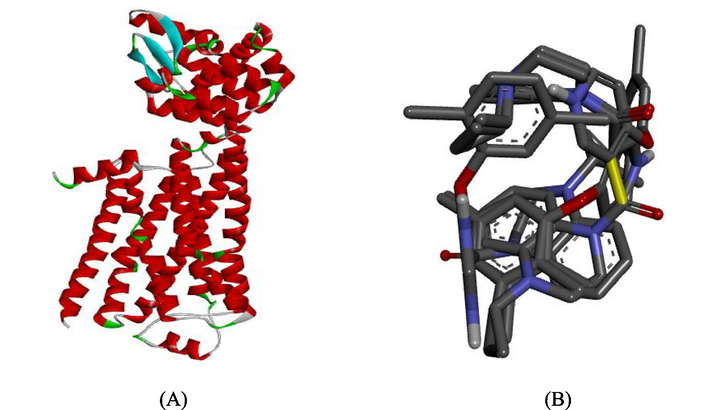
(A) Prepared structure of TGR5 receptor (B) 3D structure of the prepared ligand.
TGR5 is a class of G protein-coupled receptor (GPCR) for bile acids (BAs) which was first identified in 2003. Before its identification, farnesoid X receptor (FXR) was the only known receptor activated by BAs. The TGR5 level among different tissues varies significantly. The highest level of TGR5 is in the gallbladder, moderate level in the intestine, spleen and placenta and low level expression in skeletal muscle and liver (Vassileva et al., 2006). TGR5 activation stimulates Glucagon-like peptide-1 (GLP-1) secretion from intestinal enteroendocrine cells by increasing the intracellular cAMP concentration (Watanabe et al., 2006).
A novel analogue of 4-Phenoxynicotinamide and 4-Phenoxypyrimidine-5-carboxamide derivatives has been reported as potent anti-diabetic agent against TGR5 receptor (Duan et al., 2012). Synthesis of novel molecules are typically developed using a trial and error approach, which is time consuming and costly.
The advent of computational chemistry led to challenges of drug discovery (Cramer et al., 1988). QSAR establish a relationship between various molecular properties of molecules and their experimentally known activities (Ibezim et al., 2009). QSAR technique alongside with molecular docking approach were employed to predict the activities of various compounds and elucidate the specific areas where interaction (steric, electrostatic, hydrogen bond donor, hydrogen bond acceptor and hydrophobic) may decrease or increase the activity of the inhibitor molecules. Few researchers; (Amit et al., 2016; Bajpai and Malik, 2003; Dasoondi et al., 2008; Dieguez-Santana et al., 2017; Dixit and Saxena, 2008) have carried QSAR studies to established relationship between some inhibitory compounds and their activities against diabetic mellitus. However molecular docking study has not been emphasis to understand the binding mode and binding interactions between the inhibitory compounds and the target site.
The aim of this research was to build a QSAR model that will predict the activity of 4-Phenoxynicotinamide and 4-Phenoxypyrimidine-5-carboxamide derivatives against type 2 diabetes mellitus (T2DM) and to carry out molecular docking studies to elucidate the kind of interaction existing between the inhibitor compounds and the target site (TGR5).
2 Materials and methods
2.1 Data collection
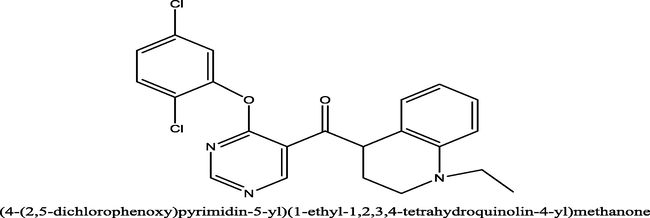
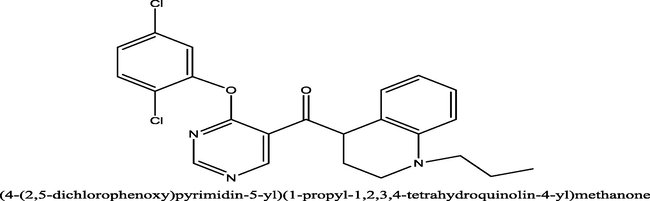
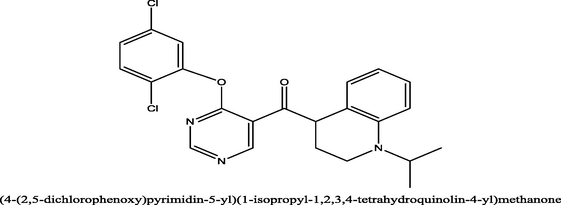
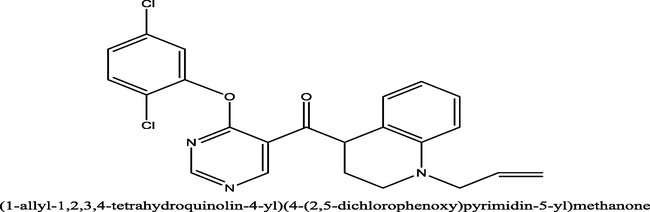
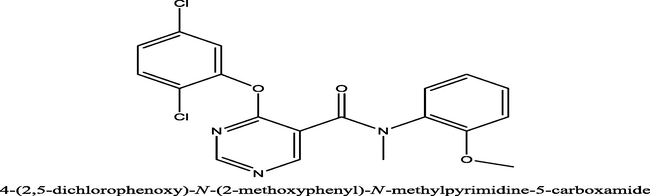
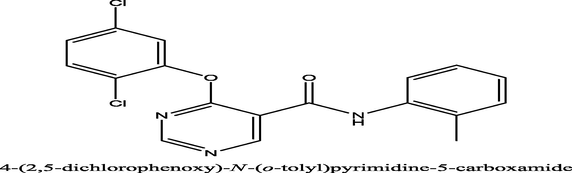
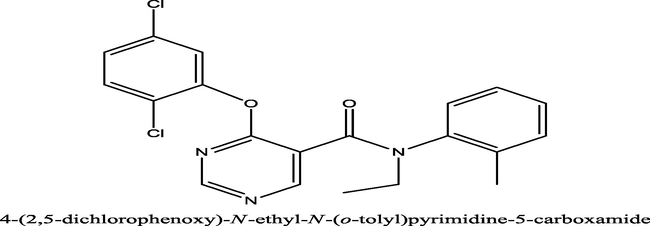
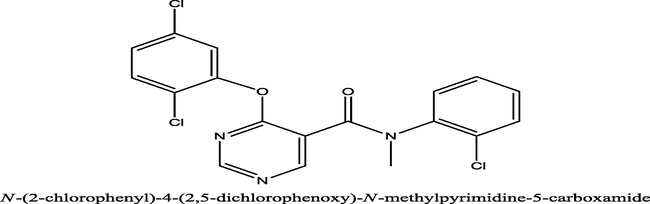
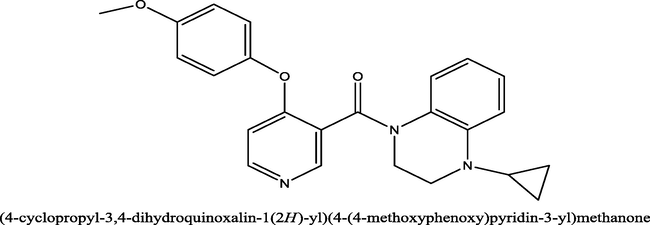
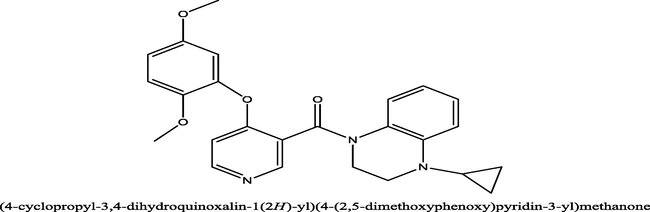
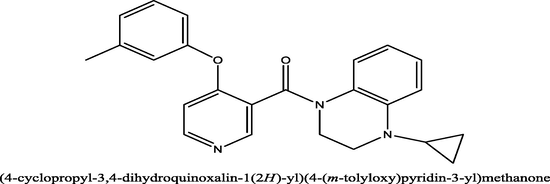
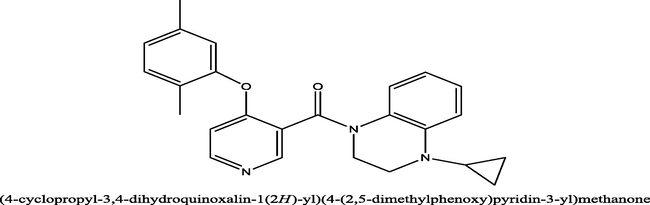
Thirty-six (36) molecules of 4-Phenoxynicotinamide and 4-Phenoxypyrimidine-5-carboxamide derivatives as potent and orally efficacious TGR5 agonists that were used in this studies were gotten from the literature (Duan et al., 2012).
2.2 Biological activities (pEC50)
The biological activities of 4-phenoxypyridine-5-carboxamide and 4-phenoxynicotinamide derivatives against TGR5 of type 2 diabetes mellitus measured in EC50 (
were converted to logarithm unit (pEC50 = −logEC50) in order to increase the linearity activities values and approach normal distribution. The observed structures with their biological activities of the molecules were presented in Table 1. Where superscript a represent the test set
4‑Phenoxypyrimidine-5-carboxamide derivatives
S/N
Molecules
EC50 (nM)
pEC50
Predicted Activity
Residual
1a
156
6.8068
6.797241
0.009559
2
20
7.6989
7.901818
−0.20292
3
30
7.5228
7.202141
0.320659
4
710
6.1487
6.138077
0.010623
5
30
7.5228
7.821121
−0.29832
6a
2.9
8.5376
8.254908
0.282692
7a
590
6.2291
6.710226
−0.48113
8a
23
7.6382
7.688441
−0.05024
9a
164
6.7851
6.489332
0.295768
10
49
7.3098
7.493192
−0.18339
11
127
6.8961
7.005227
−0.10913
12
3.1
8.5086
7.710525
0.798075
13
7.1
8.1487
8.167491
−0.01879
14
69
7.1612
7.784653
−0.62345
15
6.2
8.2076
8.142226
0.065374
16
1.5
8.8239
8.714862
0.109038
17

2.8
8.5528
8.644922
−0.09212
18
3711
5.4305
5.379953
0.050547
19a
535
6.2716
6.536593
−0.26499
20a
3151
5.5015
5.079
0.4225
21a
160
6.7958
6.400758
0.395042
22
10,000
5.000
5.056796
−0.0568
23
4886
5.3110
5.351652
−0.04065
24a
451
6.3458
5.388271
0.957529
4‑Phenoxynicotinamide derivatives
25
1.5
8.8239
8.612203
0.211697
26
47
7.3279
7.296042
0.031858
27a
27
7.5686
7.974061
−0.40546
28
7.9
8.1023
7.974061
0.128239
29
12
7.9208
7.725444
0.195356
30
12
7.9208
8.154828
−0.23403
31a
12
7.9208
7.840378
0.080422
32
0.72
9.1427
8.392342
0.750358
33
0.46
9.3372
9.139482
0.197718
34
0.60
9.2218
8.951027
0.270773
35
0.31
9.5086
9.210468
0.298132
36
0.72
9.1426
9.674048
−0.53145
2.3 Optimization
The optimizations of the compounds were achieved by employing Density Functional Theory (B3LYP B3LYP/6-31G∗ basis set) utilizing Spartan 14 Version 1.1.4 software. (Becke, 1993; Lee et al., 1988).
2.4 Molecular descriptor calculation
The optimized structures were submitted for descriptor calculation. Molecular descriptors for all the thirty-six (36) molecules of the inhibitor compounds were calculated utilizing the PaDEL-Descriptor software V2.20. A total of 1875 molecular descriptors were calculated.
2.5 Normalization and data pretreatment
The descriptors’ value for all the molecules were normalized using Eq. (1) in order to give each variable the same opportunity at the onset to influence the model (Singh, 2013).
Where Xi is the value of each descriptor for a given molecule, Xmax and Xmin are the maximum and minimum value for each column of descriptors X.
2.6 Data division
The data set was split into training set and test set by employing Kennard and Stone’s algorithm (Kennard and Stone, 1969). The training set comprises 70% of the data set which were used to build the model while the remaining 30% of the data set (test set) were used to validate the built model.
2.7 Internal validation of model
Material studio software version 8 was used to determine the internal validation parameters by employing the Genetic Function Approximation (GFA) method. The validation of the built model was evaluated by employing the Friedman formula (LOF) which measured the fitness score of the model. LOF is defined as; (Friedman, 1991) .
The Standard Error of Estimation (SEE) is equivalent to the models standard deviation. It’s a measure of model quality and a model is said to be a better model if it has low SEE value. SEE is defined by equation below;
c is the number of terms in the model, N is the number of compound that made up the training set, p is the number of descriptors, d is a user-defined smoothing parameter, (Khaled, 2011).
The correlation coefficient (R2) defines the fraction of the entire variation in the model. The closer the value of R2 to 1.0, the stronger the model generated. R2 is expressed as:
Where: , and Ypred are the mean experimental activity, experimental activity and the predicted activity in the training set, respectively.
R2 value varies directly with the increase in number of descriptors, thus, R2 is not reliable to measure the stability of the model. Therefore, R2 is adjusted in order to have a reliable and stable model. The R2adj is defined as:
Where p and n are number of descriptors in the model and number compounds that made up the training set.
The strength of the QSAR model to predict the activity of a new compound was determined using cross validation test. The cross-validation coefficient (
) is defined as:
, and Ypred are the mean experimental activity, experimental activity and the predicted activity in the training set, respectively.
2.8 External validation of the model
External validation of the developed model was assessed by the value
value. The
is defined by as;
Where and are the predicted and experimental activity test set. While is the training set mean values of the experimental activity.
2.9 Y-Randomization test
To be assured that the built QSAR model is strong, reliable and not obtained by chance, the Y-randomization test was carried out on the compound that made up the training set (Tropsha et al., 2003). For the built QSAR model to robust and reliable, the model is expected to have a low R2 and Q2 values for several trials. Coefficient of determination (c
) for Y-randomization is another parameter calculated which should be greater than 0.5 for passing this test.
c is Coefficient of determination for Y-randomization, R is coefficient of determination for Y-randomization and Rr is average ‘R’ of random models.
2.10 Evaluation of the applicability domain of the model
The leverage approach was employed in defining and describing the applicability domain of the built QSAR models (Veerasamy et al., 2011). Leverage of a given chemical compound hi, is defined as follows:
Where Xi is training compounds matrix of i. X is the
descriptor matrix of the training set compound.
is the transpose matrix of X and
is the transpose matrix Xi used to build the mode. The warning leverage (h∗) is the boundary of values for X outliers and is defined as:
Where m is the number of descriptors and d is the number of compounds that made up the training set.
2.11 Quality assurance of the model
The fitness, reliability, stability, and predictability of the built models were evaluated by the validation parameters. The minimum recommended value for internal and external validation parameters for a generally acceptable QSAR model (Veerasamy et al., 2011) is presented in Table 2.
Parameter
Definition
Recommended value
R2
Coefficient of determination
≥0.6
P(95%)
Confidence interval at 95% confidence level
<0.05
Cross validation coefficient
>0.5
R2 -
Difference between R2 and
≤0.3
Next. test set
Minimum number of external test set
≥5
c
Coefficient of determination for Y-randomization
>0.5
2.12 Docking studies
Molecular docking study was carried between 4-Phenoxynicotinamide and 4-Phenoxypyrimidine-5-carboxamide derivatives and TGR5 receptor target site. The crystal structure of TGR5 receptor used in the study was obtained from protein data bank. The optimized structures of the 4-Phenoxynicotinamide and 4-Phenoxypyrimidine-5-carboxamide derivatives initially saved as SDF files were converted to PDB files using Spartan 14 Version 1.1.4. The prepared ligands were docked with prepared structure of TGR5 receptor using Autodock Vina incorporated in Pyrx software. The docked results were visualized and analyzed using Discovery Studio Visualizer.
3 Results and discussion
QSAR investigation was carried out to relate the structure activity relationship of 4-Phenoxynicotinamide and 4-Phenoxypyrimidine-5-carboxamide derivatives as potent inhibitor of TGR5.
Experimental and predicted activities of the inhibitors and their derivatives were reported in Table 1. The low residual value between experimental and predicted activity indicates that the model has a high predictive power.
Five descriptors were used to build a linear model for predicting the activities of the inhibitor compounds based on Multi-Linear Regression and Genetic Function Algorithm (GFA) method employed. Model one was selected as the best model due to statistical significance and prominent validation parameters.
Model 1
pEC50 = 0.125973308 ∗ ATS1p - 0.010504968 ∗ ATSC1m + 0.097632128 ∗ X RDF80u - 0.064185438 ∗ RDF55i - 4.004440770
Model 2
pEC50 = 0.108430945 ∗ ATS1p - 0.759472864 ∗ AATSC1m - 0.327839361 ∗ nHother + 0.311565867 ∗ RDF80p - 1.845286768
Model 3
pEC50 = 0.127238717 ∗ RDF80p - 0.010483164 ∗ ATSC1m - 0.064741508 ∗ RDF55i + 0.077010983 ∗ RDF80i - 4.144260897
Model 4
pEC50 = 0.127289414 ∗ ATS1p - 0.010694802 ∗ ATSC1m - 0.079815940 ∗ RDF55u + 0.103816691 ∗ RDF80u - 4.188809957
Model 5
pEC50 = 0.105099406 ∗ ATS1p + 28.698005977 ∗ AATSC0p - 0.068763191 ∗ RDF55i + 0.080255278 ∗ RDF80i - 9.976240161
All the validation parameter to confirm the stability and robustness of the model were reported in Table 3 which were all in agreement with validation parameters presented in Table 2. While the calculated descriptors used in predicting the activity of each compound where reported in Tables 4 and 5.
S/N
Validation parameters
Model 1
Model 2
Model 3
Model 4
Model 5
Threshold value
1
Friedman LOF
0.432202
0.433894
0.435663
0.443398
0.445466
0.5
2
R-squared
0.946014
0.945803
0.945582
0.944616
0.944357
≥0.6
3
Adjusted R-squared
0.935217
0.934963
0.934698
0.933539
0.933229
>0.6
4
Cross validated R-squared
0.928759
0.919402
0.927651
0.926561
0.923921
>0.5
5
Significant Regression
Yes
Yes
Yes
Yes
Yes
6
Replicate points
0
0
0
0
0
7
Computed experimental error
0
0
0
0
0
8
Lack-of-fit points
20
20
20
20
20
9
Min expt. error for non-significant LOF (95%)
0.249492
0.24998
0.250489
0.252702
0.253291
10
R2 test
0.8642
0.7211
0.5322
0.5422
0.4542
≥0.6
Molecule
ATS1p
ATSC1m
RDF80u
RDF55i
Predicted Activity
10
95.03083
44.03765
15.58872
23.88487
7.493192
11
89.90462
41.47018
16.38505
23.05786
7.005227
12
101.0936
65.57105
15.7974
29.19099
7.710525
13
106.1096
73.3786
17.13241
32.66898
8.167491
14
106.1096
73.3786
10.73848
28.90777
7.784653
15
103.8825
63.66103
19.21257
33.44618
8.142226
17
111.6874
82.05282
14.40201
30.60505
8.644922
18
91.54652
64.2069
9.827982
37.90672
5.379953
2
97.12432
70.75769
22.64375
27.98552
7.901818
22
90.49977
50.7956
9.667698
42.83823
5.056796
23
81.03962
13.29221
10.41906
26.95842
5.351652
25
106.4529
69.43373
0
1
8.612203
26
101.3988
134.1153
0
1
7.296042
28
103.9259
99.87649
0
1
7.974061
29
106.3046
152.0681
0
1
7.725444
3
102.1403
79.86035
14.64496
35.07428
7.202141
30
111.2104
170.0227
0
1
8.154828
32
111.4308
150.0564
0
1
8.392342
33
111.4689
79.39107
0
1
9.139482
34
116.4468
157.0242
0
1
8.951027
35
108.98
42.78697
0
1
9.210468
36
116.4849
88.65475
0
1
9.674048
4
102.1403
79.86035
11.62847
47.06389
6.138077
5
99.91322
68.77706
18.62154
28.9224
7.821121
6
102.7021
76.71254
17.42115
24.51301
8.254908
Molecule
ATS1p
ATSC1m
RDF80u
RDF55i
Predicted Activity
1
95.06158
48.16925
12.16469
28.90358
−0.95502
16
106.6714
72.81042
18.2977
27.10917
2.824743
19
100.4838
43.34609
6.340206
35.53609
1.158496
20
80.4678
35.2542
10.68857
26.89952
0.425606
21
95.37356
49.46837
11.31287
34.18471
1.742684
24
82.99485
18.20398
7.579923
25.10282
−0.56217
27
103.9259
99.87649
0
1
8.056255
31
106.4148
142.449
0
1
12.69045
7
88.15629
88.29171
25.9644
31.1306
2.904864
8
95.71811
87.22781
23.39105
26.99112
3.012702
9
85.9427
56.99298
13.6134
16.56309
0.917058
Pearson’s correlation of the four descriptors employed in the QSAR Model was reported in Table 6. The correlation coefficient between each descriptor in the model is very low thus, it can be inferred that there is no significant inter-correlation among the descriptors used in building the model.
ATS1p
ATSC1m
RDF80u
RDF55i
ATS1p
1
ATSC1m
0.341475
1
RDF80u
−0.4939
−0.56435
1
RDF55i
−0.56598
−0.57235
0.023338
1
Y- Randomization parameter test were reported in Table 7. The low R2 and Q2 values for numbers of trials confirm that the built QSAR model is stable, robust and reliable. While the
value greater than 0.5 assured that the built model is powerful and not inferred by chance.
Model
R
R^2
Q^2
Original
0.73026857
0.5332922
0.320676
Random 1
0.20860711
0.0435169
−0.412234
Random 2
0.74943813
0.5616575
0.3881064
Random 3
0.30303256
0.0918287
−0.326775
Random 4
0.33073537
0.1093859
−0.275737
Random 5
0.39593156
0.1567618
−0.191466
Random 6
0.19624781
0.0385132
−0.40262
Random 7
0.13642358
0.0186114
−0.567249
Random 8
0.35290385
0.1245411
−0.257905
Random 9
0.46995088
0.2208538
−0.062309
Random 10
0.16738226
0.0280168
−0.477468
Random Models Parameters
Average r:
0.33106531
Average r^2
0.13936872
Average Q^2
−0.25856557
cRp^2
0.47534142
The description and other statistical parameters that influence the selected descriptors were reported in Table 8. The presence of 2D and 3D descriptors in the model suggests that these types of descriptors are able to characterize better anti-diabetic activities of the compounds. The calculated Variance Inflation Factor (VIF) values for all the four descriptors in the model were all less than 4 which imply that the descriptors were orthogonal and model generated was significant. The null hypothesis says there is no significant relationship between the activities of the inhibitor molecules and the descriptors used in building the model at p > 0.05. The P-values of the descriptors in the model at 95% confidence limit shown in Table 8 are all less than 0.05. This implies that the null hypothesis is rejected. Thus we accepted the alternative hypothesis. Hence we infer that there is a significant relationship between the activities of the inhibitor molecules and descriptors used in building the model at p < 0.05.
S/N
Descriptors symbol
Name of descriptor(s)
Class
Statistics
ME
VIF
P- Value
1
ATS1p
Broto-Moreau autocorrelation - lag 1/weighted by polarizabilities
2D
−0.37338
2.4531
0.00162
2
ATSC1m
Centered Broto Moreau autocorrelation - lag 1/weighted by mass
2D
0.23434
1.3322
4.4 x 10⁻¹⁰
3
RDF80u
Radial distribution function - 080/unweighted
3D
0.43242
2.4543
7.3 x 10⁻⁸
4
RDF55i
Radial distribution function - 055/weighted by relative first ionization potential
3D
0.55430
2.3221
5.6 x 10⁻⁵
3.1 Interpretation of selected descriptors
The 2D descriptor, ATS1p which correspond to Average centered Broto-Moreau autocorrelation - lag 1/weighted by polarizabilities, have negative mean effect (MF) which means they have negative impact on the activity. ATSC1m correspond to Centered Broto Moreau autocorrelation - lag 1/weighted by mass. It has negative mean effect which indicates that an increase in the weight of molecule leads to a decrease in its anti-diabetic activity. RDF80u and RDF55i are one of the 3D-radial distribution function (RDF) descriptors which were proposed based on a radial distribution function. The radial distribution function is probability distribution to find an atom in a spherical volume of radius. RDF descriptors are independent of the size and rotation of the entire molecule. They describe the steric hindrance or the structure/activity properties of a molecule. The RDF descriptor provides valuable information about the bond distances, ring types, planar, non-planar systems and atom types. Having positive mean effect (MF) implies that they have positive impact on the activity.
Plot of predicted activity against experimental activity of training and test set where shown in Figs. 2 and 3 respectively. The R2 value of 0.9460 for training set and R2 value of 0.8642 for test set reported in this study was in agreement with Genetic Function Approximation (GFA) derived R2 value reported in Table 2. This confirms the robustness and reliability of the model. Plot of standardized residual versus experimental activity shown in Fig. 4 indicates that there was no systematic error in the model built as the spread of standardized residual values were on both sides of zero (Jalali-Heravi and Kyani, 2004).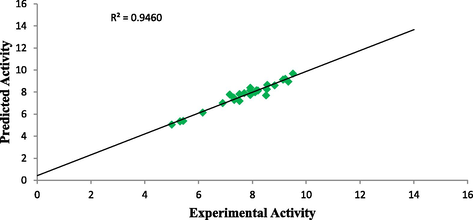
Plot of predicted activity against experimental activity of training set.
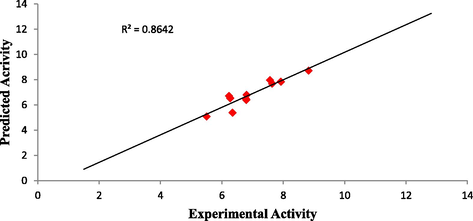
Plot of predicted activity against experimental activity of test set.
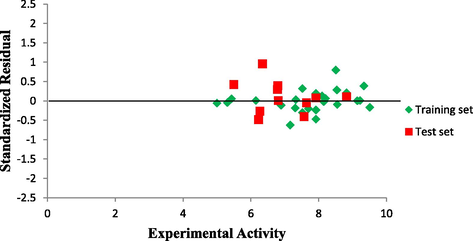
Plot of Standardized residual activity versus experimental activity.
The leverage values for the entire compounds in the dataset were plotted against their standardized residual values leading to discovery of outliers and influential compound in the models. The Williams plot of the standardized residuals versus the leverage value is shown in Fig. 5 which an evident that all the compounds were within the square area
3 of standardized cross-validated residual produced by the model. Therefore no compound is said to be an outlier. However, only one compound is said to be an influencing compound since its leverage value is greater than the warning leverage (h∗ = 0.60). This was attributed to difference in its molecular structure compared to other compounds in the dataset.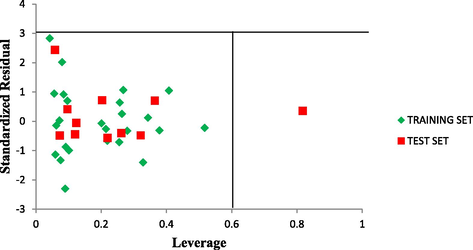
The Williams plot of the standardized residuals versus the leverage value.
3.2 Molecular docking
Molecular docking studies were carried out in order to analysis and understand the interaction formed between the targets (TDG5) and inhibitor ligands that have the least and best pEC50. The docking results reported in Tables 9 and 10 shows that the binding affinities of the ligands with best pEC50 were greater than the binding affinity of the ligands with least pEC50 which indicates that the binding affinities of these ligands correlate with their pEC50. Ligand 27 with least binding affinity (−8.5 kcal/mol) and ligand 35 with best binding affinity (-10.4 kcal/mol) were visualized and analyzed in Discovery Studio Visualizer as shown in Figs. 6 and 7 below. Ligand 27 formed one hydrogen bond (2.15425A°) with ASN69 of the target. Hydrophobic interaction is a bond formed between the ligand and the binding pocket of the target site (receptor). It adhere the ligand to the surface of target site. Ligand 27 formed hydrophobic bond with ALA271, ALA271, ALA271, UNK1, PRO330, LEU275, LYS267, ALA271of the target site. Ligand 35 also formed two hydrogen bonds (2.43479, 2.15121A°) with ARG131 of the target. While hydrophobic interactions were observed with ALA271, LEU275, PHE332, LEU275, VAL67of the target site. Where superscript a and b represent 4‑Phenoxypyrimidine-5-carboxamide and 4‑Phenoxynicotinamide derivative Where superscript a and b represent 4‑Phenoxypyrimidine-5-carboxamide and 4‑Phenoxynicotinamide derivatives
Ligand
Binding Affinity (kcal/mol)
Target
Hydrogen bond
Hydrophobic
Amino acid
Bond length (Ao)
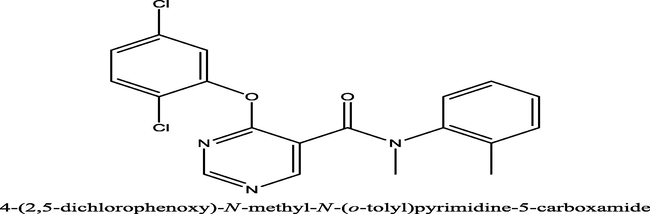
22a
4-(2,5-dichlorophenoxy)-N-(o-tolyl)pyrimidine-5-carboxamide−6.5
TGR5
–
–
ALA271, ALA271, ALA271, UNK1, PRO330, LEU275, LYS267, ALA271
23a
4-(2,5-dichlorophenoxy)-N-ethyl-N-(o-tolyl)pyrimidine-5-carboxamide−7.2
TGR5
–
–
PHE194, ALA200, HIS178, PHE194PHE194, LYS305, VAL297, LYS305
27b
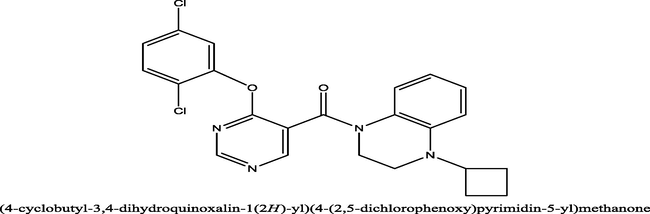
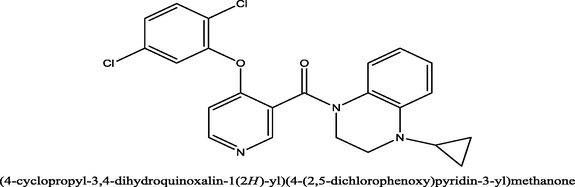
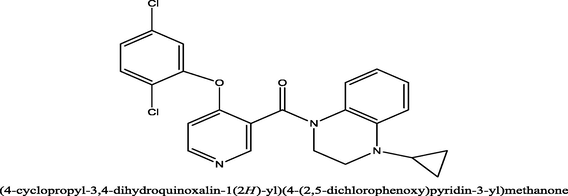
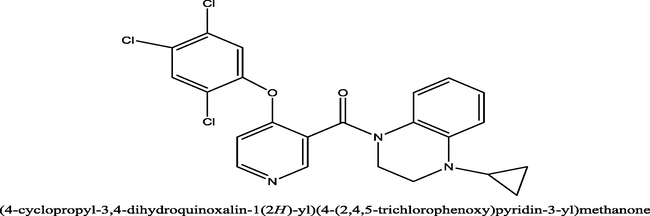
(4-cyclopropyl-3,4-dihydroquinoxalin-1(2H)-yl)(4-(2,5-dichlorophenoxy)pyridin-3-yl)methanone−8.5
TGR5
ASN69
2.15425
ALA271, ALA271, ALA271, UNK1, PRO330, LEU275, LYS267, ALA271
28b
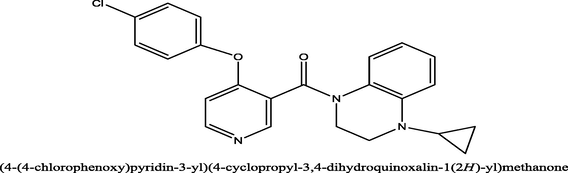
(4-(4-chlorophenoxy)pyridin-3-yl)(4-cyclopropyl-3,4-dihydroquinoxalin-1(2H)-yl)methanone−8.1
TGR5
–
–
PHE194, ALA200, LYS305, HIS178, PHE194
Ligand
Binding Affinity kcal/mol
Target
Hydrogen bond
Hydrophobic
Amino acid
Bond length (Ao)
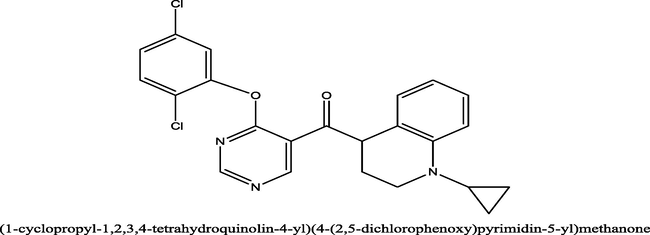
16a
(1-cyclopropyl-1,2,3,4-tetrahydroquinolin-4-yl)(4-(2,5-dichlorophenoxy)pyrimidin-5-yl)methanone−9.2
TGR5
TRP10 SER104
1.06624
2.31227LYS267, LYS267, ALA271, ALA271, PHE332
17a
(1-cyclopropyl-1,2,3,4-tetrahydroquinolin-4-yl)(4-(2,5-dichlorophenoxy)pyrimidin-5-yl)methanone−8.8
TGR5
TRP10 SER104
2.81227
PHE194, ALA200, LYS305, HIS178, PHE194, VAL297
33b
(4-cyclopropyl-3,4-dihydroquinoxalin-1(2H)-yl)(4-(2,4,5-trichlorophenoxy)pyridin-3-yl)methanone−9.7
TGR5
TYR141
2.7432
1.86624LYS267, LYS267, ALA271, ALA271
PHE332
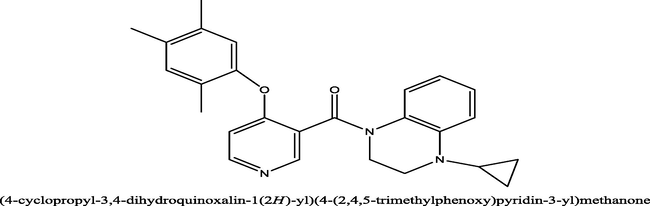
35b
(4-cyclopropyl-3,4-dihydroquinoxalin-1(2H)-yl)(4-(2,4,5-trimethylphenoxy)pyridin-3-yl)methanone−10.4
TGR5
ARG131 ARG131
2.43479
2.15121ALA271, LEU275, PHE332, LEU275
VAL67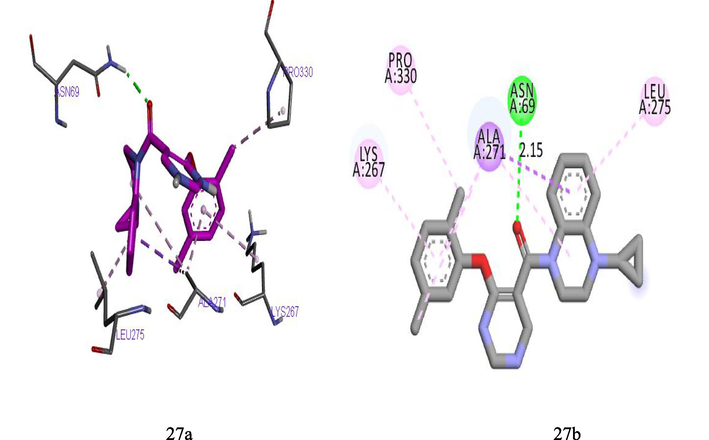
(27a) and (27b) show the 3D and 2D interactions between TGR5 and Ligand 27.
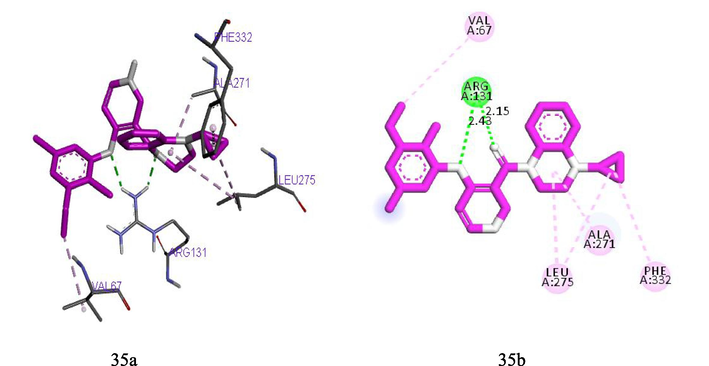
(35a) and (35b) show the 3D and 2D interactions between TGR5 and Ligand 35.
Hydrogen bond between the ligand 27 and target site is shown in Fig. 8. The C=O of the ligand also act as hydrogen acceptor and formed only one hydrogen bond with ASN69 of the target. Fig. 9 shows the hydrogen bond interaction between the ligand 35 and the target site. A total of two hydrogen bonds were formed. The ether functional group (–O–) of the ligand acts as hydrogen acceptor and formed one hydrogen bond with ARG131 of the target. The C=O of the ligand also act as hydrogen acceptor and formed one hydrogen bond with ARG131 of the target. The hydrogen bond formation alongside with the hydrophobic interaction provides an evidence that ligand 35 of the inhibitor compounds is potent against TGR5 receptor.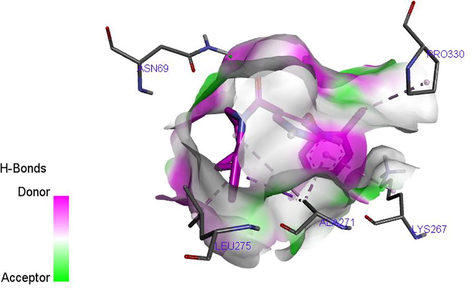
H-bond between the ligand 27 and TGR5 receptor.
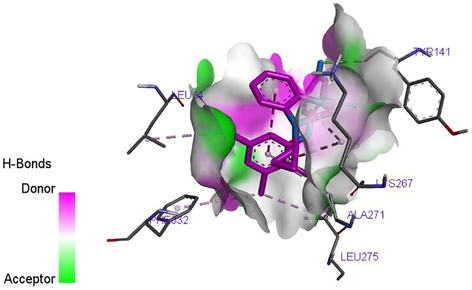
H-bond between the ligand 35 and TGR5 receptor.
4 Conclusion
In this research, QSAR model was generated with descriptor (ATS1p, ATSC1m, RDF80u, RDF55i) which were highly correlated with biological activities of 4-Phenoxynicotinamide and 4-Phenoxypyrimidine-5-carboxamide derivatives. These descriptors produced a robust model to predict the anti-diabetic activities of these compounds. The internal and external validation tests for the QSAR model generated were in agreement with recommended value of validation parameters for a generally acceptable QSAR model. The Molecular docking studies showed that the binding affinities of the inhibitors correlate with their pEC50 and the best compound has binding affinity of −10.4 kcal/mol which formed H-bond and hydrophobic interactions with amino acid of the target. The QSAR technique alongside with molecular ducking study provides a valuable approach for medicinal and pharmaceutical researchers to design and synthesis new anti-diabetes agent against TGR5 receptor of type 2 diabetes mellitus (T2DM).
References
- Synthesis, cytotoxic evaluation, Docking and QSAR study of N-(4-oxo-2-(4-((5-aryl-1, 3, 4-thiadiazol-2-yl) amino) phenyl) thiazolidin-3-yl) benzamides as antitubulin agents. Curr. Top. Med. Chem.. 2016;16:2509-2520.
- [Google Scholar]
- Becke’s three parameter hybrid method using the LYP correlation functional. J. Chem. Phys.. 1993;98:5648-5652.
- [Google Scholar]
- Comparative molecular field analysis (CoMFA). 1. Effect of shape on binding of steroids to carrier proteins. J. Am. Chem. Soc.. 1988;110:5959-5967.
- [Google Scholar]
- Comparative molecular field analysis of benzothiazepine derivatives: Mitochondrial sodium calcium exchange inhibitors as antidiabetic agents. Indian J. Pharm. Sci.. 2008;70:186.
- [Google Scholar]
- A Two QSAR Way for Antidiabetic Agents Targeting Using α-Amylase and α-Glucosidase Inhibitors: Model Parameters Settings in Artificial Intelligence Techniques. Lett. Drug Des. Discov.. 2017;14:862-868.
- [Google Scholar]
- QSAR analysis of PPAR-γ agonists as anti-diabetic agents. Eur. J. Med. Chem.. 2008;43:73-80.
- [Google Scholar]
- Design, synthesis, and antidiabetic activity of 4-phenoxynicotinamide and 4-phenoxypyrimidine-5-carboxamide derivatives as potent and orally efficacious TGR5 agonists. J. Med. Chem.. 2012;55:10475-10489.
- [Google Scholar]
- Computer-aided linear modeling employing QSAR for drug discovery. Sci. Res. Essays. 2009;4:1559-1564.
- [Google Scholar]
- Use of computer-assisted methods for the modeling of the retention time of a variety of volatile organic compounds: a PCA-MLR-ANN approach. J. Chem. Inf. Comput. Sci.. 2004;44:1328-1335.
- [Google Scholar]
- Modeling corrosion inhibition of iron in acid medium by genetic function approximation method: a QSAR model. Corros. Sci.. 2011;53:3457-3465.
- [Google Scholar]
- Development of the Colle-Salvetti correlation-energy formula into a functional of the electron density. Phys. Rev. B. 1988;37:785.
- [Google Scholar]
- Poor control of risk factors for vascular disease among adults with previously diagnosed diabetes. Jama. 2004;291:335-342.
- [Google Scholar]
- Quantitative Structure-Activity Relationship Study of Substituted-[1, 2, 4] Oxadiazoles as S1P1 Agonists. J. Curr. Chem. Pharm. Sci.. 2013;3:64-79.
- [Google Scholar]
- The importance of being earnest: validation is the absolute essential for successful application and interpretation of QSPR models. Mol. Inform.. 2003;22:69-77.
- [Google Scholar]
- Targeted deletion of Gpbar1 protects mice from cholesterol gallstone formation. Biochem. J.. 2006;398:423-430.
- [Google Scholar]
- Validation of QSAR models-strategies and importance. Int. J. Drug Des. Discov.. 2011;3:511-519.
- [Google Scholar]
- Bile acids induce energy expenditure by promoting intracellular thyroid hormone activation. Nature. 2006;439:484-489.
- [Google Scholar]


