

Translate this page into:
Comparative study on photocatalytic activity: Ni ferrite/Mg ferrite vs. Z-scheme Ni ferrite/silver/Mg ferrite heterojunction under solar radiation
-
Received: ,
Accepted: ,
This article was originally published by Elsevier and was migrated to Scientific Scholar after the change of Publisher.
Abstract
This study investigates the photodegradation efficiency of core/shell structures comprising NiFe2O4/MgFe2O4 (NiF/MgF) and Z-scheme NiFe2O4/Ag/MgFe2O4 (NiF/Ag/MgF) heterojunctions for Methylene Blue dye degradation. In this study, solar radiation was used as a source of excitation. X-ray diffraction analysis reveals an increase in particle size and micro-strain for NiF/MgF and NiF/Ag/MgF, confirming the formation of core/shell structures. The NiF/Ag/MgF sample exhibits the highest magnetization, attributed to the RKKY magnetic interaction between NiF and MgF moments via the conduction electron of the Ag metal layer. Optical measurements indicate increased absorption coefficient and absorption bandwidth for core–shell structures. Photocatalytic activity measurements demonstrate that while bare MgFe2O4 MgF shows limited photodegradation efficiency, NiF/MgF and NiF/Ag/MgF heterojunctions significantly enhance photodegradation. The presence of the Ag metal layer in the NiF/Ag/MgF heterojunction reduces electron-hole pair recombination and enhances their separation, leading to exceptional photodegradation efficiency. These results highlight the significance of Z-scheme heterojunction configurations in augmenting photodegradation processes under solar radiation, offering notable economic advantages. Additionally, the high magnetization observed in the studied samples presents an opportunity for efficient waste material retrieval using a simple magnetic extraction method.
Keywords
Ferrites
Core/shell
Z-scheme
Photodegradation
Photocatalysis

1 Introduction
Rapid industrial development and population growth have led to environmental degradation, particularly in water contamination, contributing to a global scarcity of energy resources (Pandey and Dhuria, 2023). Developing alternative, eco-friendly, and sustainable technologies for remedying organic pollutants and generating energy resources is essential.
Solar energy, recognized as an untapped and eco-friendly source, holds promise for water treatment and the production of green energy (Lellis et al., 2019). In this pursuit, semiconductors, as photocatalysts, have attracted considerable attention over the past few decades as a pivotal technology for tackling environmental challenges and promoting energy generation (Aziz et al., 2023). Consequently, the scientific and engineering communities are actively studying new types of heterogeneous photocatalysts for environmental applications.
Since Fujishima discovered that TiO2 could be used as a photocatalytic semiconductor to generate H2 gas by water decomposition (Fujishima and Honda, 1972), researchers have increasingly favored semiconductor catalysts. This preference arises from their distinctive properties, including easy reactions at room temperature and the direct utilization of sunlight as the catalyst's activating light source (Chen et al., 2010). Most semiconductor photocatalysts primarily comprise metal oxides and sulfides, e.g., titanium dioxide (TiO2) (Zhang and Banfield, 2000), zinc oxide (ZnO) (Penga et al., 2017), tungsten trioxide (WO3) (Liu et al., 2019), tantalum pentoxide (Ta2O5) (Goudarzi et al., 2016), cadmium sulfide (CdS) (Wang et al., 2019), and zinc sulfide (ZnS) (Lee and Wu, 2010). Recently, carbon nitride (CN) has shown a promising potential for both the production of clean energy and also water purification from organic pollutants under solar radiation (Wang et al., 2024; Zhou et al., 2024a, 2024b). These materials have been extensively investigated for their photocatalytic activities.
However, the efficiency of photocatalytic activity using semiconductor catalysts is constrained by their low quantum yield, wide optical energy gap, which limits the use of visible light, and high electron-hole recombination rate. These limitations significantly hinder its widespread application in the industry. Numerous modification studies have been conducted to enhance photocatalytic performance (Wang et al., 2021; Wudil et al., 2023). Improving the efficiency of semiconductor oxide catalysts requires improving two factors: Firstly, improving the separation of light-generated electron-hole pairs and reducing the recombination rate. Secondly, enhancing absorption in the red region of the sunlight spectrum will broaden the spectral response and enhance the utilization of incident solar energy. Gathering the two requirements simultaneously in a single semiconductor photocatalyst is challenging. Consequently, heterojunction complexes, composed of two semiconductor photocatalysts, have become the focus of extensive studies. These complexes depend on the generation of an intrinsic electric field at the interface between the two semiconductors to extract the photogenerated electron-hole pair away from each other and decrease the recombination rate. Also, selecting one of these semiconductors with a narrow band gap increases the light absorption in the red region.
For example, Tahir (2021) successfully synthesized CuBi2O4/Bi2WO6 heterostructured nanocomposites through a simple hydrothermal technique. The efficiency of these nanocomposites was then evaluated for photocatalytic activity under visible light (Tahir, 2021). Bastami et al. (2017) employed a facile two-step procedure to construct Fe3O4/Bi2WO6 binary nanohybrids (Bastami et al., 2017). These nanohybrids were investigated for their catalytic efficiency in the photodegradation of some drug molecules under sunlight. Zhu et al. (2018) also developed WO3/Bi2WO nanocomposites using electrospinning and calcination techniques. When exposed to visible light, these nanocomposites displayed notable photocatalytic and photoelectrochemical (PEC) water-splitting capabilities (Zhu et al., 2018).
Ferrite materials are among the most crucial categories of heterostructured binaries due to their diverse optical energy gap (Zulqarnain et al., 2022), encompassing both p-type and n-type semiconductors, and their high chemical stability and cost-effectiveness. Notably, their elevated magnetization confers the advantage of facile extraction of waste materials from water after purification through a straightforward magnetic process. Additionally, the similar crystal structure and lattice matching inherent in different ferrites offer the opportunity to fabricate superlattice structures with heterojunctions. This capability eliminates lattice dislocations and defects at the interface, ultimately reducing the recombination of electron-hole pairs and enhancing the quality of the interface.
Numerous studies have employed both single and core/shell ferrite structures for water purification, targeting various industrial dyes. For instance, Mg-doped Co-ferrite demonstrated effectiveness in treating Rhodamine B dye (Sundararajan et al., 2017), Zn-doped Co-ferrite was utilized for the removal of Methylene Blue (Amar et al., 2020), Ni-Ferrite was applied for the degradation of Methylene Orange II (Lassoued et al., 2018), and CuS/BiFeO3 was explored for Alachlor removal (Bhoi and Mishra, 2018). Furthermore, ZnO/ZnFe2O4 was found to be effective in eliminating MB (Chen et al., 2017), and MgFe2O4 demonstrated its potential for the treatment of CR (Kaur et al., 2015).
A recent trend in research pointed to an effective type of heterojunction, the Z-type structure. In this type of junction, a metal layer is introduced between the n-type and p-type materials to enhance the electron-hole pair splitting at the junction (Li et al., 2022).
The critical parameters investigated in these studies include the concentration of the utilized materials, the type of light source employed, and the duration required for achieving at least an 80 % purification rate (Al-Nuaim et al., 2023). These factors significantly influence the efficiency of the water purification process. Regrettably, a drawback associated with many heterojunctions is their reliance on artificial light sources, such as Xenon lamps, to achieve effective photoactivity. This limitation restricts their applicability for environmental purposes, where sunlight could otherwise be harnessed as a more sustainable and widely available light source.
Z-scheme heterojunctions have been introduced to enhance photoactivity across the solar spectrum to overcome the limitation of relying on artificial light sources. The Z-scheme configuration incorporates a metallic mediator between the p-type and n-type components of the heterojunction. This electron mediator significantly reduces the recombination rate between electron-hole pairs, substantially enhancing the photochemical activity (Vara Prasad et al., 2018).
Ni-ferrite and Mg-ferrite have close similarities in the lattice parameter (Hernández-Gómez et al., 2013; El-Sayed, 2016). Additionally, it is worth noting that Ni-ferrite is classified as a p-type semiconductor, while Mg-ferrite is categorized as an n-type semiconductor. Moreover, both ferrites typically exhibit energy gap ranges within the visible light spectrum, falling between 1.5 and 2.5 eV. This range may vary based on factors such as the preparation method and the material particle size. This characteristic makes them particularly advantageous for utilizing solar energy as an excitation source.
In this study, a comparative investigation is presented between two distinct heterojunction structures: the Ni-Ferrite/Mg-Ferrite heterojunction (NF/MF) configured as a core–shell and a Z-scheme Ni-Ferrite/Ag/Mg-Ferrite heterojunction (NF/Ag/MF).
2 Experimental details
2.1 Synthesis of MgFe2O4 (MgF) and NiFe2O4 (NF) nanoparticles
Stoichiometric amounts (2:1) of ferric nitrate-Penta hydrate Fe(NO3)3·9H2O and magnesium nitrate-hex hydrate Mg(NO3)2·6H2O, respectively, and citric acid C6H8O7·H2O (98 % from Merk India) were chosen as precursors for the synthesis of MgFe2O4. The following steps were taken using the citrate precursor method:
The nitrates were individually dissolved in distilled water, and the solutions were mixed.
Citric acid was mixed with a nitrate solution at a molar ratio of 1:3.
The entire solution was stirred for 30 min on a magnetic stirrer until a homogeneous solution was formed.
Ammonia solution was added very slowly to the solution until the pH reached 7.
The solution was subsequently heated on a hot plate until it formed a gel. This gel then decomposed through self-ignition, forming a brown powder with a fluffy texture.
The final powder was kept on the hot plate for 2 h to dry, resulting in a brown powder.
The same method is used to prepare NiFe2O4 nanoparticles, but Ni-nitrate is used instead of Mg-nitrate.
2.2 Synthesis of NiFe2O4/MgFe2O4 (NiF/MgF) and NiFe2O4/Ag/MgFe2O4 (NiF/Ag/MgF) core shell
The outlined procedures are employed to synthesize NiFe2O4 as the shell in conjunction with the pre-existing MgFe2O4 powders serving as the seed. The resulting composite, denoted as NiF/MgF, maintains a mass ratio of 2:1 for NiFe2O4 to MgFe2O4.
The preparation of the NiFe2O4/Ag/MgFe2O4 (NiF/Ag/MgF) Z-scheme involves two sequential steps:
Coating MgF core with Ag metal (Ag/MgF): During this stage, Ag nanoparticles are generated in the presence of MgF powders. The surface of MgF nanoparticles undergoes treatment with a sodium citrate solution, followed by 1 h of sonication and subsequent drying at 95 °C overnight. Ag nitrate solution, serving as the source of Ag, is reduced at 90 °C with a suitable amount of sodium acetate. This reduction occurs in the presence of surface-modified MgF nanoparticles, acting as a seed for Ag nanometals. The resulting powders are thoroughly washed with distilled water and then dried at 90 °C. The mass ratio of Ag to MgFe2O4 is maintained at 3:1.
Coating Ag/MgF with NiFe2O4 (NiF/Ag/MgF): In the final step, the powder obtained from the previous stage is coated with NiFe2O4, following the same synthesis method employed for NiFe2O4/MgFe2O4, with the mass ratio remaining at 2:1.
A schematic diagram for the sol–gel method is shown in Fig. 1.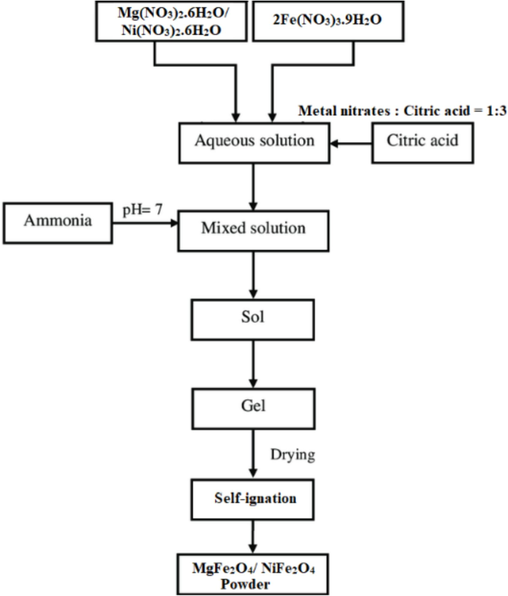
Schematic diagram for sol–gel preparation method.
2.3 Characterization techniques
In the characterization process, the materials underwent analysis through the Philips X'Pert diffractometer equipped with a CuKα line (λ = 1.5406 Å). The lattice constant was determined using Bragg's law. The Williamson-Hall equation was used to compute the crystallite size and micro-strain. The sample morphology was also observed using a high-resolution transmission electron microscope (HTEM, Model JEM-2100). The magnetic properties of the prepared samples were investigated at room temperature using a Lake Shore 7410 vibrating sample magnetometer (VSM) with a maximum magnetic field (H) of 20 kG.
The samples were examined using a UV–Vis spectrophotometer model JASCO 670 within a 200–800 nm wavelength range to determine the band gap energy value. To study the photocatalysis performance of the investigated samples, methylene blue (MB) was used as a water pollutant under solar radiation. The spectrum of MB was examined for each 5 min of solar radiation using a USB4000 ocean optic spectrometer.
For measuring Mott-Schottky plots, a TEGAM LRC Meter Model 3550 was used. The working electrode of the investigated sample (either MgF or NiF) was prepared by coating a TCO glass plate with a colloidal solution. This solution was made by dispersing 10 mg of the material gradually in 1 mL of ethanol and 0.1 mL of 3 wt% Nafion. A uniform layer of the sample was obtained after the solution evaporated. A Pyrex electrochemical cell, equipped with an AgCl/Ag reference electrode and a graphite counter electrode, was utilized with an aqueous solution of 0.1 M Na2SO4 serving as the electrolyte solution.
3 Results and discussion
3.1 X-ray diffraction
Fig. 2 illustrates the X-ray diffraction pattern (XRD) for the examined samples. MgF and NiF samples display a single spinel cubic phase, characterized by a wide half-width indicating small particle sizes. The NiF/MgF sample also exhibits a single-phase cubic structure but with a narrower half-width, suggesting a larger crystallite size compared to the two bare samples. The increased crystallite size in the NiF/MgF sample supports the formation of a core/shell structure, where MgF serves as a seed for the crystal growth of NiF.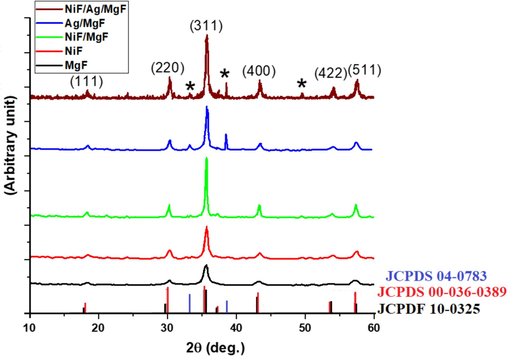
XRD charts for all investigated samples.
In Fig. 2, the XRD pattern for the NiF/Ag/MgF sample reveals additional peaks (star-marked peaks) alongside the ferrite peaks attributed to the crystals of silver nanoparticles. For a more detailed understanding of the crystal structure, Table 1 presents the lattice parameter, grain size, and micro-strain calculated from Bragg's law and the W-H relation. The lattice parameters of bare NiF and MgF samples are closely matched, with a lattice mismatch of less than 1 %. As observed before, the crystallite size of NiF/MgF is larger than that of bare ferrites, indicating the formation of NiF as a shell on MgF as a core. Additionally, the increase in micro-strain for the NiF/MgF sample, compared to the bare samples, arises from the small lattice mismatch between the two ferrites. Notably, the NiF/Ag/MgF sample exhibits the highest micro-strain value due to the presence of the Ag layer, which has a completely different crystal structure compared to NiF and MgF.
Sample
Lattice parameter (\AA)
Grain size (nm)
Microstrain (10−4)
MgF
8.394
10
1.7
NiF
8.365
12
2
NiF/MgF
8.376
15
7
NiF/Ag/MgF
8.363
19
13
3.2 TEM images
Fig. 3 presents high-resolution images of the examined samples. The histograms show that the particle size for bare MgF and NiF falls within the range of 12 nm. In contrast, the sizes of the NiF/MgF and NiF/Ag/MgF samples measure 22 nm and 30 nm, respectively. To measure the thickness of the Ag shell on the MgF core, an HRTEM image for the Ag/MgF sample is shown in Fig. 3. The contrast between the core and the shell is well defied. By measuring the size of the shell, the Ag layer was around 3.5 nm on average (ranging from 2.5 nm and 4.5 nm). Unfortunately, the HRTEM image for NiF/Ag/MgF shows intersections between the crystallographic planes for Ni ferrite, Mg ferrite, and Ag. The thickness of the NiF is estimated from the difference in size between Ag/MgF (19 nm) and NiF/Ag/MgF (30 nm) samples. The increase in particle size for the latter two samples is likely attributed to the formation of a shell on the MgF core. Based on these findings, one can estimate the thickness of the NiF layer to be approximately 5 nm. To confirm the formation core shell structure for NiF/Ag/MgF, EDX analysis has been carried out at the center of the particle to prove the coexistence of all elements at the same point. Fig. 3 shows also the EDX chart and the percentage of each element in the examined particle. The shine shape of the particles could be attributed to the high reflection of the electron beam due to the presence of Ag metal. The presence of all expected elements (Ni, Mg, Fe, O, and Ag) at the investigated spot validates the formation of the NiF/Ag/Mg structure.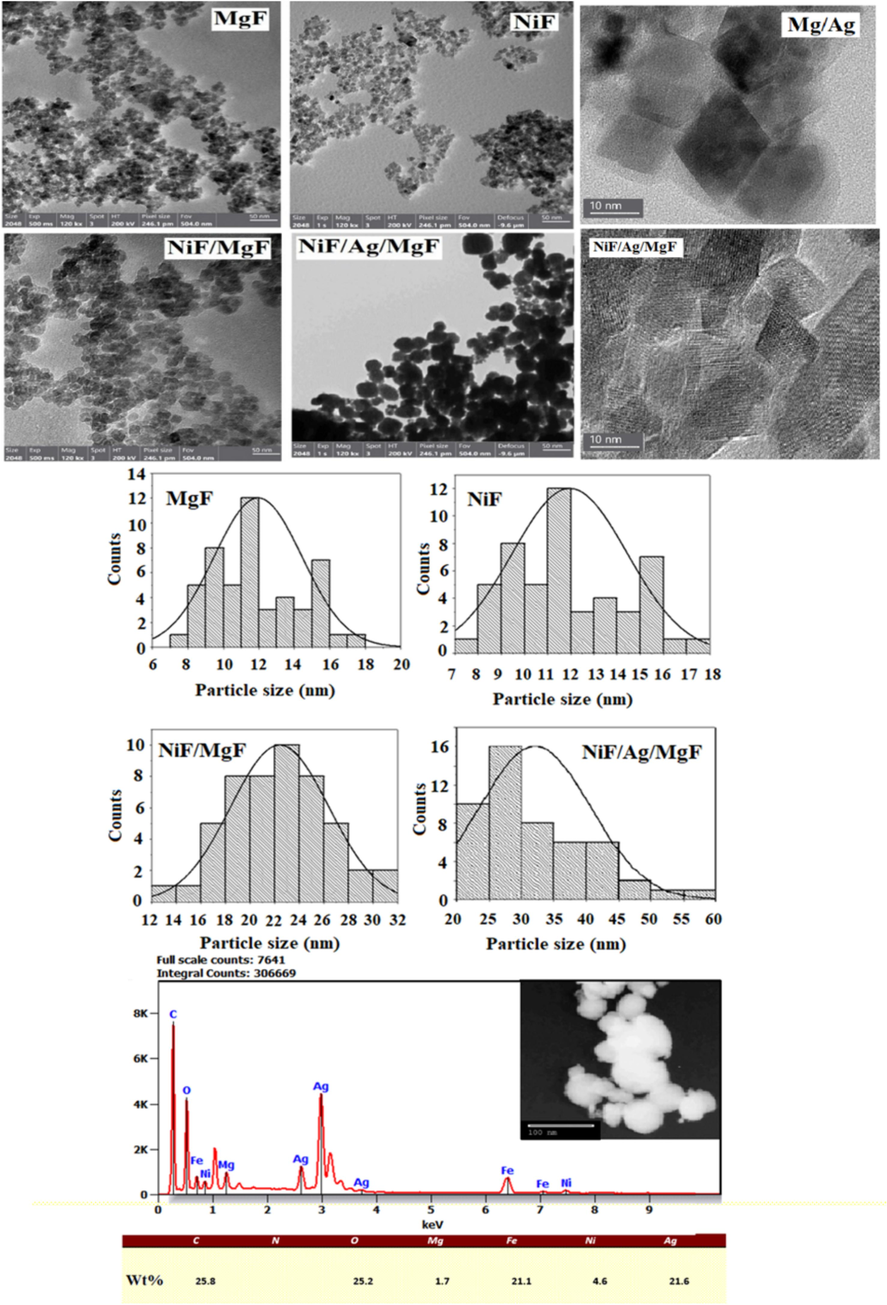
TEM images, histogram (for all investigated samples) and EDX chrat for NiF/Ag/MgF.
3.3 Magnetic properties
To investigate the magnetic properties of MgFe2O4 as the core and the influence of NiFe2O4 and Ag as the shell on these properties, the samples underwent field-dependent magnetization measurements using a vibrating sample magnetometer (VSM) at room temperature under a magnetic field strength of up to 20 kG. Fig. 4 displays the hysteresis curves for all examined samples. The MgF sample displays a hysteresis loop that is qualitatively different and characterized by a failure to reach saturation. This behavior can be interpreted as the initiation of superparamagnetic tendencies. The most suitable model for explaining this phenomenon involves a core–shell morphology, where the core is ferrimagnetic and the shell features a surface layer with non-ordered super-exchange interaction between magnetic moments, leading to significant surface spin disorder, called the magnetic dead layer. Consequently, any increment in the applied field primarily affects the surface layer of the particles. As this layer exhibits a limited response to the applied magnetic field, the overall enhancement in particle magnetization slows down, resulting in a pronounced irreversibility in high-field magnetization (Souri and Tahan, 2015).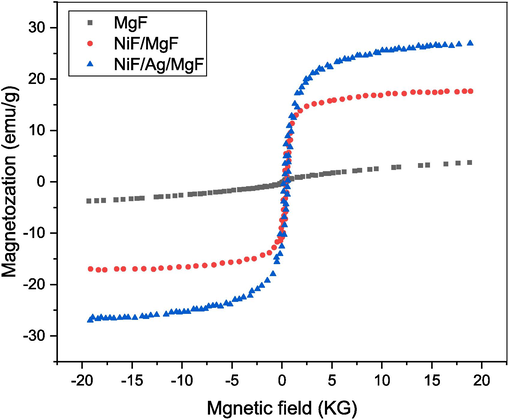
Magnetic hysteresis for MgF, NiF/MgF, and NiF/Ag/MgF samples.
The increase in magnetization for the sample NiF/MgF relative to the MgF sample could be attributed to two factors:
The addition of NiFe2O4, which in nature has high magnetization.
The interfacial interaction between the moments of MgF and NiF alleviates the ordering of the moments of the MgF surface, which were impeded in the bare MgF sample. The NiF/Ag/MgF sample shows a significant enhancement in magnetization, potentially attributed to the magnetic interaction between the two ferrimagnetic materials via the conduction electrons of the Ag metal layer, known as the RKKY interaction (El-Sayed, 2016).
3.4 Optical measurements
To measure the UV–Vis transmission spectrum of the investigated samples, 1 mg of each sample was treated with a sodium citrate solution via sonication for one hour. Subsequently, after drying the powder, it is suspended in 10 ml of distilled water. The absorption coefficient (a) is then estimated using the following relation: where d represents the thickness of the quartz cuvette, which is 10 mm, and T denotes the transmittance.
Fig. 5-a illustrates the absorption coefficients for all samples plotted against photon energy. The arrows on the curves indicate the photon energies corresponding to the maximum absorption for each sample.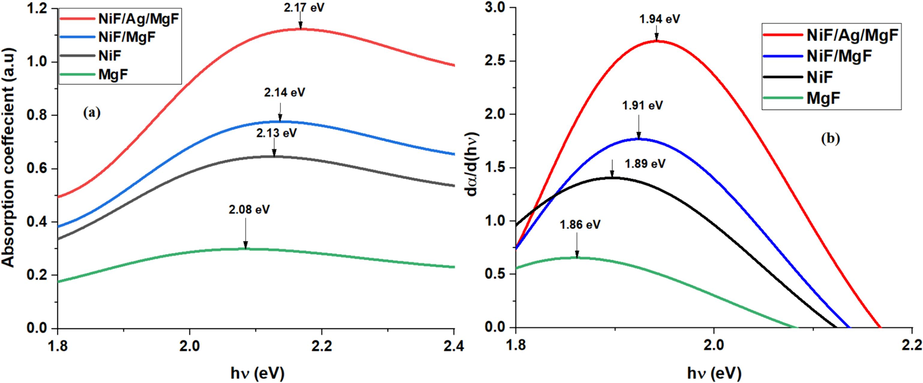
(a) Absorption coefficient vs. photon energy, (b) Derivative of the absorption coefficient relative to the photon energy.
For the determination of the energy gap, the derivative method is employed [48]. This method provides insights into which absorption coefficients exhibit the maximum change with photon energy, indicating the energy gap. It also identifies the width of the absorption band.
In Fig. 5-b, the plot depicts how the derivative of the absorption coefficient changes with incident photon energy. The energy gap of the MgF sample (1.86 eV) is slightly smaller than that of the NiF sample (1.89 eV). The NiF/MgF sample exhibits a higher absorption coefficient change at photon energy = 1.91 eV. Furthermore, the sample NiF/Ag/MgF demonstrates the highest change in absorption coefficient at 1.94 eV, along with a notable enhancement in the absorption coefficient. Notably, the energy gaps of all the investigated samples fall within the visible light range. This implies that solar radiation can serve as an excitation source for the purification method proposed in this study, eliminating the need for artificial light sources.
Estimating the electronic band diagram is essential to comprehending the optical absorption behavior of the investigated samples. It is well established that Mg-ferrite and Ni-ferrite are n-type and p-type semiconductors, respectively. Additionally, their good lattice matching and proximity to their energy gaps make them suitable candidates for constructing superlattice structures with heterojunction. Due to the disparity in Fermi levels between the two ferrites, it is anticipated that band bending will occur at the junction interface, resulting in the creation of a potential barrier between them, as shown in Fig. 6-a. The presence of dual-band absorption (core and shell) augments the number of absorbed photons, consequently increasing the absorption coefficient. Moreover, the existence of the electric field at the interface induces a driving force that separates the photogenerated electron-hole pairs, thereby decreasing the recombination rate compared to the bare MgF ferrite.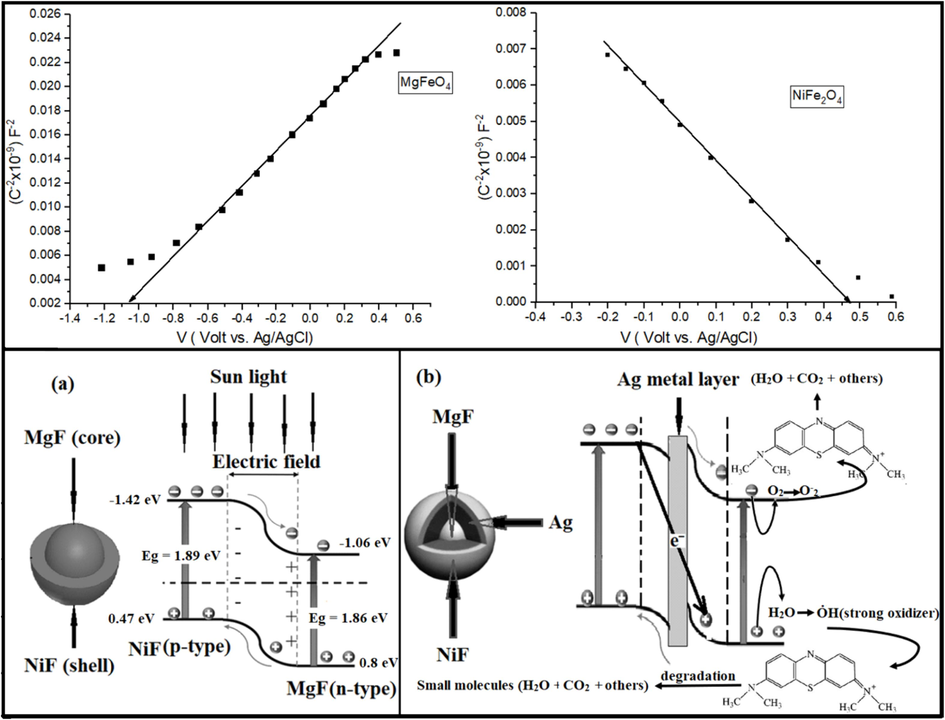
Mott-Schottky plot and energy band diagram for (a) NiF/MgF and (b) NiF/Ag/MgF samples.
3.5 Mott-Schottky plot
Mott-Schottky analysis was performed to investigate the band alignment of MgFe2O4 and NiFe2O4 samples. The valence and conduction band positions were evaluated using the flat band potential (Vfb) and bandgap values (Eg). Fig. 6 presents the Mott-Schottky (M-S) plots for MgFe2O4 and NiFe2O4, illustrating a positive slope for MgFe2O4 (indicative of an n-type semiconductor) and a positive slope for NiFe2O4 (indicative of a p-type semiconductor). The flat band potential (Vfb) was ascertained by extrapolating the 1/C2 versus potential plot to the x-axis. The flat band potentials for MgFe2O4 and NiFe2O4 were determined to be −1.06 eV and 0.47 eV against Ag/AgCl, respectively. Given that the difference between the flat band potential and the bottom/top edge of the conduction/valence band is minimal for n-type/p-type materials, the flat band potential is considered the conduction/valence band edge for n-type and p-type semiconductors, respectively. Using the flat band positions and band energy gaps, the band alignment between MgFe2O4 and NiFe2O4 was estimated.
Referring to Xiaofeng et, al. and Meng Tai et, al., the band diagram of NiF/MgF and NiF/Ag/MgF could be constructed (Sun et al., 2024; Tai et al., 2025). Fig. 6 also depicts the estimated band diagram for the NiF/MgF and NiF/Ag/MgF Z-scheme heterojunction. From the Mott-Schottky plot, the positions of VB and the CB for MgF and NiF samples are illustrated in the figure. In the NiF/Ag/MgF sample, two interfaces are present: first, the p-type NiF/Ag interface, and second, the Ag/n-type MgF interface. The significant difference in electron density between ferrites and Ag metal induces pronounced band bending at the interface, resulting in a stronger electric field at the two interfaces (forming a Schottky junction). This enhanced electric field effectively accelerates the separation of electron-hole pairs, facilitating charge carrier separation.
Furthermore, incorporating Ag metal as an intermediary between the two ferrites serves multiple functions. Not only does it function as an electron transport pathway in the Z-scheme heterojunction, but its surface plasmon resonance (SPR) effect also extends the response range into the visible region (Yuan et al., 2021). Specifically, when noble metal nanoparticles (NPs) are irradiated, the hot electrons generated by the surface plasmon resonance (SPR) effect facilitate the separation of electrons and holes. Moreover, the plasmon resonance peak extends into the near-infrared region, amplifying photothermal conversion efficiency. This phenomenon elucidates the observed augmentation in the absorption bandwidth of the NiF/Ag/MgF sample.
3.6 Photocatalysis activity (dye degradation)
This section aims to assess the efficiency of MgF, NiF/MgF, and NiF/Ag/MgF samples for the photodegradation of Methylene Blue dye (MB). A water solution containing MB is prepared by dissolving 20 mg of the dye powder in 1 L of pure water. To investigate the photodegradation of MB dye, 10 mg of ferrite sample per 100 ml of dye solution is prepared. Direct sunlight is employed for photoexcitation. At constant intervals of exposure time, the absorption spectrum is measured using a USB 4000 Ocean Optics spectrometer.
Fig. 7-a illustrates the effect of sunlight on the dye light absorption for MgF, NiF/MgF, and NiF/Ag/MgF samples. For a control sample (without the addition of any ferrite), even after 90 min of light exposure, the absorbance of the dye still exceeds 70 %, reflecting the chemical stability of MB dye in sunlight.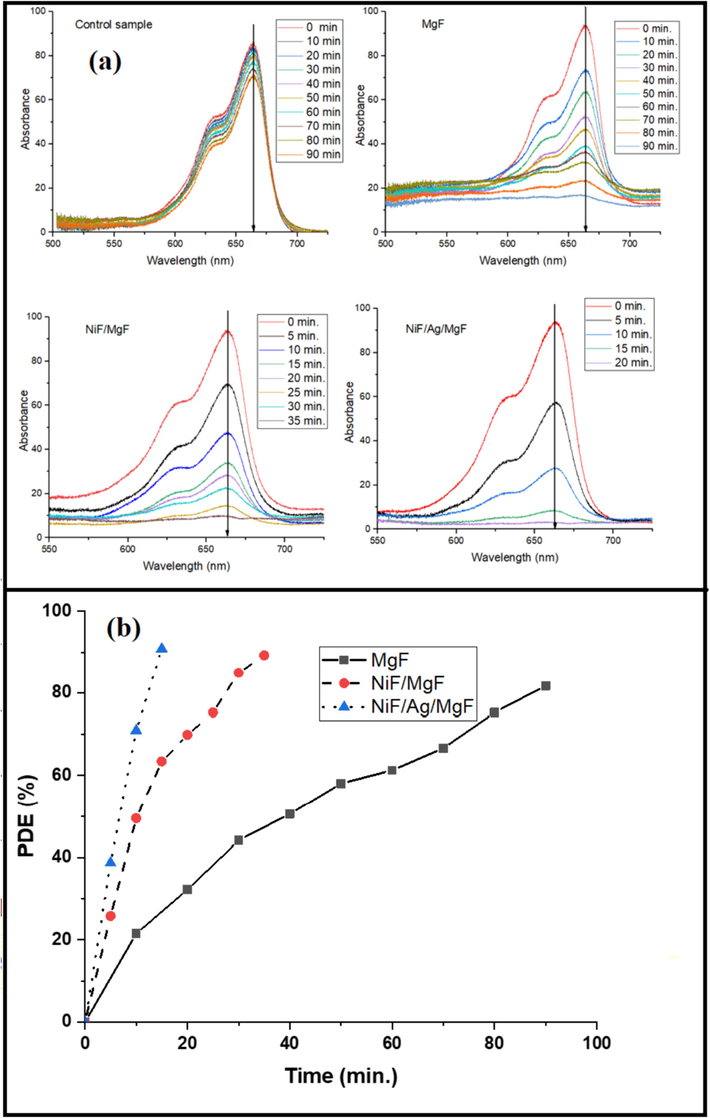
(a) Change of absorbance spectrum of MB dye for different samples. (b) PDE for MgF, NiF/MgF, and NiF/Ag/MgF samples.
For the MgF sample as a photocatalyst for dye degradation, it can be observed that the main absorption peak (at λ = 663 nm) of the dye decreases from 90 % to less than 20 % over 90 min.
For the NiF/MgF sample, the rate of decrement in absorption is faster than that of the MgF sample. Finally, the NiF/Ag/MgF sample exhibits a significant enhancement in the photodegradation of MB. It achieves complete degradation of MB dye within just 20 min.
For quantitative measurements, the photocatalyst degradation efficiency percentage (PDE%) was calculated using the following equation: Where Ao is the absorbance at t = 0, and A is the absorbance after irradiation for a certain time interval t.
Fig. 7-b illustrates the PDE% for all investigated samples over various time intervals. PDE has the highest value for the Ni/Ag/MgF sample. The last results could be understood in light of the proposed energy band diagram in Fig. 6. First of all, the mechanism of photodegradation could be divided into the following stages:
Photoexcitation: When exposed to light, the photocatalyst absorbs photons and generates electron-hole pairs.
Redox Reactions: The photogenerated electrons (e−) reduce oxygen molecules (O2) or water molecules (H2O) adsorbed on the photocatalyst surface, producing superoxide radicals (O2−). At the same time, the photogenerated holes (h+) convert the OH− group to hydroxyl radicals (OH•) which is a very strong oxidizing agent. The produced (OH•) plays the main factor in the degradation of MB into smaller complex molecules. Also, the produced (O2−) plays less role in MB degradation. The mechanism of photodegradation is illustrated in Fig. 6.
Degradation: The degradation products of the MB dye are formed because of the redox reactions and subsequent cleavage of chemical bonds.
The efficiency of the photodegradation process depends on two main factors:
Generation of Electron-Hole Pairs: This depends primarily on the absorption coefficient of the catalyst and the spectral position of its energy gap. A higher absorption coefficient results in more electron-hole pairs being generated during photoexcitation.
Recombination Rate: A slower recombination rate between electrons and holes increases the likelihood of photodegradation.
The bare MgF sample exhibits photoexcitation in the investigated sample by transferring electrons from the valence band to the conduction band. However, there is no driving force to separate the electron-hole pair. Therefore, the recombination rate is expected to be faster than that of the other samples. This process limits the efficiency of the MgF sample.
The increased absorption coefficient in the NiF/MgF heterojunction generates more electron-hole pairs during photoexcitation. Additionally, the built-in electric field at the interface assists in separating electrons and holes before spontaneous recombination can occur. These factors enhance the photodegradation efficiency relative to the bare MgF sample.
Furthermore, as mentioned above, an exceptional enhancement in photodegradation efficiency is observed in the Z-scheme NiF/Ag/MgF heterojunction configuration. This is attributed to the presence of the mediator electron of the Ag metal layer between the NiF and MgF. This mediator electron facilitates recombination between electrons in the p-type and holes in the n-type via the conduction electron of the Ag metal layer. Additionally, the formation of a Schottky barrier by the metal layer enhances the built-in electric field at the interface, further increasing the rate of electron-hole separation. Moreover, the presence of surface plasma enhances the width of the absorption band, leading to an increase in the generation of electron-hole pairs. Collectively, these factors contribute to the significant enhancement in photodegradation efficiency observed in the Z-scheme NiF/Ag/MgF heterojunction.
The key parameters and performance of the investigated sample are compared with similar ferrite materials (Shi et al., 2022). Table 2 presents a comparison in the degradation of MB between the performance of NiF/Ag/MgF and previously published ferrites. NiF/Ag/MgF structure demonstrates a significantly improved removal efficiency compared to the other ferrites.
Sr. No.
Photocatalyst
Light source
Dye concentration (mg/l)
Catalyst Dosage (g/l)
Reactive time (min.)
Removal efficiency (%)
1
Zn ferrite (KumarGupta et al., 2020)
UV
10
0.5
75
96 %
2
Co ferrite (KumarGupta et al., 2020)
UV
10
0.5
75
93 %
3
Mn ferrite/GSC (Luciano et al., 2020)
Sunlight
10
0.25
180
100 %
4
Ni ferrite/GO (Rahman et al., 2020)
Halogen lamp
5
0.5
70
95 %
5
Ni ferrite (KumarGupta et al., 2020)
Halogen lamp
10
0.1
60
98 %
6
Nd-Ni-Zn-ferrite (Rahman et al., 2020)
Solar light
20
0.25
90
98 %
7
Co-Mg ferrite (Shi et al., 2022)
Halogen lamp
10
0.1
90
74 %
8
Mg ferrite (Kaur et al., 2015)
Sunlight
10
0.1
120
82 %
9
Ce-Ni ferrite/rGO (Shi et al., 2022)
Xenon lamp
5
0.5
70
95 %
10
Cu ferrite (KumarGupta et al., 2020)
UV
10
0.5
74
95 %
Present
NiF/Ag/MgF
Sunlight
20
0.1
20
97 %
3.7 Residual species and cycling stability
The decomposition of MB results in smaller compounds such as CO2, ammonia (NO3)−, and (SO4)2−[61]. FTIR spectrum of MB solution before and after treatment is used to verify the decomposition of MB into smaller molecules during the purification. Fig. 8-a shows the FTIR spectra for both cases. For untreated MB solution (black curve), the peaks at 2900 cm−1 are due to C—H vibrational modes, and the peaks in the range 1300–1650 cm−1 are attributed to C—N, CO—N and CH3 vibrational mode while the peaks around 1000 cm−1 belong to N—H modes of vibrations. The last peak at 670 cm−1 is attributed to C—S—C vibrations. For the treated solution, all complex groups of carbon, nitrogen and Sulphur disappeared which proves the degradation of the MB in the water solution. The new peaks in 1711 and 1418 cm−1 correspond to NO3− while the peak at 551 cm−1 corresponds to SO42−.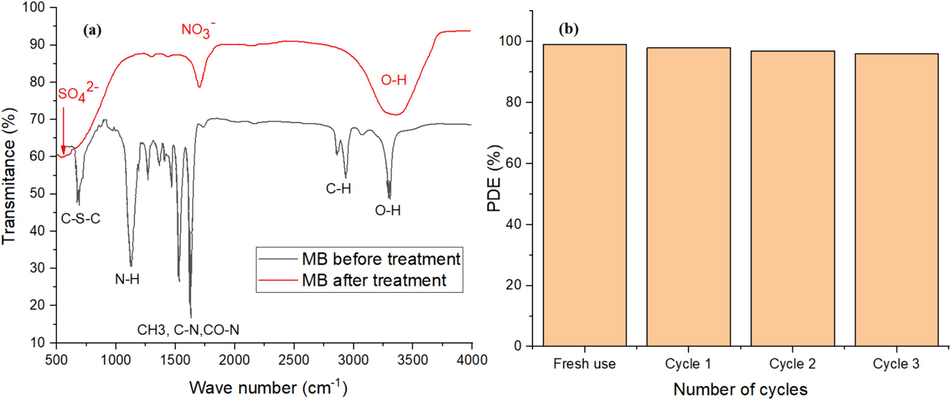
(a) FTIR for Methylene blue solution before and after degradation. (b) Stability of NiF/Ag/MgF photocatalyst for three successive cycles for the degradation of MB.
The cycling stability of the NiF/Ag/MgF sample was assessed by extracting the sample powder from the water solution using an Nd magnet and then heat treating it at 300 °C for 60 min to remove any adsorbed molecules on the surface of the particles. The sample was subsequently reused for water purification from MB. This procedure was repeated three times with the same sample. The histogram in Fig. 8-b illustrates the PDE (%) (after 15 min of sunlight exposure) for the three cycles compared to the first one. The minor decrease in the PDE with each cycle indicates the sample's good stability and suitability for multiple uses in water purification.
4 Conclusions
In conclusion, this study explored the photodegradation efficiency of core/shell structures involving NiFe2O4/MgFe2O4 (NiF/MgF) and Z-scheme NiFe2O4/Ag/MgFe2O4 (NiF/Ag/MgF) heterojunctions for Methylene Blue dye degradation. X-ray diffraction analysis confirmed the formation of core/shell structures by revealing an increase in particle size and micro-strain for NiF/MgF and NiF/Ag/MgF samples. The NiF/Ag/MgF sample exhibited the highest magnetization, attributed to the RKKY magnetic interaction between NiF and MgF magnetic moments via the conduction electron of the Ag metal layer. Optical measurements indicated enhanced absorption coefficient and absorption bandwidth for core–shell structures. Furthermore, the energy gaps are situated within the visible light region, providing an advantage for utilizing solar radiation as an excitation source instead of relying on artificial sources. Photocatalytic activity measurements demonstrated that NiF/MgF and NiF/Ag/MgF heterojunctions significantly enhanced the photodegradation efficiency compared to bare MgFe2O4 (MgF). The presence of the Ag metal layer in the NiF/Ag/MgF heterojunction decreases the electron-hole recombination rate and enhances electron-hole separation, resulting in exceptional photodegradation efficiency. These findings underscore the significance of Z-scheme heterojunction configurations in improving photodegradation processes. Finally, using ferrite materials as photocatalytic oxides allows for the removal of waste materials through a simple magnetic extraction method.
CRediT authorship contribution statement
M.K. Al Turkestani: Writing – review & editing, Writing – original draft, Visualization, Validation, Supervision, Software, Resources, Project administration, Methodology, Investigation, Formal analysis, Data curation, Conceptualization.
Declaration of competing interest
The authors declare that they have no known competing financial interests or personal relationships that could have appeared to influence the work reported in this paper.
References
- The photocatalytic process in the treatment of polluted water. Chem. Pap.. 2023;77:677-701.
- [CrossRef] [Google Scholar]
- Removal of methylene blue from aqueous solutions using nano-magnetic adsorbent based on zinc-doped cobalt ferrite. Chem. Methodol.. 2020;4(1):1-18.
- [Google Scholar]
- Solar-driven advancements for water purification: Harnessing sustainable energy for potable water provisioning. J. Xi'an Shiyou Univ. Nat. Sci. Ed.. 2023;19(08):583-591.
- [Google Scholar]
- Synthesis of Fe3O4/Bi2WO6 nanohybrid for the photocatalytic degradation of pharmaceutical ibuprofen under solar light. J. Ind. Eng. Chem.. 2017;51:244-254.
- [CrossRef] [Google Scholar]
- Photocatalytic degradation of alachlor using Type-II CuS/BiFeO3 heterojunctions as novel photocatalyst under visible light irradiation. Chem. Eng. J... 2018;344(15):391-401.
- [CrossRef] [Google Scholar]
- Tailoring the porosity of ZnO/ZnFe2O4 composites for photocatalytic applications. Ceram. Int.. 2017;43(17):16027-16031.
- [CrossRef] [Google Scholar]
- Semiconductor-based photocatalytic hydrogen generation. Chem. Rev.. 2010;110(11):6503-6570.
- [CrossRef] [Google Scholar]
- Evidence on the presence of Ruderman–Kittel–Kasuya–Yosida (RKKY) interaction in CoFe2O4@Au nano structure. Superlattice. Microst.. 2016;91:98-104.
- [CrossRef] [Google Scholar]
- Electrochemical photolysis of water at a semiconductor electrode. Nature. 1972;238(5358):37-38.
- [CrossRef] [Google Scholar]
- Semi conductive Tl2O3 nanoparticles: facile synthesis in liquid phase, characterization and its applications as photocatalytic substrate and electrochemical sensor. J. Mol. Liq.. 2016;219:720-727.
- [CrossRef] [Google Scholar]
- Magnetoabsorption and magnetic hysteresis in Ni ferrite nanoparticles. EPJ Web Conf.. 2013;40:17003
- [CrossRef] [Google Scholar]
- MgFe2O4 nanoparticles loaded on activated charcoal for effective removal of Cr (VI) – a novel approach. Ceram. Int.. 2015;41(10):13739-13750.
- [CrossRef] [Google Scholar]
- Photocatalytic degradation of organic pollutants over MFe2O4 (M= Co, Ni, Cu, Zn) nanoparticles at neutral pH. Sci. Rep.. 2020;10:4942
- [CrossRef] [Google Scholar]
- Photocatalytic degradation of methyl orange dye by NiFe2O4 nanoparticles under visible irradiation: effect of varying the synthesis temperature. J. Mater. Sci. Mater. Electron.. 2018;29(9):1-11.
- [Google Scholar]
- Recent developments in ZnS photocatalysts from synthesis to photocatalytic applications – a review. J. Powder Technol.. 2010;318:8-22.
- [CrossRef] [Google Scholar]
- Effects of textile dyes on health and the environment and bioremediation potential of living organisms. Biotechnol. Res. Innov.. 2019;3(2):275-290.
- [CrossRef] [Google Scholar]
- Advances in Z-scheme semiconductor photocatalysts for the photoelectrochemical applications: a review. Carbon Energy.. 2022;4(3):294-331.
- [CrossRef] [Google Scholar]
- Synthesis of a WO3 photocatalyst with high photocatalytic activity and stability using synergetic internal Fe3+ doping and superficial Pt loading for ethylene degradation under visible-light irradiation. J. Catal. Sci. Technol.. 2019;9:652-658.
- [CrossRef] [Google Scholar]
- Manganese ferrite dispersed over graphene sand composite for methylene blue photocatalytic degradation. J. Environ. Chem. Eng.. 2020;8:104191
- [Google Scholar]
- Pandey, S., Dhuria, S.S., 2023. Industrial Water Pollution and Its Management. Walnut Publication (an imprint of Vyusta Ventures LLP). ISBN: 978-93-5911-460-6. https://www.walnutpublication.com.
- Construction of (001) facets exposed ZnO nanosheets on magnetically driven cilia film for highly active photocatalysis. Appl. Surf. Sci.. 2017;394(1):115-124.
- [CrossRef] [Google Scholar]
- Fabrication of Ce3+ substituted nickel ferrite-reduced graphene oxide heterojunction with high photocatalytic activity under visible light irradiation. J. Hazard. Mater.. 2020;394:122593
- [CrossRef] [Google Scholar]
- Intramolecular D-A structure and n-π* transition co-promoted photodegradation activity of carbon nitride: performance, mechanism and toxicity insight. Chem. Eng. J.. 2022;456:141029
- [CrossRef] [Google Scholar]
- A new method for the determination of optical band gap and the nature of optical transitions in semiconductors. Appl. Phys. B. 2015;119(2):273-279.
- [Google Scholar]
- Development of ternary Pt/BaTiO3/Bi2O3 heterostructured piezo-photocatalysts for antibiotic degradation. Appl. Surf. Sci.. 2024;653:159421
- [CrossRef] [Google Scholar]
- Visible light driven photocatalytic degradation of rhodamine B using Mg doped cobalt ferrite spinel nanoparticles synthesized by microwave combustion method. J. Phys. Chem. Solid. 2017;108:61-75.
- [CrossRef] [Google Scholar]
- Construction of visible light driven CuBi2O4/Bi2WO6 solid solutions anchored with Bi12O17ClxBr 2–x nanoparticles for improved photocatalytic activity. Ceram. Int.. 2021;47(1):320-328.
- [CrossRef] [Google Scholar]
- Tailoring C-defect O-doping and n-π* transition awakened porous ultra-thin carbon nitride for efficient peroxymonosulfate activation: performances and mechanism insight. J. Environ. Sci.. 2025;152:353-367.
- [CrossRef] [Google Scholar]
- Structural and magnetic properties of nanocrystalline nickel ferrite (NiFe2O4) synthesized in sol-gel and combustion routes. Solid State Sci.. 2018;86:86-97.
- [CrossRef] [Google Scholar]
- Synthesis and application of perovskite-based photocatalysts in environmental remediation: a review. J. Mol. Liq.. 2021;334(15)
- [CrossRef] [Google Scholar]
- Fabricating fragmented intramolecular D-A integrated carbon nitride photocatalyts with elevating activity: performance and mechanism analysis. Int. J. Hydrogen Energy. 2024;51:61-71.
- [CrossRef] [Google Scholar]
- Direct Z-scheme ZnO/CdS hierarchical photocatalyst for enhanced photocatalytic H2-production activity. Appl Catal B. 2019;243:19-26.
- [CrossRef] [Google Scholar]
- Strategies for enhancing the photocatalytic performance of g-C3N4-based photocatalysts: a critical review. Arab. J. Chem.. 2023;16(3):104542
- [CrossRef] [Google Scholar]
- A review of metal oxide-based Z-scheme heterojunction photocatalysts: actualities and developments. Mater. Today Energy. 2021;21:100829
- [CrossRef] [Google Scholar]
- Understanding polymorphic phase transformation behavior during growth of nanocrystalline aggregates: insights from TiO2. J. Phys. Chem. B.. 2000;102(52):10414-10422.
- [CrossRef] [Google Scholar]
- Polyethyleneimine-induced in-situ chemical epitaxial growth ultrathin 2D/2D graphene carbon nitride intralayer heterojunction with elevating photocatalytic activity: performances and mechanism insight. Int. J. Hydrogen Energy. 2024;51:884-896.
- [CrossRef] [Google Scholar]
- Recent advances on small molecule doped carbon nitride photocatalysts: application in environmental water remediation and clean energy production. Arab. J. Chem.. 2024;17(6):105808
- [CrossRef] [Google Scholar]
- One-step synthesis of flower-like WO3/Bi2WO6 heterojunction with enhanced visible light photocatalytic activity. J. Mater. Sci.. 2018;51(4):2112-2120.
- [Google Scholar]
- Superparamagnetic contributions, optical band gap tuning and dominant interfacial resistive mechanisms in ferrites nanostructures. J. Alloys Compd.. 2022;894(15):162431
- [CrossRef] [Google Scholar]


