

Translate this page into:
Comparative phytochemicals screening and estimation of constituents present in the leaves of Decalepis species through HPLC
⁎Corresponding author. faryasmin79@gmail.com (Farhana Yasmin)
-
Received: ,
Accepted: ,
This article was originally published by Elsevier and was migrated to Scientific Scholar after the change of Publisher.
Peer review under responsibility of King Saud University.
Abstract
Background and objectives
The variation in the active phytoconstituents in different plants causes changes in their biological properties. The present study was aimed with the comparative phytochemicals and estimation of the constituent present in the leaves of Decalepis species using high performance liquid chromatography (HPLC).
Materials and Methods
The leaves of Decalepis hemiltonii Wight & Arn. Decalepis arayalpathra(J. Joseph and V. Chandras.) Venter. and Decalepis nervosa(Wight &Arn.) Venter.were selected and methanol solvent was used for the preparation of the extracts. Various proximate analysis viz. moisture content, ash values, crude fibers, extractive values were estimated. Thereafter, series of basic chemical tests for the methanol leaves extracts followed by total phenolics, and total flavonoids content were also carried out. Furthermore, TLC chromatogram and RP-HPLC study was carried out for all the plant extracts to find out the presence of phenolic compounds and compared the estimated amount present in all the leaves extracts.
Results
The outcome of the study revealed that all the three species varied with the yield and the phytochemical screening showed varied concentration of alkaloids, glycosides, flavonoids, proteins, steroids, phenols, and tannins. Among the three species Decalepis hemiltonii(DH) showed presence of higher percentage of moisture (8.6%), crude fibers (8.32%) and total ash content (4.95%) than others. Further, presence of high concentration of phytochemicals was showed by Decalepis arayalpathra (DA) and the higher yield in methanol solvent than other two species. The same plant sample showed presence of higher amount of gallic acid (0.86 mg/100 g) than other two species. Total alkaloids, total phenolic and total flavonoids were higher in DA leaves flowed by Decalepis nervosa (DN) and DH leaves samples.
Interpretation
Overall the results indicated that DA leaves extracts was better in terms of yield, presence of phytoconstituents, presence of total alkaloids, total flavonoids, and total phenolics and presence of gallic acid followed by DN and DH leaves.
Keywords
Decalepis hemiltonii
D. nervosa
D. arayalpathra
Phytochemicals
Proximate analysis
HPLC

1 Introduction
India is a hub of natural sources and because of the diversity of climatic conditions, it is a treasure trove of important medicinal and aromatic plants. India has over 47,000 plant species, with 17,000 of them being angiosperms (Bapat et al., 2008). There are number of endangered species from India and other parts of the world threatening the global impact on social, financial, and physical wellbeing of mankind (Hamilton, 2004).
Oflate, Decalepis is a critically endangered woody medicinal climber (Family: Periploaceae). Earlier, it was the only monotypic genus in the family, but currently there are five species of Decalepis, including D. hamiltonii, D. arayalpathra, D. salicifolia, D. khasiana, and D. nervosa, are available from different regions of India. D. hamiltonii (DH) is very familiar and widely used among them.All these species are grown in hilly regions. Except D. khasiana, rest all four species are became endangered (Sharma and Shahzad, 2014). These plant species are very similarto each other so difficult to identify proper plant species. Decalepis nervosa (DN, Wight &Arn.) Venter is a critically endangered medicinal plant found in Karnataka, Kerala, and Tamil Nadu states of India (Khan and Das, 2019). To the south of the Palghat Gap, D. arayalpathra (DA) is found in hilly and mountainous terrain. It lives on rocky hill slopes in Kerala's Agasthiyar highlands and in Tamil Nadu's Kalakkadu Mandanthurai tiger reserve (Ahmad et al., 2018). The Kani tribe of Kerala has long recognized DA as a valuable medicinal plant (Sharma and Shahzad, 2014).
DA and DH are used in tribal and traditional Indian and Chinese medicine to cure a variety of diseases of gastrointestinal tract, respiratory system, neuro-protective, and blood supply, but no similar use for the DN plant has been documented (Sowbhagya et al., 2017). The tuberous roots are the main organs used, since they are fragrant and sweet-tasting, with a vanilla-like taste and odour (Nagarajan and Rao, 2003). DH fresh fleshy roots yielded a volatile oil (0.68%) in which benzaldehyde (0.017%), salicylaldehyde (0.018%), methyl salicylate (0.044%), benzyl alcohol (0.016%), 2-phenylethyl alcohol (0.081%), ethyl salicylate (0.038%), p-anisaldehyde (0.01%), and vanillin (0.45%) are present (Nagarajan et al., 2001) but not much reports on constituents present in the leaves of Decalepis species.
In the present study, DH, DN, and DA species were selected and compared their phytochemicals, various proximate parameters followed by extracted yield and total alkaloids, flavonoids, phenolics etc. Results indicated the significant differences among the three species of Decalepis. This investigation helps in identification and differentiation among the species and also easy way for the selection of the authentic plant for further research study.
2 Materials and method
2.1 Collection of plant material
The leaves of DN, DH and DA plants were obtained from Indian Institute of Horticultural Research, Bengaluru.The plant leaves were identified and authenticated by a plant taxonomist Dr. P. E Rajshekharan, IIHR, Bengaluru and preserved with the voucher specimens (KCP-PCOG/DH/334/2021–22, KCP-PCOG/DA/335/2021–22 and KCP-PCOG/DN/336/2021–22) separately in department of Pharmacognosy, Krupanidhi College of Pharmacy, Bengaluru, in the herbarium.
2.2 Preparation of plant crude extracts
After thoroughly cleaning leaves, leaves were dried for 15 days at room temperature. Subsequently, the leaves were separated and coarsely ground. Labeled them separately and stored them in a plastic sealed cover to protect them from moisture and microbial contamination until they were needed for the experiment.
The extract was prepared with methanol as a solvent. The extraction was done with 200 g of powdered pharmaceuticals using the soxhlet method at 40 °C for 6 h. Separately, they were filtered, and the extracts were concentrated to a thick viscous state using rotary flash evaporator at temperature 45°C, yielding semi solid residue.
2.3 Proximate analysis
2.3.1 Moisture content
The crucible was placed in the hot air oven for 2 h at 105 °C. The crucible was then placed in desiccators to cool. 5 g of powder was added in the beaker then weighed. The sample was dried for 3 h in a 105 °C oven. The dried and cooled sample was then weighed, and the moisture content was estimated using the formula as given by Ajeesh Krishna et al., 2014.
2.3.2 Total ash content
The AOAC method for determining total ash was used (Abeysinghe et al., 2021). For 2 h, 1 g of dried powdered was maintained in a silica crucible at 450 °C in a muffle furnace. After ash, it was weighed and cooled in a desiccator. The process was repeated until the weight remained unchanged and total ash was calculated.
2.3.3 Alcohol soluble ash
The ash was digested in a boiling water bath for 30 min with 25 mL of alcohol as a solvent. Using ash-free filter paper, the contents of the silica crucible were filtered. The residue-covered filter paper was carefully removed and placed in the same crucible. The value of soluble ash was estimated as mentioned by Ajeesh Krishna et al., 2014.
2.3.4 Acid insoluble ash
The ash was heated for 5 to 10 min in 25 mL of 2 N HCl. The insoluble materials was then collected after the solution was filtered using an ash-free filter paper. This insoluble substance was then rinsed with hot water, burned, and weighed (Ajeesh Krishna et al., 2014).
2.3.4.1 Extractive values
5.0 g of leaves were roughly pulverized and macerated in a closed iodine flask for 24 h using 100 mL of alcohol and distilled water separately. The process was carried out using a method given by Ajeesh Krishna et al., 2014.
2.3.4.2 Crude fiber
The crude fibre was determined using the procedure indicated by Sabir et al., 2005. Briefly, 2 g samples were digested in 150 mL of 0.2 N sulphuric acid for 30 min, samples was subsequently washed in hot deionized water and the fiber was removed and dried by soaking it in a little amount of acetone and letting it drain. The percent of crude fiber was estimated further.
2.4 Phytochemical screening
Phytochemical screening of the said plant extracts was carried out individually to detect the presence of bioactive components such as alkaloids, glycosides, tannins, saponins, terpenoids, flavonoids, and sterols, using a method reported in the literature (Donkoret al., 2016; Daset al., 2020).
2.5 Total flavonoid content (TFC)
TFC was calculated for all three leaf extracts according to Ayoola et al., 2008. The extracts (1 mg/mL) were dissolved in water and NaNO2mixture and incubated for 6 min before being added to 150 L of 10% AlCl3. The absorbance of the solutions was measured at 510 nm. The result was computed using Catechin's standard calibration curves. The results are given in milligrammes of catechin equivalents per gramme of dry extract.
2.6 Total phenolic content (TPC)
Gallic acid was used as a reference to measure the total phenolic content of Stevia infusion extract (Shan et al., 2005). Folin-Ciocalteu reagent (1 mL) was added to 0.1 mL of the extract (1 mg/mL) and allowed to sit for 5 min. A UV–visible spectrophotometer was used to measure the absorbance of the blue hue produced by 1 mL (7.5 percent w/w) sodium carbonate after 90 min of incubation at room temperature at 765 nm (Janeway, 96500, UK). The value was computed using the gallic acid calibration curve and represented in milligrams of gallic acid equivalent per gramme of dry extract.
2.7 HPLC study
2.7.1 RP-HPLC instrumentation
A 600-controller pump system with UV–Visible detector was used in this study. The external calibration method was used to achieve quantitative estimation with Empower 2 software applications. The water purification system used was a Milli-Q academic water purification system with a 0.22 µm. Finally, the peak at 203 nm was detected.
2.7.1.1 Preparation of standard and sample solutions
In methanol (1 mg/ml), a standard gallic acid solution was produced. 5–100 g/ml calibration samples were made. Dissolving 10 mg of extract in 1 mL methanol was also used to make the sample solution. A Whatman NYL 0.45 µm syringe filter was used to filter both the standard and sample solutions. Peak areas vs concentration was used to quantify the responses.
2.7.1.2 Method validation
Linearity, specificity, limit of detection (LOD), limit of quantification (LOQ), accuracy and precision were validated as per ICH guidelines (Mukherjee and Wahile, 2006).
2.7.1.3 Linearity
A linear regression was used to fit triplicate values obtained at various concentrations (5 to 100 g/ml) to create the standard response curve for gallic acid. The peak regions of 20 L of each solution were measured after chromatography. The linear range of gallic acid was determined by plotting peak regions against respective concentrations.
2.7.2 Specificity:
For identification and purity determination, the method's specificity was estimated with respect to compare the retention duration of the test and standard samples.
2.7.3 Accuracy and precision:
To determine the accuracy and precision of each analyte, various quality controls were used. Both sets of data were evaluated by comparing them inside a single run (n = 6). The method's accuracy was determined using a typical addition methodology and represented as a percent RSD. The precision of the procedure was tested by injecting six replicates of the reference drug at three different concentrations and evaluating intra-day and inter-day fluctuation.The percentage RSD was used to represent the values.
2.8 Statistical analysis
Means and standard error of the mean (SEM) were applied for the proximate analysis and total phenolics, total flavonoids determination for all the leaves samples. Statistical analysis was done using Graph Pad Prism Version 5.0.
3 Result
3.1 Crude extract
All the plant leaves were extracted with methanol solvent and calculated for the yield of the crude extracts (w/w). The results were tabulated in Fig. 1.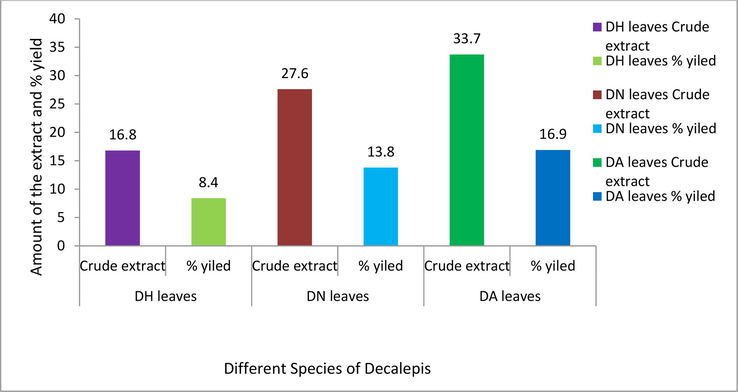
Percentage yield and amount of crude extracts of different species of Decalepis.
DH = Decalepis hemiltonii, DN = D. nervosa, DA = D. arayalpathra.
3.2 Proximate analysis
Various parameters like moisture content, ash contents, extractive value and crude fibre were determined for allpowdered samples. The result was tabulated in Table 1. Proximate analysis Total flavonoids content (mg CE/g) Mean ± SEM, n = no. of trial conducted. DH = Decalepis hemiltonii, DN = D. nervosa, DA = D. arayalpathra.
Type of analysis
DH leaves sample
DA leaves sample
DN leaves sample
Moisture content (%)
9.63 ± 0.23
7.32 ± 0.11
6.84 ± 0.22
Total Ash content (% w/w)
4.95 ± 0.01
2.26 ± 0.41
3.80 ± 0.40
Alcohol soluble ash
2.46 ± 0.22
1.58 ± 0.03
1.64 ± 0.31
Acid insoluble ash
1.18 ± 0.02
0.14 ± 0.10
0.38 ± 0.20
Extractive value (n = 3)
Alcohol soluble extractive
36.42 ± 0.31
43.51 ± 0.10
41.12 ± 0.24
Water soluble extractive
7.53 ± 0.13
6.18 ± 0.32
8.46 ± 0.33
Crude fibre (%)
13.34 ± 0.31
8.34 ± 0.20
9.21 ± 0.41
0.120 ± 0.11
0.231 ± 0.03
0.173 ± 0.21
c) Total Phenolics content (mg GAE/g)
0.139 ± 0.01
0.228 ± 0.21
0.187 ± 0.30
3.3 Total flavonoid and phenolics
The content of total flavonoids and total phenolics were estimated for all the said leaves and the result was tabulated in table 1.
3.4 Phytochemical screening
Various chemical tests for the above said plant extracts was performed and revealed the presence of various groups of constituents namely,alkaloids, glycosides, flavonoids, proteins, steroids, phenols, and tannins. The result was tabulated in Table 2. + = Present; -- = Negative; DH = Decalepis hemiltonii, DN = D. nervosa, DA = D. arayalpathra.
DH
DN
DA
Alkaloids
+
++
+++
Glycoside
–
+
+
Phenolics
+
++
++
Saponins
–
–
–
Flavonoids
+
++
+++
Terpenoids
+
+
++
Steroids
+
+
++
Tannins
+
+
+
3.5 HPLC study
3.5.1 Validation of the method
The linearity, accuracy, precision, selectivity, and specificity of the approach were all put to the test. In all validation studies, standard and sample solutions were injected in duplicate. The correlation coefficient and intercept were utilized to evaluate the strategy (Table 3). The linearity range for gallic acid was between 10.5 and 60 µg/ml.The quantification limit was 3.42 µg/ml, whereas the detection limit was 0.84 µg/ml. A recovery study was carried out to ensure that the developed approach was accurate. The recovery of the chemical was calculated using a standard solution (10 µg/ml) added to three distinct pre-analyzed sample solutions. Table 4 shows the results of the accuracy assessments. The current accuracy test revealed that the recovery levels for DH, DN, and DA extracts were 93.68, 95.81, and 99.48 percent, respectively. Gallic acid was also measured properly in three separate leaf extracts using this approach. The precision features of the retention time and peak area (intra- and inter-day) for standard were assessed (Table 5). The relative standard deviation (RSD) for retention duration and peak area for intra- and inter-day wasvery less with acceptable precision, according to the current data. The intra-day RSD for retention time was 0.14 percent, whereas the intra-day RSD for peak area was 1.74 percent. Meanwhile, the RSD. for retention time was 0.21 percent, while the RSD for peak area was 2.02 per cent. The method's selectivity of standards was determined by the resolution between the standards peak. DH = Decalepis hemiltonii, DN = D. nervosa, DA = D. arayalpathra.
Retention time (min)
Regression equation
Correlation coefficient (R)
Linear range (μg/mL)
Detection limit (μg/mL)
Quantification limit (μg/mL)
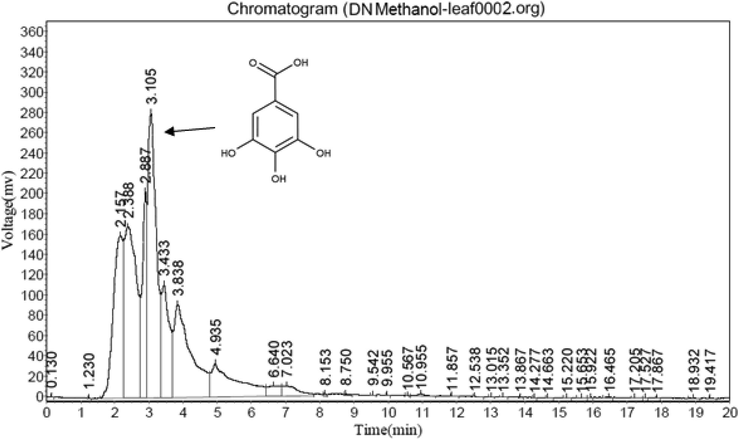
3.105
y = 46103× − 62,501
0.9999
10.5 to 60
0.84
3.42
Decalepis extracts
Amount added (μg/mL)
Amount found
(μg/mL)
Recovery (%)
Average of recovery (%)
DH
10
9.368
93.68
96.32
DN
10
9.581
95.81
DA
10
9.948
99.48
Intra-day R.S.D. for retention time (%)
Intra-day R.S.D for peak area (%)
Inter-day R.S.D for retention time (%)
Inter-day R.S.D for peak area (%)
0.14
1.74
0.21
2.02
3.5.2 Amount of gallic acid
The present result showed that higher gallic acid (Fig. 2) content (0.86 mg/100 g) in DA (Fig. 3) leaves followed by DN (0.62 mg/100 g, Fig. 5) and DH (0.46 MG/100 G, Fig. 4) extracts respectively.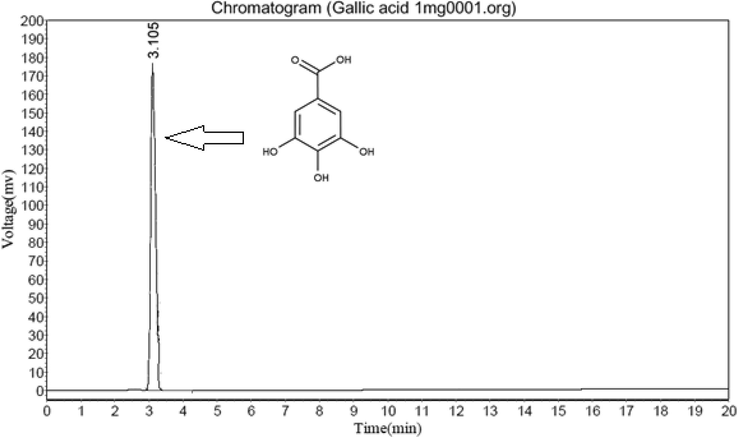
HPLC of Standard Gallic acid.
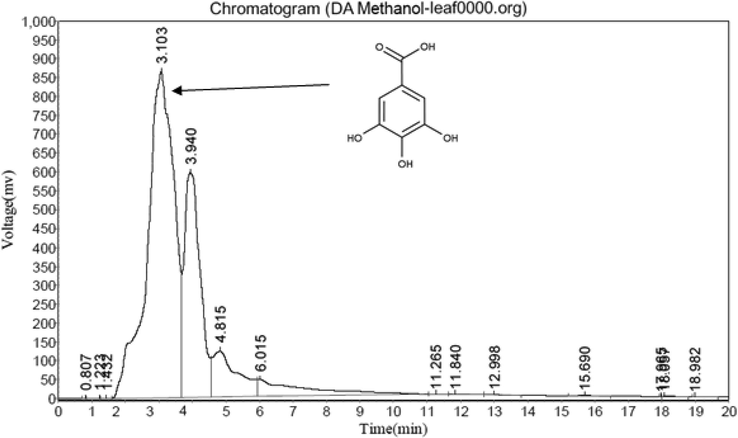
HPLC study of DA leaf methanol extract.
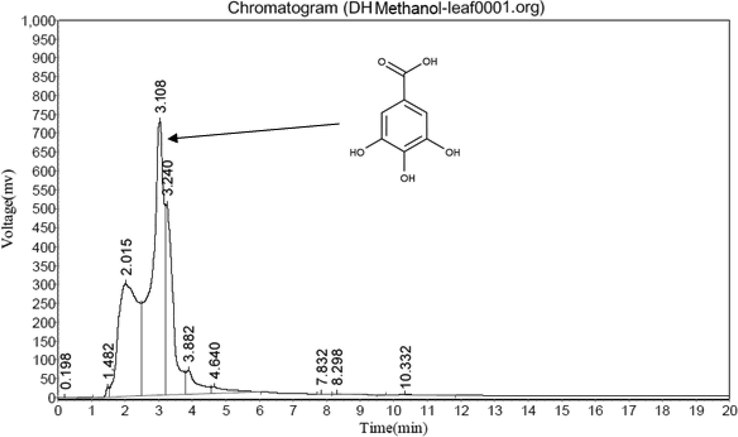
HPLC study of DH leaf methanol extract.
HPLC study of DN leaf methanol extract.
4 Discussion
Three Decalepis species viz. DH (Decalepis hemiltonii), DN (D. nervosa), and DA (D. arayalpathra) leaves were selected and evaluated for various proximate studies for the said plant species. The results revealed that DH leaves content more concentration of moisture, crude fibres, ash content etc. The same were less in DN and DA respectively.
Methanol leaves extract of Decalepis species were carried out and showed higher percentage of crude extract 16.9 % with DA plant followed DN leaves extract (13.8 %) and then DH leaves extract (8.4 %). The lower ash content of the DA plant, followed by DN and DH, accounts for the higher percentage of leaves extract. An earlier study found that methanol leaves extract yielded higher yields than other solvent extracts (Samydurai and Thangapandian, 2012). The increased yield shown by the leaves extract from the DA plant was also observed in our current study.
For each Decalepis species, the moisture content and total ash content of powdered leaves were calculated independently. The moisture and ash content of the leaves of the DH plant were found to be greater. This is because the leaves have more fibres, veins, and vein islets, which boost the content, found that leaves powder had more moisture and ash than any other plant parts (Borkataky et al., 2013; Puthalath et al., 2015). Not only that, all the physical parameters are also depends on the age of the leaves and the dimension of the leaf size (Oduntan and Olaleye, 2012). In the present investigation, DH plant leaves are having more dimension than other two species i.e DN and DA respectively and hence DA leaves showed less ash content, moisture content and crude fibre content than other two species. The main consequences of this discovery are that plant medications with a high moisture content will have a shorter shelf life. Following that, the ash values of every Decalepis species leaves were examined independently to rule out the presence of any extraneous matter such as soil, sand, or water soluble salts adhering to the drug's surface. Because silica is commonly found in acid insoluble ash, a high level of acid insoluble ash is a sign of contamination with earthy materials. In the present investigation, the DH leaves showed more acid insoluble ash (1.18 %) followed by DN and DA. It indicated the lowest content of bioactive compounds in the extract (Ahmadet al., 2015) which was also below the limits.The same result followed in the present study.
The study indicated that leaves of DA contain prominently alkaloids, phenolics, flavonoids, steroids and terpenoids when confirmed with chemical test. Similarly, DN and DH extracts are also showed the presence of these constituents but not prominently. It was reported that any medicinal or therapeutic activities are mainly depends on the active constituents present in the plant part (Borkataky et al., 2013). Earlier research reported that solvent extracts also has effects on phytochemicals present in plants as well as on various therapeutic activities (Naimaet al., 2015; Felhi et al., 2017). Our experiment also showed maximum constituents in methanol solvent for leaves of DA followed by DN and DH.
Total phenol content as well as total flavonoid content was estimated higher in leaves extract of DA and the similar trend followed for the other extracts. Methanol solvent was used for the extraction which increased the solubility of phenols. Previous research has shown that phenols' strong solubility in polar solvents results in large concentrations of these chemicals in extracts (Mohsen and Ammar, 2009). Other scientific literatures were also reported that the solvent polarity plays major role in the concentration of phenols and flavonoids in the plant extracts (Gezici and Sekeroglu, 2021; Das et al., 2019). Flavonoids provide significant therapeutic efficacy in the crude extracts, and their hydroxyl groups give antioxidant activity and a radical scavenging function too in plants (Tomsone et al., 2012). In this experiment, flavonoid content was estimated higher in leaves of DA and showed similar trend to the previous reports (Baba and Malik, 2015). Thereafter, ash value is having correlation with the content of the bioactive components in plants where it was reported that more ash values indicated less bioactive components present in the leaf sample.
Based on the phytochemicals present and proximate analysis of all the Decalepis species, further gallic acid was estimated in all the Decalepis species through HPLC study and resulted gallic acid content was higher in DA leaf sample followed by DN and DH. The result also correlated with the proximate analysis and the same result also revealed with the earlier researchers.
5 Conclusion
In conclusion, the study indicate that the Decalepis species are good source of any kind of therapeutic activities due to presence of many active phytochemicals and high content of phenolics and flavonoids. Apart from this, various physical tests were performed for the authentic identification of the individual Decalepis species viz. DH, DN and DA leaves. Interestingly, result revealed variation of the parameters based on age of the plant, size of the leaves, and the collection of the sample. The present investigation provided the base line information to the future researchers working on Decalepis species for many other gray areas.
Funding
Walaa F. Alsanie would like to acknowledge Taif university for support No. TURSP (2020/53). Syed Mohammed Basheeruddin Asdaq wishes to express his gratitude to AlMaarefa University in Riyadh, Saudi Arabia, for providing support (TUMA-2021–1) to do this study.
Declaration of Competing Interest
The authors declare that they have no known competing financial interests or personal relationships that could have appeared to influence the work reported in this paper.
References
- Phytochemical screening, total polyphenol, flavonoid content, in vitro antioxidant and antibacterial activities of Sri Lankan varieties of Murraya koenigii and Micromelum minutum leaves. Heliyon.. 2021;7(7):e07449
- [CrossRef] [Google Scholar]
- Enhanced multiplication and improved ex vitro acclimatization of Decalepis arayalpathra. Biologia plantarum.. 2018;62(1):1-10.
- [CrossRef] [Google Scholar]
- Quantification of total phenol, flavonoid content and pharmacognostical evaluation including HPTLC fingerprinting for the standardization of Piper nigrum Linn fruits. Asian Pacific journal of Tropical Biomedicine.. 2015;5(2):101-107.
- [Google Scholar]
- Physico-chemical evaluation and biochemical quantification of crude drug powder (stem) of Chassalia curviflora (Wall. ex Kurz.) Thwaites; A folk medicinal plant. J. Pharmacog Phytochem.. 2014;3(4):121-124.
- [Google Scholar]
- Phytochemical screening and free radical scavenging activities of the fruits and leaves of Allanblackia floribunda Oliv (Guttiferae) Int J Health Res.. 2008;1:87-93.
- [Google Scholar]
- Determination of total phenolic and flavonoid content, antimicrobial and antioxidant activity of a root extract of Arisaema jacquemontii Blume. Journal of Taibah University of Science.. 2015;9(4):449-454.
- [Google Scholar]
- Rescue of endangered plants through biotechnological applications. Nat Aca Sci Lett.. 2008;31:201-210.
- [Google Scholar]
- Proximate analysis and antimicrobial activity of Eclipta alba (L.) Hassk: A traditionally used herb. International Journal of Pharmacy and Pharmaceutical Sciences.. 2013;5:149-154.
- [Google Scholar]
- Phytochemical Screening and Establishment of the Antidiabetic Potential of Aqueous Leaf Extract of the Endangered Plant Decalepis nervosa in Rats with Alloxan-induced Diabetes. Turk J Pharm Sci.. 2020;17(3):319-328.
- [Google Scholar]
- Comparative phytochemical screening, elemental content and chromatographic evaluation for detection and quantification of polyphenolic compounds for strong antioxidant activity of various extracts of Abutilon indicum sweet leaves.. 2019;8(1):36-44.
- In vitro bacteriostatic and bactericidal activities of Senna alata, Ricinus communis and Lannea barteri extracts against wound and skindisease causing bacteria. J Anal Pharm Res.. 2016;3(1):46.
- [Google Scholar]
- Solvent extraction effects on phytochemical constituents profiles, antioxidant and antimicrobial activities and functional group analysis of Ecballium elaterium seeds and peels fruits. Food Sci. Technol, Campinas.. 2017;37(3):483-492.
- [Google Scholar]
- Comparative biological analyses on kenger and kenger coffee as novel functional food products. Journal of Food Science and Technology.. 2021;1–11
- [CrossRef] [Google Scholar]
- Medicinal plants, conservation and livelihoods. Biodiv Cons.. 2004;13(8):1477-1517.
- [Google Scholar]
- Effect of solvents and extractors on proximate analysis, pharmacognostical screening and chromatographic analysis of Decalepis nervosa (Wight & Arn.) Venter leaf: An endangeredplant from Western Ghats region. Annals of. Phytomedicine.. 2019;8(2):64-74.
- [Google Scholar]
- Total phenolic contents and antioxidant activity of corn tassel extracts. Food Chem.. 2009;112(3):595-598.
- [Google Scholar]
- Perspectives of safety for natural health products. Herbal Drugs-A Twenty first Century Perspectives. 2006:50-59.
- [Google Scholar]
- Nagarajan, S., Jagan Mohan Rao, L., Gurudutt, K.N. 2001. Chemical composition of the volatiles of Decalepis hamiltonii (Wight & Arn). Flavour and Fragrance journal. 16(1), 27-29.
- Determination of 2-hydroxy-4- methoxybenzaldehyde in roots of Decalepis hamiltonii (Wight & Arn.) and Hemidesmus indicus R. Br. J AOAC Int.. 2003;86:564-567.
- [Google Scholar]
- Comparison of the impact ofdifferent extraction methods on polyphenols yields and tannins extracted from Moroccan Acacia mollissimabarks. Industrial Crops and Products.. 2015;70:245-252.
- [Google Scholar]
- Effect of Plant Maturity on the Proximate Composition of Sesamum Radiatum Schum Leaves. Journal of Food Studies.. 2012;1(1):69-76.
- [Google Scholar]
- Total safety management through standardization of formulated ayurvedic Kajal using Eclipta alba and Vernonia cinerea herbs. World Scientific news.. 2015;5:32-44.
- [Google Scholar]
- Antioxidant capacity of 26 spice extracts and characterization of their phenolic constituents. J Agric Food Chem.. 2005;53(20):7749-7759.
- [Google Scholar]
- An Overview on Decalepis: A Genus of Woody Medicinal Climbers. J Plant Sci Res.. 2014;1(1):1-14.
- [Google Scholar]
- Modulatory Effects of Decalepis hamiltonii Extract and Its Compounds on the Antioxidant Status of the Aging Rat Brain. J Pharm Bioallied Sci.. 2017;9(1):8-15.
- [CrossRef] [Google Scholar]
- Elemental and nutritional analysis of sea buckthorn (Hippophaer hamnoides ssp. Turkest anica) berries of Pakistani origin. J Med Food.. 2005;8(4):518-522.
- [Google Scholar]
- Physico-phytochemical analysis and their minimum inhibitory concentrations of various extracts of Decalepis hamiltonii Wight & Arn against gastrointestinal disorder pathogens. International journal of Pharmacy and Pharmaceutical Sciences.. 2012;4(3):289-292.
- [Google Scholar]
- Comparison of Different Solvents and Extraction Methods for Isolation of Phenolic Compounds from Horseradish Roots (Armoracia rusticana) World Academy Science Engineering Technology.. 2012;64:903-908.
- [Google Scholar]


