

Combining ability and heterosis for grain minerals, grain weight and yield in pearl millet and SSR markers based diversity of lines and testers
⁎Corresponding author. shrutiw1220@gmail.com (Shruti R. Warrier)
-
Received: ,
Accepted: ,
This article was originally published by Elsevier and was migrated to Scientific Scholar after the change of Publisher.
Peer review under responsibility of King Saud University.
Abstract
Pearl millet, a versatile and historic coarse grain crop, is stable food for millions of people in India and sub-Saharan Africa. As part of a key initiative to increase its grain mineral content, an investigation was carried out with line × tester analysis to generate information on magnitude of heterobeltiosis and standard heterosis, gene effects, combining ability effect of parents and hybrids for grain yield, grain weight and grain minerals (iron, zinc, copper and manganese). The partitioning of variance due to parental genotypes revealed that lines and testers significantly differed for studied traits. The per se performance of hybrids was higher than parents in desired directions for most of the characters suggesting the possibility of heterotic hybrids. The potence ratio was less than 1 for all traits except Fe. The analysis of variance for combining ability revealed importance of both additive and non-additive components of genetic variance. On the basis of per se performance and combining ability analysis cross ICMA 98444 × AIB 220 may be directly exposed for commercial cultivation and may be advanced for development of parental genotypes. During SSR marker based study, maximum PIC value was revealed by Xpsmp 2203 (PIC value = 0.92). Clustering analysis could group parental genotypes in three main clusters. The genetic distance among 15 genotypes ranged from 0.29 to 0.83. The genetic relationships identified among the male sterile/restorer lines may be useful in designing strategies to improve the genetic variation in the context of pearl millet breeding and to develop heterotic crosses.
Keywords
Combining ability
Heterosis
Minerals
Pearl millet
SSR markers

1 Introduction
Deficiency of one or more micronutrients causes micronutrient malnutrition or hidden hunger. Globally, the hidden hunger due to deficiency of dietary nutrients is currently afflicting nearly two-third of population (Kumar et al., 2018). Cereals are the primary source of micronutrients, energy and protein in the human diet. The human body needs nearly two dozen elements to maintain good health. For human being, many beneficial minerals like boron (B), cobalt (Co), copper (Cu), iron (Fe), manganese (Mn) and zinc (Zn) are essentially required in trace amount (Kumar et al., 2015). Among various minerals, iron and zinc are mainly deficient in human diets (Mahendrakar et al., 2019). The deficiency of minerals is a key diet-related crucial health problem in the third world’s populations due to restricted access to meat and horticultural produce (vegetables and fruits). Moreover, dependency on carbohydrate-rich cereal-based food make this problem more aggravates. The effects of malnutrition can be devastating, leading to mental retardation, weak health, poor productivity and reduced vitality (Kumar et al., 2016).
The problem of malnutrition may be alleviated by food diversification, supplementation and fortification, but these tactics are challenging both in scale and intensity (Bohra et al., 2016). A most effective and sustainable strategy to remedied hidden hunger with one time fixed cost is breeding based crop biofortification. The mineral requirements by human and plant are akin; hence biofortification will not only improve health of human but also farm productivity (Ma et al., 2007). Earlier reports in various crops displayed that biofortification is a cost-effective approach against hidden hunger, principally in Asian and African countries (Meenakshi et al., 2010).
Pearl millet (2n = 14) is C4 plant species with excellent photosynthetic efficiency and enormous genetic variability. Due to the cytoplasmic genetic male sterility system, heterozygous populations can easily be developed which can be exploited for the production of mineral-dense high grain yield hybrids. Pearl millet grain has higher protein (14.0%), carbohydrates (70%), fat (5.7%), fiber (2.0%) and ash (2.1%) content (Sade, 2009) and a good amino acid balance. The grain is not only higher in lysine, methionine and cytosine content but also contains tryptophan and threonine (Elyas et al., 2002). Pearl millet contains an appreciable mineral content within the normal ranges (Rao and Deosthale, 1983; Giri and Joshi, 2018). The grain Fe and Zn densities are quite higher in pearl millet than other major cereals (Dwivedi et al., 2012). Scanty information on grain copper and manganese revealed that pearl millet grain contains 2–10 ppm copper and 7–12 ppm manganese (Giri and Joshi, 2018). In pearl millet, variability for Fe and Zn has been recorded higher as some of the genotypes are full with >100 ppm Fe and >80 ppm Zn suggesting good prospects of genetic enhancement for minerals (Rai et al., 2012).
Evaluation of germplasm for combining ability and information on the extent of heterosis for characters are found prerequisites for any breeding program (Bhalodiya et al., 2019). Many studies have been conducted on genetics of seed iron and zinc densities and heterosis for these both minerals in pearl millet (Rai et al, 2012; Govindaraj et al., 2013; Kanatti et al., 2014), but no such reports are available for Cu and Mn. The use of diverse parents is significant for a fruitful breeding program. Molecular markers, especially simple sequence repeats (SSRs), emerged a striking alternative to the conventional diversity studies due to no interaction of the environment (Saiyad and Kumar, 2018). In the current experiment, the results on combining ability, nature of genetic variability, and heterosis for iron, copper, zinc and manganese content in grain along with grain weight and grain yield per plant (GYPP) has been generated using diverse parental line and their hybrids through line × tester trial. Moreover, molecular diversity in parents was also confirmed through SSR markers.
2 Materials and methods
2.1 Experimental materials
The plant material comprised of five CGMS lines and ten restorer pollinators (testers). The parental lines were crossed in line × tester mating design procedure as proposed by Kempthorne (1957) and reviewed by Dabholkar (1992). Hybrids were produced in summer 2015–16. Thus, 15 parents, 50 crosses and two checks (GHB 732 and GHB 558) formed the experimental material for the current study. List of parents used in crossing program with their pedigree is given in Table 1.
| Parental line | Parentage |
|---|---|
| Line | |
| JMSA 20102 | 81 A cytoplasm (A1) source backcrossed to JMSB 20102 |
| ICMA 05222 | 81 A cytoplasm (A1) source backcrossed to ICMB 05222 |
| ICMA 05333 | 81 A cytoplasm (A1) source backcrossed to ICMB 05333 |
| ICMA 07777 | 81 A cytoplasm (A1) source backcrossed to ICMB 07777 |
| ICMA 98444 | 81 A cytoplasm (A1) source backcrossed to ICMB 98444 |
| Tester | |
| J 2290 | ICP-429-S-4-2-1 |
| J 2571 | (MC94 C2-S1-3-2-2-2-1-3-B-B x ICMR 312 S1-3-2-3-2-1-1-B-B)-B-34-4-1 |
| J 2572 | {[((MC 94 S1-34-1-B × HHVBC)-16-2-1) × (IP 19626-4-2-3)]-B-28-2-2-3-1-2 × ICMR 312 S1-3-2-3-2-1-1-B-B-B-B}-B-4-1 |
| 103-SB-15 | RIB 3135/18 |
| 140-SB-15 | Selected from farmers field at SK Nagar Gujarat India during summer 2014 |
| 307-SB-15 | [(EEBC S1-407-1-B-B-B-B-B-1-B-5-1 × 3981-3989 G1)-2-1-1 × (ICMB04888 × ICMB 02333)-3-1-3-1]-1-7-1 |
| AIB 33 | 279SB × 273SB-2-1-4-2-3-B |
| AIB 216 | (J2290 x J 2423) × 273SB-2-1-2-4-2-B |
| AIB 220 | (ICMB 98222 × 279-SB)-2-1-2-3-2-B |
| AIB 221 | (ICMB 98222 × ICMB 94555)-1-1-2-3-2-B |
2.2 Field trial
A field trial was conducted during summer-2017 at Regional Research Station (RRS), AAU, Anand. The evaluation of 50 hybrids, 15 parents and two checks was carried out with three replications in a randomized complete block design (RCBD). Each entry was planted in one row of 4 m length with 60 × 15 (cm) inter- and intra-row spacing. Standard agronomic practices were followed during experiment.
Panicles were covered using glassine bag at the panicle emergence stage to avoid cross-pollination by foreign pollen and to harvest selfed seeds. Physiologically mature panicles were harvested, sun-dried followed by bulk threshing manually for production of grain samples for mineral analysis. The weight of 1000 randomly-selected grains from each entry in each replication was recorded to estimate the 1000-grain weight (TGW, g). Grain yield per plant (GYPP, g) was obtained from panicles of effective tillers of selected five plants and the average yield was worked out.
2.3 Grain mineral analysis
Sun-dried grains were adequately cleaned by removing dust particles, glumes and chaff of panicles. Sample for mineral analysis was prepared as per Kumar et al. (2016). Briefly, about 10 g cleaned and dried grains were finely powdered in cyclone mill (Udy Corporation, USA). One gram of the flour digested with 10 ml of concentrated nitric acid. The volume of the digested mixture was made to 50 ml using distilled water and was used to estimate grain mineral content (Fe, Zn, Cu and Mn) using Inductively Coupled Plasma Optical Emission Spectrometry (ICP OES) platform.
2.4 Diversity analysis of parental lines using SSR markers
The genomic DNA from each genotype was extracted using the CTAB method (Murray and Thompson, 1980) and was diluted to 10 ng/mL concentrations for SSR. For SSR profiling, markers from Xpsmp series were amplified through PCR reaction. The reaction mixture preparation and thermal conditions during PCR reaction for SSR markers were carried out as per Kumar et al. (2016). The amplified PCR products were separated using a 6% non-denaturing polyacrylamide gel. The gel was stained with silver nitrate (0.2%, W/V). The gel was scanned on a gel scanning system (Microtek). The allele size was calculated in base pairs by comparison to a 100 bp DNA ladder.
2.5 Statistical analyses
This analysis was used for obtaining estimates of general and specific combining ability variances and effects. The variances component of general combining ability (GCA) (σ2GCA) and specific combining ability (SCA) (σ2SCA) were calculated and used for estimation of the predictability ratio 2σ2GCA/(2σ2GCA + σ2SCA) (Baker, 1978). The standard heterosis (SH) and better-parent heterosis (heterobeltiosis-HB) were calculated as per Meredith and Bridge (1972) and Fonseca and Patterson (1968), respectively.
During genetic diversity assessment of parental lines, the number of alleles per locus, major allele frequency, gene diversity and polymorphism information content (PIC) was calculated with PowerMarker v.3.25 (Liu and Muse 2005). Neighbor-Joining (NJ) algorithm in DARwin 6.0 was used to calculate inter-genotype genetic distance.
3 Results and discussion
3.1 Genetic variability and genetic components
During analysis of variance (ANOVA), the mean square due to genotypes (MSg) were found highly significant for all the characters, indicating adequacy of genetic variability in studied plant material (Table 2). Further partitioning of MSg revealed the differences among parental genotypes for studied traits. The variance due to lines was significant for all the characters except Cu content. The variance due to testers was significant for all the characters which revealed the presence of satisfactory variability among lines and testers. The lines vs testers were significant for all the characters except for Fe and Cu content, which suggested that lines and testers are diverse for all traits except Fe and Cu density. Among hybrids, significant differences were detected for studied traits. The MS due to parents vs hybrids were significant for all the characters except Fe content, thereby suggesting differences between parents and hybrids, and the possibility of heterotic crosses. The MS due to checks vs hybrids were significant and advocated hybrids are differed from the checks for studied traits except Zn and Cu.
| Source of Variation | df | Mean Square | |||||
|---|---|---|---|---|---|---|---|
| Zn | Fe | Cu | Mn | TW | GYPP | ||
| Replications | 2 | 13.96** | 1.32 | 0.66** | 0.94 | 0.40** | 37.67* |
| Treatments | 66 | 92.51** | 360.21** | 1.38** | 50.39** | 15.25** | 338.17** |
| Parents | 14 | 54.11** | 214.98** | 0.29** | 39.32** | 19.52** | 489.56** |
| Lines | 4 | 46.25** | 146.50** | 0.19 | 4.72* | 11.79** | 49.83** |
| Testers | 9 | 55.19** | 267.64** | 0.37** | 51.73** | 20.26** | 280.44** |
| Line vs. Testers | 1 | 75.81** | 14.97 | 0.07 | 65.96** | 43.82** | 4130.51** |
| Crosses | 49 | 105.26** | 417.18** | 1.72** | 55.31** | 12.90** | 302.42** |
| Lines | 4 | 154.60 | 1777.83** | 2.29** | 92.06** | 3.49 | 260.55 |
| Testers | 9 | 66.62 | 501.81 | 2.49** | 36.30** | 40.22** | 345.06 |
| Lines × Testers | 36 | 109.43** | 244.84** | 1.46** | 55.98** | 7.11** | 296.41** |
| Parents vs. Crosses | 1 | 143.52** | 5.62 | 1.57* | 12.31** | 90.89** | 287.42** |
| Checks vs. Crosses | 1 | 5.48 | 284.03** | 1.44 | 44.83** | 2.24** | 246.45** |
| Between Checks | 1 | 35.04** | 38.76** | 0.07 | 3.15 | 4.50** | 57.66* |
| Error | 132 | 2.68 | 4.22 | 0.12 | 1.77 | 0.16 | 10.09 |
| Genetic components | |||||||
| σ2 GCA (lines) | 1.51 | 51.09** | 0.03* | 1.20* | −0.12 | −1.20 | |
| σ2 GCA (tester) | −2.85 | 17.13 | 0.07* | −1.318* | 2.20** | 3.24 | |
| σ2 GCA (Average) | 0.05 | 39.77** | 0.04** | 0.36** | 0.65** | 0.28 | |
| σ2 SCA | 35.51** | 80.03** | 0.45** | 17.97** | 2.34** | 95.30** | |
| Predictability ratio | 0.00 | 0.51 | 0.16 | 0.04 | 0.36 | 0.01 | |
| Potence ratio | 0.01 | 1.74 | 0.32 | 0.07 | 0.98 | 0.01 | |
| % contribution of σ2L$ | 11.99 | 34.78 | 10.86 | 13.58 | 2.20 | 7.03 | |
| % contribution of σ2T$ | 11.62 | 22.09 | 26.62 | 12.05 | 57.27 | 20.95 | |
| % contribution of σ2L × T$ | 76.38 | 43.12 | 62.51 | 74.35 | 40.51 | 72.01 | |
*, **, Significant at 0.05 and 0.01 levels of probability, respectively.
Highly significant σ2sca was found for Zn content and grain yield per plant (GYPP) showing the prime role of non-additive gene action. Earlier Chittora and Patel (2016) and Nandaniya et al. (2016b) reported the importance of non-additive gene action for GYPP. Both σ2sca and σ2gca were significant with higher estimates of σ2sca for Fe content, Cu content, Mn content and TGW, revealing importance of both the variances with preponderance of non-additive variance. Ansodariya et al. (2013) and Kathale et al. (2013) stated the importance of both additive and non-additive gene action for TGW. The potence ratio less than 1 for all traits except Fe and below one half value (0.5) of predictability ratio for all traits except Fe revealed role of non-additive genetic variance during inheritance. The predictability ratio also suggested dominance of non-additive genetic variance for iron and zinc content (Jeeterwal et al., 2017; Nandaniya et al., 2016a, 2016b).
3.2 Parental performance per se and combining ability
3.2.1 Iron density
Substantial variability was observed for Fe content among lines as it ranged from 35.27 ppm (ICMA 9844) to 53.52 ppm (JMSA 20102). Similarly, a high variability was also recorded among pollen parents. Male parent AIB 220 has minimum Fe (35.10 ppm) while it was maximum (63.45 ppm) in J 2290). High variability for grain Fe content has also been reported by Velu et al. (2007) and Govindaraj et al (2013). Merely, one line (ICMB 98444) had positively significant GCA. Five testers, out of 10, had highly significantly negative GCA while three testers had significantly positive GCA. Previously, GCA in both directions has also been recorded by Govindaraj et al (2013) this indicated that gene combinations in different lines are not similar.
3.2.2 Zinc density
Based on the mean performance (Table 3), the Zn density varied from 22.95 (ICMA 05333) to 33.18 (JMSA 20102) among the lines while in case of testers/pollen parents it was between 25.45 ppm (J 2290) and 36.67 ppm (140-SB-15). In earlier reports, substantial variability was detected for grain Zn, with Zn varying from 22 to 69 ppm (Rai et al., 2012; Kanatti et al., 2014). Of five, two female parents exhibited positively significant (p < 0.01) GCA, whereas significantly (p < 0.01) negative GCA was observed for three lines. The lines which demonstrated negatively significant GCA for Zn showed similarly significantly negative for Fe content also. This suggested that loading of Fe and Zn in grain is controlled by same genes or there may be tight linkage between genes controlling the variability for both Fe and Zn (Kanatti et al., 2014). Similarly, three out of 10 testers, showed positively significant GCA and significantly negative GCA was observed for five testers.
| Parent | Zn | Fe | Cu | Mn | TGW | GYPP | ||||||
|---|---|---|---|---|---|---|---|---|---|---|---|---|
| Mean (ppm) | GCA | Mean (ppm) | GCA | Mean (ppm) | GCA | Mean (ppm) | GCA | Mean (g) | GCA | Mean (g) | GCA | |
| Lines | ||||||||||||
| JMSA 20102 | 33.18 | 3.53** | 53.52 | 0.41 | 3.19 | −0.20** | 13.52 | 1.21** | 4.40 | 0.50** | 21.87 | 0.70 |
| ICMA 05222 | 24.33 | −0.98** | 50.35 | −8.73** | 4.08 | 0.08 | 14.31 | 1.73** | 8.73 | −0.11* | 23.80 | 1.68** |
| ICMA 05333 | 22.95 | −2.10** | 48.40 | −1.87** | 4.47 | −0.05 | 14.28 | 0.60 | 6.80 | 0.01 | 17.73 | −4.63** |
| ICMA 07777 | 27.48 | −1.36** | 45.50 | −2.14** | 3.99 | 0.43** | 15.95 | −1.04** | 3.80 | −0.44** | 21.67 | −0.80 |
| ICMA 98444 | 27.20 | 0.92** | 35.27 | 12.34** | 3.75 | −0.25** | 16.50 | −2.51** | 5.40 | 0.04 | 28.93 | 3.03** |
| Tester | ||||||||||||
| J 2290 | 25.45 | 1.20** | 63.45 | −6.75** | 4.41 | −0.03 | 17.01 | −1.076** | 10.53 | 2.55** | 35.53 | 2.31** |
| J 2571 | 32.80 | −0.58 | 42.32 | 9.93** | 4.58 | −0.73** | 18.80 | −0.75 | 11.93 | −0.40** | 57.40 | 3.72** |
| J 2572 | 27.67 | 0.01 | 44.17 | −7.21** | 4.05 | 0.42** | 15.35 | −1.04** | 6.20 | −1.06** | 36.40 | −4.67** |
| 103 - SB - 15 | 35.68 | −1.71** | 55.05 | −0.78 | 4.35 | 0.72** | 15.45 | 2.85** | 8.33 | 0.43** | 39.07 | 6.86** |
| 140 - SB - 15 | 36.67 | −1.29** | 47.08 | 5.26** | 3.81 | −0.32** | 16.03 | −0.84* | 8.60 | 0.37** | 24.53 | 1.08 |
| 307 - SB - 15 | 26.55 | −1.44** | 43.42 | 7.62** | 4.11 | −0.21* | 22.93 | −0.86* | 10.33 | 2.90** | 46.00 | −5.47** |
| AIB 33 | 26.77 | 1.00* | 61.98 | −1.09 | 2.96 | 0.022 | 26.41 | 0.13 | 5.00 | −1.87** | 50.67 | −4.05** |
| AIB 216 | 26.93 | −1.20** | 38.97 | −2.75** | 3.78 | 0.24** | 13.00 | 2.36** | 5.27 | −1.00** | 49.47 | −4.37** |
| AIB 220 | 26.32 | −1.21** | 35.10 | −1.62** | 4.25 | −0.17* | 14.38 | 0.94 | 8.60 | −0.18** | 51.07 | 6.84** |
| AIB 221 | 33.17 | 5.24** | 46.78 | −2.61** | 4.76 | 0.06 | 15.43 | −1.69** | 4.40 | −1.72** | 41.10 | −2.24** |
*, ** Significant at 0.05 and 0.01 levels of probability, respectively.
3.2.3 Copper density
The density of grain Cu ranged from 3.19 (ICMA 98444) to 4.47 ppm (ICMA 05333) among the female parents and from 3.78 (AIB 226) to 4.76 (AIB 221) ppm among the male parents. Significantly negative GCA was observed in two lines and while only one line (ICMA 07777) had significantly positive GCA for Cu. Highly positive and significant GCA was recorded for three testers. Similarly, four testers had significant and negative GCA.
3.2.4 Manganese density
The Mn density in lines varied between 13.52 (JMSA 20102) to 16.50 ppm (ICMA 98444). The variability was more in testers as Mn content which ranged from 13.00 (AIB 216) to 26.41 ppm (AIB 33). Two lines and two testers showed positively significant GCA while it was negative and significant for two lines and five testers.
3.2.5 1000-grain weight (TGW)
High variability was observed for TGW in both lines and testers. TGW in lines ranged 3.80–8.73 g (ICMA 07777 vs. ICMA 05222) and it ranged 4.40–11.93 g (AIB 221 vs J 2571) in testers indicating more variability in testers for TGW. A highly significant difference among the parental lines (P) for 1000-grain weight was also recorded by Kanatti et al. (2014). Both significantly negative and positive GCA effects were detected in both lines and testers. Highly significant and negative GCA was observed for six testers and two lines. Four testers and merely one line (JMSA 20102) exhibited highly significant and positive GCA.
3.2.6 Grain yield per plant (GYPP)
The mean GYPP among females was between 17.73 g (ICMA 05333) and 28.93 g (ICMA 98444). Likewise, high GYPP variation among pollen parents was recorded, which was maximum in J 2571 (57.40 g) and minimum in 140-SB-15 (24.53 g). Positively significant GCA was exhibited by two lines and four testers, whereas one line and five testers had negative and highly significant GCA. Parents with high positive GCA for grain yield could be used for developing superior hybrids or to develop a base population. This base population may be further improved following recurrent selection for GCA (Yadav et al., 2005).
3.3 Heterosis and combining ability
3.3.1 Iron density
Iron content among the hybrids ranged from 32.88 ppm (ICMA 05222 × AIB 33) to 94 ppm (ICMA 98444 × J 2571) (Table 4). Check hybrid GHB 732 had higher Fe (43.35 ppm) content compared to check hybrid GHB 558 (38.27 ppm). Significant heterobeltiosis was displayed by 37 hybrids of which 10 hybrids showed positive estimates and 27 crosses demonstrated high negative estimates, thereby magnitude of heterobeltiosis was negative. Out of 35 significant crosses, 21 had significant and positive estimates of SH. Magnitude of SH was recorded modest by Nandaniya et al., 2016a, 2016b which may be due to use of different germaplsm during study. Top-ranking three crosses had 66.47 to 94.0 ppm Fe density. The Fe content in the parents of these hybrids reigned from 26.77 to 33.18 ppm. Except AIB 33, all parents had positive and highly significant (p < 0.01) GCA. A total of 19 hybrids exhibited significantly positive SCA effect. Hybrid ICMA 98444 × J 2571 depicted the highest SCA effect (23.90).
| Performance per se | SCA | HB | SH | |||||
|---|---|---|---|---|---|---|---|---|
| Trait | Hybrid# (P1 × P2) |
F1 (Hybrid) | P1 (Line) | P2 (Tester) | GHB 732 | GHB 558 | ||
| Zinc (Zn; ppm) | JMSA 20102 (G) × AIB 221 (G) | 57.22 | 33.18 | 33.17 | 21.59** | 72.45** | 102.24** | 143.89** |
| JMSA 20102 (G) × AIB 33 (G) | 35.62 | 33.18 | 26.77 | 4.23** | 7.35 | 25.91** | 51.85** | |
| ICMA 98444 (G) × J 2571 (A) | 34.57 | 27.20 | 32.80 | 7.36** | 5.40 | 22.14** | 47.30** | |
| Iron (Fe, ppm) | ICMA 98444 (G) × J 2571 (G) | 94.00 | 35.27 | 42.32 | 23.90** | 122.12** | 116.67** | 145.52** |
| ICMA 98444 (G) × 307 - SB - 15 (G) | 77.58 | 35.27 | 43.42 | 9.78** | 78.67** | 78.80** | 102.61** | |
| ICMA 98444 (G) × AIB 33 (A) | 66.47 | 35.27 | 61.98 | 7.36** | 7.24* | 53.15** | 73.54** | |
| Copper (Cu, ppm) | ICMA 07777 x 103 - SB - 15 | 6.90 | 3.95 | 4.23 | 1.37** | 63.12** | 83.18** | 73.22** |
| ICMA 07777 × AIB - 216 | 6.63 | 3.95 | 3.78 | 1.58** | 67.93** | 76.10** | 66.52** | |
| ICMA 05222 × J 2572 | 6.10 | 4.27 | 4.05 | 1.21** | 42.85** | 61.94** | 53.13 | |
| Manganese (Mn, ppm) | ICMA 05222 × AIB - 220 | 27.65 | 14.32 | 14.38 | 8.94** | 92.24** | 120.90** | 97.97** |
| JMSA 20102 × AIB - 216 | 27.45 | 13.51 | 13.00 | 7.84** | 103.08** | 119.30** | 96.53** | |
| ICMA 05222 × AIB - 216 | 25.35 | 14.32 | 13.00 | 5.22** | 77.07* | 102.53** | 81.50** | |
| 1000-grain weight (TW; g) | ICMA 05333 (A) × J 2290 (G) | 15.20 | 6.80 | 10.53 | 3.78** | 44.30** | 47.10** | 76.74** |
| JMSA 20102 (G) × 307 - SB - 15 (G) | 13.47 | 4.40 | 10.33 | 1.21** | 30.32** | 30.32** | 56.59** | |
| ICMA 05333 (A) × 140 - SB - 15 (G) | 12.33 | 6.80 | 8.60 | 3.10** | 43.37** | 19.35** | 43.41** | |
| Grain yield per plant (GYPP; g) | ICMA 98444 (G) × AIB 220 (G) | 63.8 | 21.27 | 51.07 | 14.68** | 24.93** | 40.88** | 42.88** |
| ICMA 05222 (G) × J 2571 (G) | 56.33 | 18.80 | 57.40 | 11.68** | −1.86 | 15.28** | 32.03** | |
| ICMA 05222 (G) × 103-SB-15 (G) | 56.26 | 18.76 | 39.07 | 8.48** | 44.02** | 15.14** | 31.88** | |
*, ** Significant at 0.05 and 0.01 levels of probability, respectively;
3.3.2 Zinc density
Zinc content in among the hybrids ranged from 15.02 ppm (ICMA 05333 × 307-SB-15) to 57.22 ppm (JMSA 20102 × AIB 221) (Table 4). Iron content in among the hybrids ranged from 32.88 ppm (ICMA 05222 × AIB 33) to 94 ppm (ICMA 98444 × J 2571). Check hybrid GHB 732 had higher Zn (28.28 ppm) compared to check hybrid GHB 558 (23.45 ppm). A total of 34 F1s presented significant heterobeltiosis; of these 34, only six hybrids had positive and significant HB, therefore magnitude of HB was in negative direction. Out of 30 significant crosses, only seven had positively significant SH. The magnitude of HB and SH is in accordance with Kapadia et al., 2016; Nandaniya et al., 2016a, 2016b. The zinc content in top-ranking three crosses was between 34.57 and 57.22 ppm though Zn content in parental lines of these hybrids was falling between 26.77 and 33.18 ppm. The GCA of parents except J 2571 was highly significant (p < 0.01) and positive. Significantly positive estimates of SCA effect was recorded in 14 hybrids. Hybrid from JMSA 20102 × AIB 221 showed the maximum SCA effect (21.59).
3.3.3 Copper density
Among the hybrids, hybrid JMSA 20102 × J 2571 had highest Cu density (2.78 g) whereas least Cu density was observed in ICMA 07777 × 103-SB-15 (6.9 g) (Table 4). The grains of check GHB 558 (3.98 g) had higher Cu than GHB 732 (3.76 g). The grain Cu content in hybrids (4.37 g) was higher than the parents (4.19 g). The comparisons of parents and hybrids revealed the opportunity for heterotic crosses. The study indicated that the HB was more inclined towards negative direction and HB estimates were moderate to high in positive direction. With nine positive estimates for HB, a total of 18 hybrids portrayed significant heterotic effect. In case of SH, out of 16 significant hybrids, 15 exhibited positive SH over better check (GHB 558). Top-ranking three had 6.10–6.90 ppm Cu. The Cu content in parental lines of these hybrids ranged from 3.78 to 4.27 ppm. Except ICMA 05222, all parents had highly significant (p < 0.01) and positive GCA. Total 16 hybrids had significant estimates of SCA effect in positive direction. Cross ICMA 07777 × AIB 216 (1.58) represented the uppermost SCA effect.
3.3.4 Manganese density
Based on the mean performance, the Mn content varied from 10.68 (ICMA 98444 × AIB 216) to 27.65 (ICMA 05222 × AIB 220) (Table 4). The density of grain Mn was higher in check GHB 558 (13.96 g) compared to GHB 732 (12.52 g). The estimates of HB were low in negative direction and high in positive direction. A set of 38 hybrids depicted significant heterotic effect, of them 11 had positive HB. In case of SH, of 19 significant hybrids, 16 exhibited positive SH over GHB 558. Estimates of SH were low to moderate in negative direction and high in positive direction thus magnitude of HB and SH were positive. Top-ranking three had 25.35 to 27.65 ppm of Mn in grain. The grain Mn content in parents of top-ranking hybrids was oscillated between 13.0 and 14.38 ppm. Excluding AIB – 220, GCA effect of all parents was highly significant (p < 0.01) and positive GCA. Total 14 hybrids illustrated significant estimates of SCA effect in desired direction. Cross ICMA 05222 × AIB 220 (8.94) depicted the highest SCA effect.
3.3.5 1000-grain weight (TGW)
TGW among the hybrids ranged from 5.43 g (ICMA 07777 × AIB 33) to 15.20 g (ICMA 05333 × J 2290) (Table 4). The TGW of check GHB 732 (10.33 g) was more than GHB 558 (8.60 g). The analysis of mean performance for TGW specified that performance of hybrids (8.84 g) was better compared to parental lines (7.2 g). A total of 39 crosses had significant HB, of which 26 exhibited positive estimates. HB estimates were high in positive direction; thereby magnitude of HB was positive. Among 47 significant hybrids, 39 showed significant and negative estimates of SH. The extent of SH was moderate to high in both the directions, however mean (−14.43) SH was negative indicated negative magnitude of SH. The results are in agreement with Patel (2012) who also recorded moderate to high in both the directions. Top-ranking three hybrids had 12.33–15.20 g TGW. All the parental lines of these hybrids had 4.40–10.53 g TGW. Except ICMA 05333, all parents had highly significant (p < 0.01) and positive GCA. Total 20 hybrids depicted significant estimates of SCA effect in positive direction. Cross ICMA 05333 × J 2290 (3.78) depicted the highest SCA effect.
3.3.6 Grain yield per plant (GYPP)
Among the hybrids, hybrid ICMA 98444 × AIB 220 (63.80 g) yielded the maximum GYPP whereas poor performer hybrid was ICMA 05333 × 307-SB-15 (23.33 g) (Table 4). The check hybrid GHB 732 performed better than GHB 558 (48.87 g vs. 42.67 g). Mean performance for GYPP of all the genotypes indicated that hybrids (39.23 g) had high GYPP compared to parents (36.35 g) and indicated possibility of heterotic cross. With 12 positive estimates, a set of 38 hybrids depicted significant heterotic effect. Of 36 significant hybrids, only four exhibited significant and positive SH over GHB 732. The magnitude of HB and SH were mainly negative for GYPP. This result is in agreement with earlier reports (Vagadiya et al., 2010; Patel, 2014; Chittora and Patel, 2017) Top-ranking three had 56.26–63.8 g GYP. All the parental lines of these hybrids had 18.76–57.40 g GYPP. Of six, five exhibited had highly significant (p < 0.01) and positive GCA while ICMA 05222 had significantly negative GCA. Out of the 50 hybrids, 17 had significant and positive estimates of SCA effect. The hybrid ICMA 98444 × AIB 220 (14.68) exhibited the maximum SCA estimate.
3.4 Genetic diversity of parents
The variability is key for crop improvement which can be exploited through heterosis breeding. Due to ease and independent to genotypes by environment interaction, molecular markers emerged as striking alternative to conventional variability evaluation. In the current study, initially, a set of 17 SSR primers were screened to identify polymorphic primer. Out of 17, 12 (70.58%) primers were polymorphic and were exploited to investigate the genetic diversity of 15 pearl millet genotypes. The amplicon size ranged from 177 to 500 bp. A total of 148 alleles were detected among 15 genotypes and allele per locus was 12, with a range of 2–18 (Table 5). The allele per locus in the current research was comparable to Gupta et al. (2015) and was more than Kapila et al. (2008), Singh et al. (2013), Sangwan et al. (2015) and Nehra et al. (2017) who reported 6.25, 3.0, 10.5, 3.72 alleles per loci, respectively.
| Marker | Primer sequence (Forward/Reverse) 5′→3′ |
Amplicon size (bp) | Major allele frequency | Gene diversity | PIC |
|---|---|---|---|---|---|
| Xpsmp 2085 | GCACATCATCTCTATAGTATGCAG/ GCATCCGTCATCAGGAAATAA |
177–204 | 0.167 | 0.889 | 0.879 |
| Xpsmp 2203 | GAACTTGATGAGTGCCACTAGC/ TTGTGTAGGGAGCAACCTTGA |
390–500 | 0.167 | 0.924 | 0.920 |
| Xpsmp 2204 | GAACTTGATGAGTGCCACTAGC/ TTGTGTAGGGAGCAACCTTGAT |
390–500 | 0.167 | 0.918 | 0.912 |
| Xpsmp 2206 | AGAAGAAGAGGGGGTAAGAAGGAG/ AGCAACATCCGTAGAGGTAGAAG |
192–240 | 0.167 | 0.907 | 0.899 |
| Xpsmp 2219 | ACTGATGGAATCTGCTGTGGAA/ GCCCGAAGAAAAGAGAACATAGAA |
300–332 | 0.167 | 0.893 | 0.884 |
| Xpsmp 2027 | AGCAATCCGATAACAAGGAC/ AGCTTTGGAAAAGGTGATCC |
187–240 | 0.133 | 0.913 | 0.907 |
| Xpsmp 2231 | TTGCCTGAAGACGTGCAATCGTCC/ CTTAATGCGTCTAGAGAGTTAAGTTG |
250–300 | 0.200 | 0.893 | 0.885 |
| Xpsmp 2043 | TCATATTCTCCTGTCTAAAACGTC/ ACAAATCGTACAAGTTCCACTC |
190–230 | 0.200 | 0.882 | 0.871 |
| Xpsmp 2225 | CCGTACTGATGATACTGATGGTT/ TGGGAGGTAAGCTCAGTAGTGT |
210–260 | 0.167 | 0.911 | 0.905 |
| Xpsmp 2070 | ACAGAAAAAGAGAGGCACAGGAGA/ GCCACTCGATGGAAATGTGAAA |
206–240 | 0.133 | 0.916 | 0.909 |
| Xpsmp 2233 | TGTTTTCTCCTCTTAGGCTTCGTTC/ ACCTTCTCCGCCACTAAACAACT |
270–290 | 0.500 | 0.500 | 0.375 |
| Xpsmp 2074 | AGGACTGTAGGAGTGTGGACAA/ CCAGACCTACCAGTGAATGAGA |
280–295 | 0.500 | 0.500 | 0.375 |
| Mean | – | 0.222 | 0.837 | 0.810 | |
The major allelic frequency ranged from 0.13 to 0.50. With a man of 0.81, the marker PIC ranged from 0.38 to 0.92 (Xpsmp 2203) in this study. The result also indicated that Xpsmp 2203 is more informative than other markers. The PIC of this study were noticeably greater than Ramya et al (2018) (>0.53) and Nehra et al. (2017) (0.51). Higher PIC in this study could be ascribed due to high genotypic diversity of lines and testers.
The Nei’s (1973) genetic distance among 15 genotypes ranged from 0.29 to 0.83 (Table 6). During grouping of parents using Nei’s (1973) genetic distance, 15 genotypes were allocated into three main clusters I, II and III (Fig. 1). Clustering pattern suggested a clear grouping of restorers/testers indicating substantial diversity between lines and testers. Partitioning of lines and testers in groups also suggested that with line and testers, genetic diversity exists and the same was also reflected through heterosis for different studied traits. The results also indicated that two diverse and broad-genetic based pools were used in the current investigation. This information may be used to create new diverse and highly productive hybrid through heterosis breeding.
| Genotype | J2290 | J2571 | J2572 | 103-SB-15 | 140-SB-15 | 307-SB-15 | AIB33 | AIB220 | AIB221 | AIB216 | ICMA98444 | JMSA20102 | ICMA7777 | ICMA5222 |
|---|---|---|---|---|---|---|---|---|---|---|---|---|---|---|
| J2571 | 0.63 | |||||||||||||
| J2572 | 0.71 | 0.71 | ||||||||||||
| 103-SB-15 | 0.71 | 0.67 | 0.63 | |||||||||||
| 140-SB-15 | 0.67 | 0.75 | 0.67 | 0.63 | ||||||||||
| 307-SB-15 | 0.75 | 0.67 | 0.75 | 0.67 | 0.67 | |||||||||
| AIB33 | 0.83 | 0.79 | 0.75 | 0.67 | 0.83 | 0.67 | ||||||||
| AIB220 | 0.71 | 0.75 | 0.63 | 0.71 | 0.71 | 0.79 | 0.71 | |||||||
| AIB221 | 0.75 | 0.79 | 0.63 | 0.58 | 0.75 | 0.75 | 0.67 | 0.29 | ||||||
| AIB216 | 0.63 | 0.75 | 0.67 | 0.67 | 0.71 | 0.75 | 0.79 | 0.38 | 0.29 | |||||
| ICMA98444 | 0.71 | 0.67 | 0.79 | 0.67 | 0.75 | 0.75 | 0.75 | 0.83 | 0.75 | 0.75 | ||||
| JMSA20102 | 0.75 | 0.75 | 0.83 | 0.67 | 0.71 | 0.71 | 0.79 | 0.83 | 0.75 | 0.79 | 0.67 | |||
| ICMA7777 | 0.75 | 0.83 | 0.79 | 0.71 | 0.79 | 0.75 | 0.75 | 0.83 | 0.79 | 0.83 | 0.67 | 0.71 | ||
| ICMA5222 | 0.79 | 0.79 | 0.75 | 0.67 | 0.79 | 0.75 | 0.75 | 0.79 | 0.75 | 0.83 | 0.71 | 0.83 | 0.54 | |
| ICMA05333 | 0.71 | 0.79 | 0.79 | 0.75 | 0.83 | 0.71 | 0.79 | 0.79 | 0.79 | 0.75 | 0.71 | 0.79 | 0.67 | 0.75 |
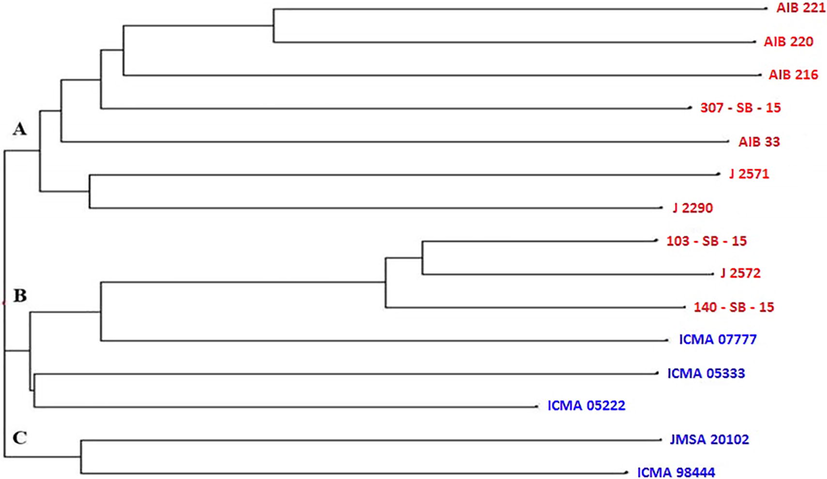
- SSR marker based dendrogram showing clustering of 15 pearl millet genotypes.
4 Conclusion
The results of current study indicated the preponderance of non-additive type of gene effects along with high heterosis and existence of superior crosses with high SCA effects. The material used in current study may be best exploited through hybrid breeding program. Highly diverse parental lines can be exploited to develop bi-parental mapping population to identify the QTL responsible for mineral accumulation in grains.
5 Authors’ contributions
All authors contributed equally to the planning and execution of the research.
Acknowledgement
Authors acknowledge Anand Agricultural University, Gujarat, India for providing facilities to conduct experiment.
Declaration of Competing Interest
The authors declare that they have no known competing financial interests or personal relationships that could have appeared to influence the work reported in this paper.
References
- Combining ability analysis of grain yield and its component characters in pearl millet [Pennisetum glaucum (L.) R. Br.] Prog. Res.. 2013;8(Special):564-567.
- [Google Scholar]
- Line x tester analysis for seed yield, protein and oil content and SSR based diversity in sesame (Sesamum indicum L.) Ecol. Genetics Genomics. 2019;13:100048
- [Google Scholar]
- Enriching nutrient density in staple crops using modern“-Omics”tools. In: Singh U., Praharaj C.S., Singh S.S., Singh N.P., eds. Biofortification of Food Crops. India: Springer; 2016. p. :85-104.
- [Google Scholar]
- Combining ability analysis for seed yield and yield component characters in pearl millet [Pennisetum glaucum (L.) R. Br.] Bioscan. 2016;11(4):3161-3165.
- [Google Scholar]
- Estimation of heterosis for grain yield and yield components in pearl millet [Pennisetum glaucum (L.) R. Br.] Int. J. Microbiol. Appl. Sci.. 2017;6(3):412-418.
- [Google Scholar]
- Elements of Biometrical Genetics. New Delhi, India: Concept Publishing Company; 1992.
- Effect of natural fermentation on nutritive value and in vitro protein digestibility of pearl millet. Food Chem.. 2002;78(1):75-79.
- [Google Scholar]
- Hybrid vigour in a seven parent diallel cross in common wheat. Crop Sci.. 1968;8:858-888.
- [Google Scholar]
- Effect of hydrothermal treatments on mineral composition, bio accessibility and total polyphenols of pearl millet (Pennisetum glaucum) J. Pharmacogn. Phytochem.. 2018;7(6):442-448.
- [Google Scholar]
- Combining ability and heterosis for grain iron and zinc densities in pearl millet. Crop Sci.. 2013;53:507-517.
- [Google Scholar]
- Patterns of molecular diversity in current and previously developed hybrid parents of pearl millet [Pennisetum glaucum (L.) R. Br.] Am. J. Plant Sci.. 2015;6:1697-1712.
- [Google Scholar]
- Combining ability studies through diallel analysis in pearl millet [Pennisetum glaucum (L.) R. Br.] under varying environmental conditions. J. Pharmacogn. Phytochem.. 2017;6(4):1083-1088.
- [Google Scholar]
- Grain iron and zinc density in pearl millet: Combining ability, heterosis and association with grain yield and size. Springer Plus. 2014;2014(3):763.
- [Google Scholar]
- Estimation of heterosis for yield and its relevant traits in forage pearl millet [Pennisetum glaucum (L) R. Br.] Int. J. Agri. Sci.. 2016;8(54):2829-2835.
- [Google Scholar]
- Genetic diversity among pearl millet maintainers using microsatellite markers. Plant Breed.. 2008;127:33-37.
- [Google Scholar]
- Kempthorne, O., 1957, An Introduction to Genetic Statistics, John Wiley & Sons Inc., New York: Chapman and Hall, London.
- Mapping quantitative trait loci controlling high iron and zinc content in self and open pollinated grains of pearl millet [Pennisetum glaucum (L.) R. Br.] Front. Plant Sci.. 2016;7:1636.
- [Google Scholar]
- Mapping grain iron and zinc content quantitative trait loci in an iniadi-derived immortal population of pearl millet. Genes. 2018;9(5):248.
- [Google Scholar]
- Biofortification for selecting and developing crop cultivars denser in iron and zinc. In: Rakshit A., Singh H.B., Sen S., eds. Nutrient Use Efficiency: from Basics to Advances. New Delhi: Springer; 2015. p. :237-253.
- [Google Scholar]
- PowerMarker: integrated analysis environment for genetic markers data. Bioinformatics. 2005;2:2128-2129.
- [Google Scholar]
- Iron and zinc deficiencies in China: what is a feasible and cost-effective strategy? Plant Health Nutrition. 2007;11(6):632-638.
- [Google Scholar]
- Genetic variability, genotype × environment interaction and correlation analysis for grain iron and zinc contents in recombinant inbred line population of pearl millet [Pennisetum glaucum (L). R. Br.] Ind. J. Genet. Plant Breed.. 2019;79(3):545-551.
- [Google Scholar]
- How cost-effective is biofortification in combating micronutrient malnutrition? An ex ante assessment. World Dev.. 2010;38:64-75.
- [Google Scholar]
- Rapid isolation of high molecular weight plant DNA. Nucleic Acids Res.. 1980;8:4321-4326.
- [Google Scholar]
- Assessment of combining ability for yield and micronutrients in pearl millet. Electron. J. Plant Breed.. 2016;7(4):1084-1088.
- [Google Scholar]
- Estimation of heterosis in pearl millet [Pennisetum glaucum (L.) R. Br.] for yield and quality traits. Electron. J. Plant Breed.. 2016;7(3):758-760.
- [Google Scholar]
- Molecular characterization of pearl millet [Pennisetum glaucum (L.) R. Br.] inbreds using microsatellite markers. J. Appl. Nat. Sci.. 2017;9(1):357-363.
- [Google Scholar]
- Analysis of gene diversity in subdivided populations. Proc. Natl. Acad. Sci., USA. 1973;70:3321-3328.
- [Google Scholar]
- Patel, S. M., 2012. Genetic analysis of grain yield and its component characters in pearl millet (Pennisetum glaucum (L.) R. Br.). M. Sc. (Agri.) thesis submitted to Anand Agricultural University, Anand.
- Patel, T.K., 2014. Studies on heterotic effects, gene effects and stability parameters for grain yield, its components and quality characters in pearl millet [Pennisetum glaucum (L.) R. Br.]. Ph.D. thesis submitted to Anand Agricultural University, Anand.
- Genetic enhancement of grain iron and zinc content in pearl millet. Qual. Assur. Safety Crops Foods. 2012;4(3):119-125.
- [Google Scholar]
- Towards defining heterotic gene pools in pearl millet [Pennisetum glaucum (L.) R. Br.] Front. Plant Sci.. 2018;8:1934.
- [Google Scholar]
- Mineral composition, ionisable iron and soluble zine in malted grains of pearl millet and ragi. Food Chem.. 1983;11(3):217-223.
- [Google Scholar]
- Proximate, anti-nutritional factors and functional properties of processed pearl millet (Pennisetum glaucum) J. Food Technol.. 2009;17(3):92-97.
- [Google Scholar]
- Genetic diversity in pearl millet inbred lines using SSR markers. J. Biotechnol. Biomater.. 2015;5(6):273-286.
- [Google Scholar]
- Evaluation of maize genotypes for fodder quality traits and SSR diversity. J. Plant Biochem. Biotechnol.. 2018;27:78-89.
- [Google Scholar]
- Assessment of genetic diversity among pearl millet [Pennisetum glaucum (L.) R. Br.] cultivars using SSR markers. Range Manage. Agrofor.. 2013;34(1):77-81.
- [Google Scholar]
- Studies on heterosis in pearl millet. [Pennisetum glaucum (L.) R. Br.] Agri. Sci. Digest. 2010;30(3):197-201.
- [Google Scholar]
- Prospects of breeding bio-fortified pearl millet with high grain iron and zinc content. Plant Breed. 2007;126:182-185.
- [Google Scholar]
- Genetics of yield and its component characters in Indian mustard [Brassica juncea (L.) Czern and Coss.] under rainfed conditions. J. Oilseed Res.. 2005;22:255-258.
- [Google Scholar]


