

Translate this page into:
Characterization and analysis of trace elements of facial beauty powders collected from Saudi markets
⁎Corresponding author. suakhtar@iau.edu.sa (Sultan Akhtar),
-
Received: ,
Accepted: ,
This article was originally published by Elsevier and was migrated to Scientific Scholar after the change of Publisher.
Abstract
The branded cosmetics exhibited both sheets and nanoparticles.

Abstract
Analysis of the facial powders is conducted. Electron microscopy analyses reveal the sheet-like morphology of the cosmetics. The branded specimens contained crystalline NPs along with sheets. The content level of eighteen trace elements is determined by ICPOES. The contents of Li, Ca, Fe, Mg, Al, Zn and Pb are the highest.
Abstract
Cosmetic is an enriching source of potentially toxic trace elements due to the use of different chemicals and preservatives during their preparation. The present study presents the structural, morphological, and quantitative analyses of eighteen trace elements in six (n = 6) imported/locally manufactured facial powders using electron microscopy tools (SEM/EDX/TEM), Fourier infrared spectroscopy (FTIR) and inductivity coupled plasma-optical emission spectrophotometry (ICP-OES). SEM/EDX/TEM analyses reveal the sheet-like morphology of the cosmetic products with varying sizes, shapes, and thicknesses. The branded specimens displayed the nano-sized crystalline nanoparticles along with sheets, either deposited on sheets or present in the dispersion. The size of the particles was estimated between 5 and 300 nm. The average contents of the eighteen trace elements determined by ICP-OES are (in µg/g): 7739.43 (Li), 1015.30 (Ca), 514.18 (Fe), 226.61 (Mg), 201.10 (Al), 133.25 (Zn), 83.50 (Na), 11.82 (Mn), 9.05 (K), 1.85 (Ba), 4.96 (Cr), 0.57 (Cu), 0.29 (Pb), 0.10 (Sb), 0.08 (Se), 0.03 (Cd), 0.01 (As) and 0 (Ni). The branded samples showed the lowest fractions, while the locally manufactured specimens exhibited higher contents of potentially toxic trace elements. The metal contents of Li, Ca, Fe, Mg, Al, Zn, and Pb were the highest whereas the K, Mn, and Cr contents were <100 µg/g, and Ni was not found in any tested specimen. The findings of this study could provide awareness to the consumers to ensure the minimum exposure of nanoparticles/agglomerates and safe use of body-care products.
Keywords
Cosmetics
Morphology
Contents
Nanoparticles
Nanotoxicology

- SEM
-
Scanning electron microscopy
- EDX
-
Energy dispersive X-rays spectroscopy
- TEM
-
Transmission electron microscopy
- SAED
-
selected area electron diffraction
- ICP-OES
-
Inductively coupled plasma-optical emission spectrometry
- (ICP-MS)
-
Inductively coupled plasma mass spectrometry
- FTIR
-
Fourier transform infrared spectroscopy
- HF
-
Hydrofluoric acid
- HNO3
-
Nitric acid
- H3BO3
-
Boric acid
- Li
-
lithium
- Ca
-
calcium
- Fe
-
iron
- Mg
-
magnesium
- Al
-
aluminum
- Zn
-
zinc
- Na
-
sodium
- Mn
-
manganese
- K
-
potassium
- Ba
-
barium
- Cr
-
chromium
- Cu
-
copper
- Pb
-
Lead
- Sb
-
antimony
- Se
-
selenium
- Cd
-
cadmium
- As
-
arsenic
- Ni
-
nickel
- ZnO
-
Zinc oxide
- TiO2
-
Titanium oxide
- SiO2
-
silicon dioxide
- NPs
-
Nanoparticles
- µg/g
-
microgram/gram
- ppb
-
parts per billion
- <LOD
-
below the limit of detection
- USA
-
United States of America
- UVA
-
Ultraviolet A (sun radiation with fairly long wavelengths)
- UVB
-
Ultraviolet B (sun radiation with fairly short wavelengths)
Abbreviations
1 Introduction
Cosmetics and beauty-care products attained a big boost during the last few decades, especially at the beginning of the 21st century (Al-Dayel O and Al-Ajyan, 2011; Brown, 2013). Cosmetic makeup is an essential part of women who are attending social gathering parties, especially the brides in the wedding ceremonies. The industry of cosmetics is too large and includes a variety of products, such as face powders, face creams, talcum, kajal, sindoor, etc.
Apart from the demand, health awareness and knowledge drew the attention of researchers and clinicians toward the adverse effects of cosmetics contamination present in the form of potentially toxic metals. These cosmetics contamination is composed of different types of elements that could cause serious health problems such as skin allergy, cancer, respiratory and reproductive complications, and birth defects. Cu, Cd, Cd, Hg, Cr, and Ni are the most common trace elements found in routinely used body care products, marketed in Saudi Arabia, the USA, Italy, Germany, and China (Zakaria and Ho, 2015; Zainy, 2017). Faruruwa and Bartholomew analyzed the commonly used facial cosmetics in Nigeria. They found Cr, Ni, Zn, and Fe in all the tested samples, Cd was detected in 85 % of the samples while ∼50 % of samples contained Pb (Faruruwa and Bartholomew, 2014). The most toxic and poisonous materials of cosmetics are Pb, As, Cd, and Sb. The dermal exposure of these substances is most significant when applied to the skin (Drexler, 2003). However, such piousness effects occurred only when chronic exposure happened under certain conditions. For example, in case if exposure happened through makeup, then these metals had to be absorbed by the skin or inhaled to produce health problems. Moreover, dermatologists have often considered heavy metals (Pb, Hg, Cd etc.) more harmful than any other substances when ingested or inhaled (Al-Trabulsy et al., 2013; Al-Taani et al., 2020).
Recently, nanotechnology has revolutionized the field of cosmetics and beauty care products with the use of different types of nanomaterials (Cardoza et al., 2022; Gupta et al., 2022). Currently, nanoparticles (NPs) of different types are being used to conjugate cosmetics and body care products that are beneficial to the skin, e.g., nanovesicles and solid lipid NPs are developed for cosmetics and pharmaceutical applications (Morganti, 2010; Ivanova et al., 2023). The nano dimensions of the particles are beneficial for close contact with an outer layer of the epidermis due to the higher number of active sites.
Along with NPs, innovative capsules are used to address the problems of cosmetic dermatology (Patravale and Mandawgade, 2008; Landriscina et al., 2015; Shaher Dochi, 2019). Silica in nano-form acts as an anti-caking agent and is used to enhance the effectiveness, texture, and shelf-life (Poland et al., 2016). Furthermore, silica NPs are used to improve the appearance and distribution of pigments in lipsticks. Currently, insoluble inorganic NPs such as ZnO, and TiO2 are being used for sunscreen in the USA, Japan, and Germany due to their transparent (Gulson and Wong, 2006) and UV filtering properties. The bulk form of ZnO and TiO2 is visible which makes the face white while the micro-form of two particles showed high capabilities of UVA and UVB absorption (Raj et al., 2012). Tailoring the size of the NPs is a key factor in increasing cosmetic compliance and obtaining a transparent body care emulsion. In the case of TiO2 and ZnO, the NPs size is chosen between 60 and 200 nm to get filtering capacity due to their higher reflective index (Warheit et al., 2005; Morganti, 2010).
The raw materials, the use of different colorants, and inadequate purification are collectively the possible factors for the inclusion of impurities in cosmetic products. Aside from potentially toxic elements, the extensive use of nanomaterials in beauty care products is bringing some serious concerns among consumers. In this study, we determined the contents of eighteen (18) trace elements, the morphology and structure of the NPs in low-cost and high-cost facial powder products collected from local markets in Dammam and Khobar, the two cities of the eastern province of Saudi Arabia. The contents of these selected trace elements in six cosmetic specimens are determined by using ICP-OES technique. Electron microscopy and infrared spectroscopy tools are used to evaluate the surface morphology, structure, chemical composition, chemical distribution, and chemical bonding of the constituent elements present in cosmetic products. The findings of this study could provide awareness to consumers about the safe uses of body-care products.
2 Materials and methods
2.1 Sample collection and labeling
The facial powders were purchased from local markets of Dammam and Khobar cities, Saudi Arabia. Six facial powder samples from which two were imported and four were manufactured locally. The local products were cheap and manufactured by unauthorized national companies. For the sack of simplicity, the locally manufactured specimens were called low-priced brands and labeled as S1, S2, S3, and S4, while the imported specimens were referred to as high-priced brands and denoted as S5 and S6. Both types of samples, low- and high-priced were arranged in the laboratory for the determination of essential trace elements using different techniques.
2.2 Reagents and standards
The digestion process was completed using hydrofluoric acid (HF) and nitric acid (HNO3) purchased from Sigma Aldrich, Darmstadt, Germany. After digestion, HF neutralization was done by adding boric acid (H3BO3) solution drop-wise. The calibration standards, standard stock solution, and dilution correction parameters were followed as given in previous studies (Hepp, 2012; Zainy, 2017).
2.3 Sample preparation and ICP-OES characterization
Before starting the experiment, the laboratory consumables, such as glassware and plastics were cleaned, washed with tape water, HNO3 solution, and finally with deionized water. The sample preparation method was adopted as followed by other researchers (Liu et al., 2009; Zakir et al., 2009; Omer et al., 2019). First, the samples are heated in the oven at 130 °C with HNO3 and HF solutions. After 15 min, the temperature was raised to 200 °C and added H3BO3 solution and heated the samples again. Then, the samples were diluted and transferred to the flask for calibration and further trace elements analysis using Inductively coupled plasma-optical emission spectrometry (ICP-OES) (A Thermo 6000DVTiva) (Al-Dayel O and Al-Ajyan, 2011; Hepp, 2012). From six specimens, eighteen trace elements were determined as follows (names and symbols): lithium (Li), calcium (Ca), iron (Fe), magnesium (Mg), aluminum (Al), zinc (Zn), sodium (Na), manganese (Mn), potassium (K), barium (Ba), chromium (Cr), copper (Cu), Lead (Pb), antimony (Sb), selenium (Se), cadmium (Cd), arsenic (As) and nickel (Ni). The content of each element is represented as µg/g unit for each sample. Statistical analysis was performed by repeating the experiments for three times. The standard methods were used for the sample preparation as used for ICP-OES measurements with lower limit in the parts per billion (ppb).
2.4 SEM and TEM characterization
Scanning electron microscopy (SEM) (Inspect S50; FEI) and transmission electron microscopy (TEM) (Morgagni 268; FEI) methods were applied to evaluate the morphology and structure of the low-cost specimens (S1–S4) and high-cost specimens (S5 and S6). SEM often provides a wide view of the specimen, e.g., a scanned area of about 30 × 30 µm2 was recorded using SEM in the current study. TEM produces the detailed morphology and structural features of the materials with high resolution. SEM samples were prepared onto metallic stubs using double-sided carbon tape and coated with gold to minimize electron charging for better image quality. In the case of TEM, cosmetic powders were dispersed into ethanol and deposited onto TEM grids. TEM was operated at 80 kV and SEM was performed at 20 kV (Akhtar et al., 2019; Al Baroot et al., 2023). The selected area electron diffraction (SAED) patterns were recorded for S5 and S6 powders to reveal the crystalline structure of the nanoparticles inside the branded powders.
2.5 FTIR characterization
Chemical bonding of the facial powders was characterized using Fourier transform infrared spectroscopy (FTIR) (FTIR spectrometer, Nicolet 6700). For this purpose, two specimens from each brand were selected for FTIR, e.g., (S3 & S4) from low-cost and (S5 & S6) from high-cost cosmetic powders.
3 Results and discussion
3.1 Determination of trace elements
Due to possible toxicity, the determination of trace elements in cosmetics is very important and several methods such as ICPMS and ICPOES have been used (Liu et al., 2009; Zakir et al., 2009). A detailed description of the determination of trace elements is discussed; specifically metal contents of eighteen essential trace elements, in different facial powders using ICPOES (Table 1).
S. No.
Trace elements
*Low Price Brand (µg/g)
*High Price Brand (µg/g)
Highest metal contents (µg/g)
S1
S2
S3
S4
S5
S6
1
Al
246.25 ± 4.19
243.92 ± 4.11
347.75 ± 4.12
368.75 ± 5.11
<LOD
0.35 ± 0.11
368.3
2
As
<LOD
0.06 ± 0.01
<LOD
<LOD
<LOD
<LOD
0.06
3
Ba
0.27 ± 0.03
3.76 ± 0.10
3.91 ± 0.22
2.83 ± 0.11
0.13 ± 0.01
0.18 ± 0.02
3.76
4
Ca
360.60 ± 8.21
1398.94 ± 5.22
2252.83 ± 10.71
1829.24 ± 7.20
163.41 ± 4.21
86.74 ± 4.22
2252.83
5
Cd
0.02 ± 0.01
0.04 ± 0.01
0.03 ± 0.01
0.05 ± 0.00
0.01 ± 0.00
<LOD
0.04
6
Cr
5.69 ± 1.12
6.64 ± 1.20
7.42 ± 1.31
5.43 ± 1.11
1.83 ± 0.29
2.72 ± 0.50
7.42
7
Cu
0.45 ± 0.01
0.48 ± 0.02
0.42 ± 0.01
1.69 ± 0.04
0.18 ± 0.01
0.19 ± 0.01
1.69
8
Fe
155.42 ± 5.68
500.01 ± 5.72
485.36 ± 4.52
533.07 ± 4.79
421.73 ± 5.31
989.48 ± 7.72
989.48
9
K
8.40 ± 1.20
3.85 ± 1.10
19.11 ± 3.22
7.39 ± 1.5
14.03 ± 2.22
1.56 ± 0.50
19.11
10
Li
10942.70 ± 36.21
2345.72 ± 16.33
21943.76 ± 15.21
4920.98 ± 23.32
5556.75 ± 21.21
726.67 ± 11.13
10942.70
11
Mg
248.91 ± 6.72
279.88 ± 4.31
222.13 ± 3.41
261.93 ± 5.21
218.09 ± 4.22
128.70 ± 3.73
279.88
12
Mn
1.18 ± 0. 31
5.53 ± 1. 21
5.26 ± 1. 30
8.32 ± 1. 40
48.70 ± 3. 31
1.94 ± 0. 11
48.70
13
Na
40.34 ± 1.05
74.271 ± 5.11
131.511 ± 7.11
124.21 ± 6.31
63.81 ± 3.38
66.87 ± 4.10
131.511
14
Ni
<LOD
<LOD
<LOD
<LOD
<LOD
<LOD
<LOD
15
Pb
0.17 ± 0.03
0.29 ± 0.07
0.68 ± 0.09
0.22 ± 0.02
0.16 ± 0.01
0.26 ± 0.04
0.68
16
Sb
0.06 ± 0.01
0.15 ± 0.03
0.13 ± 0.01
0.08 ± 0.03
0.09 ± 0.01
0.12 ± 0.01
0.15
17
Se
0.13 ± 0.01
0.11 ± 0.02
0.01 ± 0.01
<LOD
0.22 ± 0.01
<LOD
0.22
18
Zn
15.72 ± 2.10
638.02 ± 7.71
4.42 ± 1.72
133.95 ± 4.72
4.97 ± 1.21
2.43 ± 0.91
638.02
The study analyzed the contents of eighteen microelements of the cosmetic powder. Al, Ca, Fe, Mg, and Zn exhibited the highest average contents among the examined elements, with Al levels being particularly high in low-branded specimens (S1-S4). Li showed the highest content overall among all tested specimens. As, Ba, and Cd were found in relatively low contents and Ni was not detected in any of the samples. Pb, though present, did not exceed standard levels, and the highest content was found in a low-branded specimen (S3). Low-priced brands generally showed higher levels of Cr, Cu, K, Li, Mg, Mn, and Zn. High-priced brands had higher contents of Fe.
It was observed that certain elements like Cr, Cd, and Pb fall within or below reported ranges (Liu et al., 2009; Zakir et al., 2009; Al-Dayel O and Al-Ajyan, 2011). Some elements, such as Cr, were not found in a significant percentage of samples in other studies, but in this case, Cr contents were notably present. Toxic elements such as As and Pb were present but generally at low contents, and Pb levels did not exceed standard levels (Sani et al., 2016). Concentration levels varied among the different cosmetic products, highlighting the importance of assessing individual products rather than generalizing results.
It is important to note that high contents of certain trace elements in cosmetics can have potential health implications for consumers. For instance, Pb can cause serious health problems, especially when present in high contents (Theresa et al., 2010). It is harmful to the nervous system, kidneys, and reproductive organs. High Pb exposure has been linked to cognitive impairments, developmental issues in children, and reproductive problems in adults. Arsenic (As) in high amounts can lead to various health problems, including skin lesions, cardiovascular diseases, and an increased risk of certain cancers. Similarly, high contents of Cr can increase the risk of lung cancer and respiratory issues. Cd can accumulate in the kidneys and liver. Prolonged exposure to high levels of Cd has been associated with kidney damage, lung cancer, and cardiovascular diseases. Ni exposure can cause skin irritation, allergies, and respiratory issues. Prolonged exposure to high levels of Ni has been linked to an increased risk of lung and nasal cancers. High contents of Sb can cause nausea, vomiting, and diarrhea. Long-term exposure may lead to more severe health effects. The contents of these trace elements in cosmetics mentioned in the study may or may not exceed safety standards set by regulatory bodies. The correlation between high contents in cosmetics and specific diseases would depend on the level of exposure, duration, and other individual factors.
3.2 Morphological, structural, and chemical analyses
Fig. 1 shows the SEM micrographs and Fig. 2 is the TEM images, for low-cost (S1–S4) and high-cost (S5 and S6) cosmetic powder products. The cosmetics showed varying morphology, and sheet-like structure along with nanoparticles. Sample S1 displayed thick and large-sized sheets or two-dimensional irregularly shaped particles whilst for sample S2, the sheets were smaller and thinner as compared to S1. This observation was clear in Fig. 1a & b (SEM micrographs) and Fig. 2a1–a4 & 2b1–b4 (TEM images), where the thin sheets were stacked on top of each other for S2 as confirmed by the electron- particles contrast. The electronic contrasts of sheets for S2 are brighter than S1 due to the scattering of fewer electrons during bright-field imaging, suggesting the thin nature of the sheet-like particles with irregular morphology. Furthermore, the wrinkles and folds in the sheets further highlight the thin nature as often observed in the case of thin sheets of graphene (Rubino et al., 2016; Rahoma et al., 2020). In addition to sheets, some sharp-edged needle-like particles attached to sheets were also seen for both cosmetics, needles were more clearly visible for S1 specimen.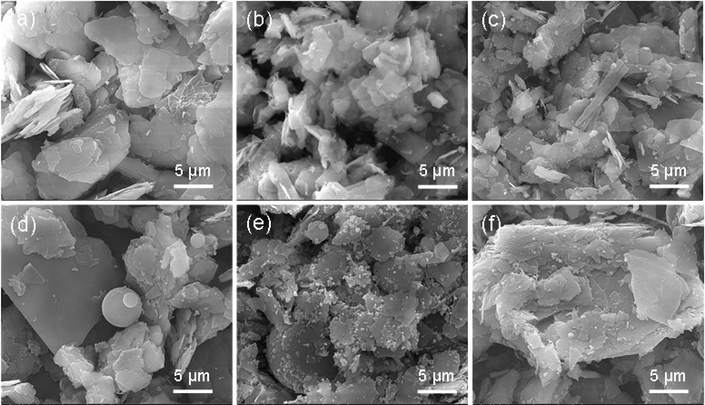
Surface morphology of the low-cost and high-cost cosmetics examined by SEM at ×10, 000 magnification. Low-cost specimens; (a) S1, (b) S2, (c) S3 and (d) S4. High-priced specimens; (e) S5 and (f) S6. All scale bars are 5 µm.
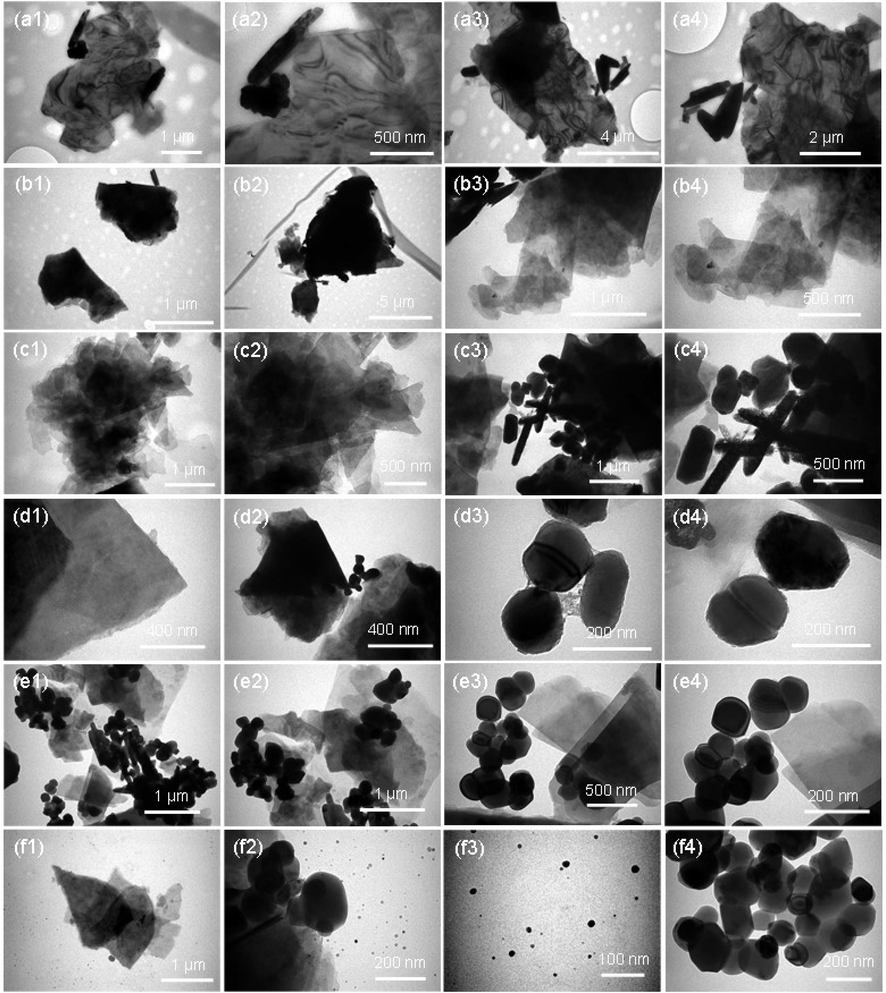
Size, shape, and structure of four low-priced and two high-priced cosmetics examined by TEM each at four magnifications. (a1–a4) Cosmetic S1; (b1–b4) Cosmetic S2; (c1–c4) Cosmetic S3, (d1–d4) Cosmetic S4. (e1–e4) Cosmetic S5, and (f1–f4) Cosmetic S6. Both high-priced specimens show the nanoparticles along with cosmetic sheets.
The morphology of sample S3 was observed similar to that of cosmetic S2 but it exhibited a number of submicron- sized elongated particles along with irregularly shaped sheets (Fig. 1c and Fig. 2c1–c4). However, the agglomeration level of sheet stacking was high as compared to specimen S2 as judged by the dark electron-particle contrasts. The size of the elongated particles varied between a few hundred of nanometers to a micrometer. Sample 4 consists of large and small-sized sheets of different shapes and sizes (Fig. 2d and Fig. 2d1–d4). In addition, different kinds of particles were observed such as, spherical and elongated particles in the size range of about 200 nm. These particles could be silica as they are always expected in cosmetic products (Nazarenko et al., 2012). The presence of silica particles in the cosmetic products was further confirmed when EDX analysis was carried out as elaborated in the following text related to EDX discussion. The high-cost specimens, S5, and S6 showed both thin and small-sized cosmetic flakes along with particles (Fig. 1e, f). The presence of nanoparticles was clear by SEM micrographs of both high-cost specimens where obvious deposition of particles as appeared in bright contrast can be seen undoubtedly. It was observed that the S6 specimen has small/large-sized sheets staking on top of each other. In addition, to SEM, TEM images of the high-cost cosmetics further highlighted, and clarifying the presence of nanoparticles (NPs) along with irregularly shaped sheets (Fig. 2e1–e4 & 2f1–f4). It was observed that the particles varied in size and shape, their dimensions ranged between a few nanometers to a few tens of nanometers. In contrast to sample 5, the cosmetics of S6 exhibited dual-sized particles, small and large; roughly 70 % of the particles were small-sized and 30 % of large-sized (see Fig. 3). Large-sized particles for both high-cost specimens appeared nearly in the same size (slightly above 160 nm), see Fig. 2e4 & f3 and size histogram plots of both the specimens (Fig. 3a, c). The average size of the small-sized particles was estimated at about 12 nm, and ∼164 (S5) and 170 nm (S6) for large-sized particles. These particles were observed both in agglomeration form as well as individuals, especially for small-sized NPs (∼12 nm) that appeared as free particles. This observation was obvious in Fig. 2f1–f3, where free particles can be seen otherwise, the particles were aggregated (see Fig. 2e1–e4 & f4). All these particles were well connected to the TEM grid in contrast to cosmetics 5 where particles were firmly attached and aggregated with sheets. This observation was further verified when a large number of bright dots in the SEM micrograph of this sample was seen and examined on top of cosmetic sheets (Fig. 1e). The NPs of both specimens were crystalline as confirmed by the dots of the diffraction patterns (Fig. 3b & d). The dots in the diffraction pattern appear when the materials are crystalline. In summary, SEM and TEM results showed the sheets-like morphology for all the cosmetic products whereas abundant aggregated NPs were also found along with electron-contrast particles for high-priced products.
Size histograms and electron diffraction patterns of the cosmetics (TEM analysis); (a, b) S5 and (c, d) S6. The average size of the NPs of S5 was found ∼164 nm while S6 shows the dual sized particles: 5–20 nm and 50–300 nm. (b, d) The spots in the electron diffraction indicate the crystalline structure of the particles.
With the introduction of nanotechnology, the use of nanomaterial is increasing drastically in a variety of fields including the cosmetic industry to obtain the distinctive properties of cosmetic products. However, the use of NPs or nanomaterial in cosmetics products and sprays could produce dermal and inhalation exposure due to the presence of aerosol particles in the breathing zone (Shimada et al., 2009; Kessler, 2011). It is important to note that the free NPs or particle agglomerates present in cosmetics can be released and enter the repertory system of humans and cause serious health problems. Additionally, the toxic and heavy metals present in cosmetic products are being transported physically to the consumer’s body which has dangerous morphologies and structures as observed by SEM and TEM (Nowack and Bucheli, 2007). Furthermore, the potentially toxic trace elements could modify the surface of the NPs by physical and chemical reactions during production which may alter the toxic features of the incorporated NPs (Savolainen et al., 2010; Kessler, 2011).
By TEM, it was observed that the number of NPs for both small and large-sized particles was higher in the high-priced specimens, S5 and S6. The particles were present both as agglomeration and individuals or irregularly shaped cosmetic sheets in low-priced cosmetics. These substances could easily deposit to the upper air path of the human respiratory system and could cause different health issues rather than just based on the toxicity of the NPs for the alveolar region. Industries and cosmetic manufacturing companies must consider the risks involved in the deposition of these substances into the air path while designing their products. Some recent studies showed the estimated exposure effects of cosmetics on human health coming from short-term and long-term use of cosmetics and beauty care products (Savolainen et al., 2010; Nazarenko et al., 2012).
After the emergence of nanotechnology, NPs of different types of materials have been included in cosmetic products. The important types of NPs are carbon nanotubes, fullerene, SiO2 NPs, Ag NPs, TiO2 NPs, and, ZnO NPs (Hansen et al., 2008). EDX is a very useful technique to analyze the nature of NPs, the chemical composition of constituent elements, and the distribution of each element within the specimen (Almessiere et al., 2019; Akhtar et al., 2020). In addition to the morphology and structure, the elemental analysis of low-cost and high-cost specimens were conducted by using EDX in the SEM instrument. The results of EDX spectra, elemental composition in tabulated form, and elemental mapping images of low-cost (S3-specimen) and high-cost specimens (S6-specimen) are displayed in Figs. 4 & 5. About 20 elements Li, C, oxygen (O), Na, Mg, Al, Si, K, Ca, Cr, Mn, Fe, Cu, Z, As, Se, Cd, Sb, Ba, and Pb were detected (Fig. 4) and their distribution in the form of electronic images were recorded as well (Fig. 5). It can be seen by the inset tables that the content of O, Mg, Si, and Ba were higher for both the specimens and found respectively, 48.9, 14.8, 20.7 and 6.5 wt% (for low-cost specimens) and 48.7, 11.6, 17.0 and 4.0 wt% for the high-cost specimen. In addition to these four elements, the content of C was also higher (11.8 wt%) for S6, which was a mere 0.2 wt% for S2 cosmetics. The elemental distribution images confirmed the findings of the x-ray's elemental compositions. The four elements: O (red), Mg (cyanide), Si (pink), and Ba (light blue) appeared highest in the relevant cosmetics. From the mapping images, it can be seen that Al, Ca, and Sb were not distributed uniformly as judged by patches of colors or comparatively thick colors, indicating that these elements were concentrated or accumulated more than other elements, or these elements were present in the form of some kind of agglomerated particles. These concentrated areas or patches of colors are indicated by white arrows for each element in the mapping images.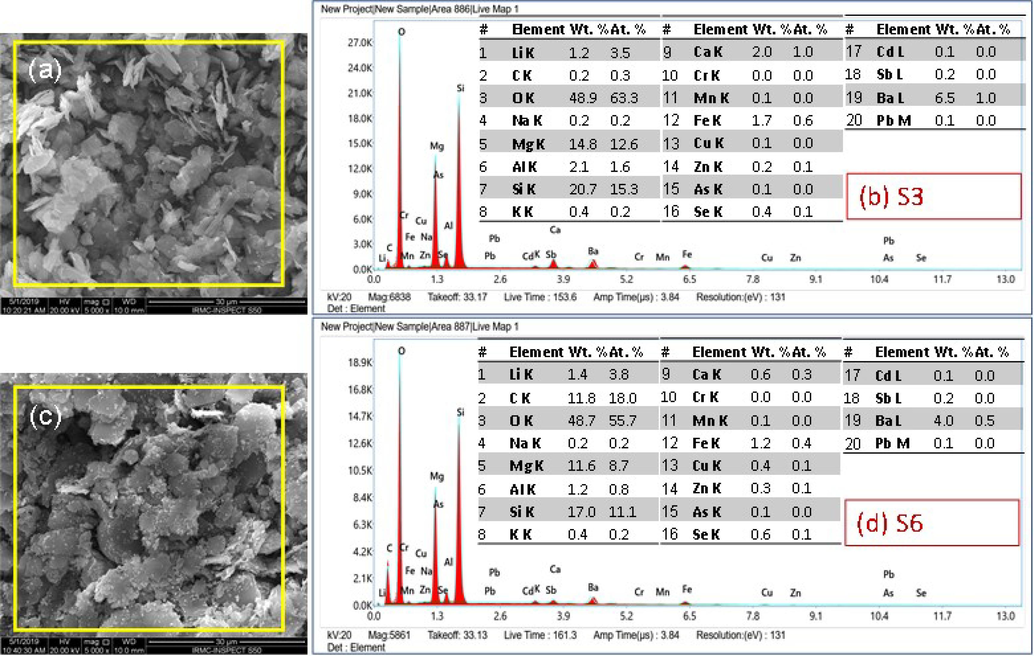
X-rays elemental spectrum and elemental composition of twenty essential trace elements appeared in (a, b) low-cost (S3) and (c, d) high-cost (S6) specimens. Carbon (C) and oxygen (O) were also included as they are the main components of the cosmetics.

EDX mapping images of the twenty essential trace elements appeared in the low-cost (S3) and high-cost (S6) specimens. Carbon (C) and oxygen (O) were also included along with eighteen (18) elements as they are the main components of the cosmetics.
It was observed that Si was the main constituent element after O for both low-cost and high-cost cosmetics, appearing at about 20.7 and 17.0 wt%, for S3 and S6, respectively. The remaining elements, such as Li, Na, Mg, K, Ca, Cr, Mn, Fe, Co, Z, As, Se, Cd, and, Pb appeared uniformly as confirmed by their uniform distribution of colors in the element mapping images. In summary, the elemental composition and elemental mapping results showed that some elements are uniformly distributed throughout the powder and some are accumulated at a specific part of the specimen. O, C, Si, and Mg are the dominant parts of the specimen in low-cost and high-cost cosmetics.
Fig. 6 presents the survey scans (4000 and 400 cm−1) and close-up views (1600 and 400 cm−1) of the facial powders (Akhtar et al., 2018; Yuan et al., 2018; Akhtar et al., 2020). The characteristic bands of each spectrum starting from the left shoulder are labeled as 3676 cm−1 and 2953, cm−1 (low-intensity bands), 1440 cm−1, and 988 & 670 cm−1 (intense bands). A band, ∼3676 cm−1 attributed to a weak absorption band corresponds to hydroxide (OH) stretching mode. Similarly, the bands centered at ∼2923, cm−1 are also attributed to OH stretching modes (Samanta et al., 2016). The broadband appeared at ∼1460 cm−1 corresponding to asymmetric stretching mode. By Fig. 6a, it can be seen that all the spectra show almost the same characteristic bands; only minor variation especially in the intensity of the bands is observed. For instance, the band at 988 cm−1 shows the maximum dip for the S3 specimen while relatively broadband for the S6 specimen. Similarly, the S3 specimen was displaying a band with maximum intensity at ∼670 cm−1. It was noted that S6 powder was showing some extra peaks, between 1600 and 1500 cm−1 as clear by close-up Fig. 6b. The FTIR results confirmed that the manufacturers did not use the well-characterized and known particles in their products as no bands for any specific NPs were observed.
FTIR spectra of two low-cost facial powders (S3 & S4) and two high-cost facial powders (S5 & S6) between 4000 and 400 cm−1 and (b) close-up spectra of the same powders between 1600 and 400 cm−1.
4 Conclusion
This study provides a comprehensive analysis of facial cosmetics available in the local markets of Saudi Arabia, focusing on both morphological and quantitative aspects of trace elements. Utilizing SEM/EDX, TEM/SAED, and FTIR techniques, the research characterized the size, shape, structure, and chemical composition of the cosmetic products. SEM/TEM analyses revealed a sheet-like morphology of the cosmetics with varying sizes up to several micrometers in length. The branded specimens exhibited nano-sized crystalline particles along with sheets, the size of the particles was varied between 5 and 300 nm. ICPOES was employed to determine contents of essential and potentially toxic trace elements. The measured contents of trace elements showing significant variations between branded and locally manufactured products. The contents range (µg/g) of Li, Ca, Fe, Mg, Al, Zn, Na, Mn, K, Ba, Cr, Cu, Pb, Sb, Se, Cd, As, and Ni was determined as, 7739.43, 1015.3, 514.12, 226.61, 201.10, 133.25, 83.50, 11.82, 9.05, 1.85, 4.96, 0.57, 0.29, 0.10, 0.08, 0.03, 0.01, and <LOD, respectively. Ni was found below the limit of detection. The study concludes that cosmetics contain trace elements and nanoparticles, emphasizing the need for user awareness regarding potential health and environmental impacts.
CRediT authorship contribution statement
Sultan Akhtar: Conceptualization, Data curation, Formal analysis, Investigation, Methodology, Validation, Visualization, Writing – original draft, Writing – review & editing. Khaled F. Salama: Conceptualization, Data curation, Formal analysis, Investigation, Methodology, Project administration, Validation, Writing – review & editing.
Acknowledgment
The authors acknowledged Mr. Ossama Ahmed Labib and Miss Noor Alrushaid for their assistance in this work. IRMC is acknowledged for its instrumental support and to conduct different experiments in the labs.
Declaration of competing interest
The authors declare that they have no known competing financial interests or personal relationships that could have appeared to influence the work reported in this paper.
References
- A novel approach to produce monodisperse hollow pure silica spheres. J. Saudi Chem. Soc.. 2019;23(4):477-485.
- [Google Scholar]
- Enhancement of anticorrosion property of 304 stainless steel using silane coatings. Appl. Surf. Sci.. 2018;440:1286-1297.
- [Google Scholar]
- Evaluation of bioactivities of zinc oxide, cadmium sulfide and cadmium sulfide loaded zinc oxide nanostructured materials prepared by nanosecond pulsed laser. Mater. Sci. Eng. C. 2020;116:111156
- [Google Scholar]
- One-pot synthesis of SnO2 nanoparticles decorated multi-walled carbon nanotubes using pulsed laser ablation for photocatalytic applications. Opt. Laser Technol.. 2023;157:108734
- [Google Scholar]
- Structural, magnetic, optical properties and cation distribution of nanosized Co0.7Zn0.3TmxFe2−xO4 (0.0 ≤ x ≤ 0.04) spinel ferrites synthesized by ultrasonic irradiation. Ultrason. Sonochem.. 2019;58:104638
- [Google Scholar]
- Heavy elements concentrations, physiochemical characteristics and natural radionuclides levels along the Saudi coastline of the Gulf of Aqaba. Arab. J. Chem.. 2013;6(2):183-189.
- [Google Scholar]
- Metals in lip products: a cause for concern? Environ. Health Perspect.. 2013;121(6):A196.
- [Google Scholar]
- Emerging applications of nanotechnology in cosmeceutical health science: latest updates. Health Sci. Rev.. 2022;4:100051
- [Google Scholar]
- Drexler, K.E., 2003. The Future of Nanotechnology: Molecular Manufacturing. American Association for the Advancement of Science.
- Faruruwa, M.D., Bartholomew, S.P., 2014. Study of heavy metals content in facial cosmetics obtained from open markets and superstores within Kaduna metropolis, Nigeria.
- Stable isotopic tracing-a way forward for nanotechnology. Environ. Health Perspect.. 2006;114(10):1486-1488.
- [Google Scholar]
- Nanotechnology in cosmetics and cosmeceuticals-a review of latest advancements. Gels. 2022;8(3)
- [Google Scholar]
- Categorization framework to aid exposure assessment of nanomaterials in consumer products. Ecotoxicology. 2008;17(5):438-447.
- [Google Scholar]
- Determination of total lead in 400 lipsticks on the U.S. market using a validated microwave-assisted digestion, inductively coupled plasma-mass spectrometric method. J. Cosmet. Sci.. 2012;63(3):159-176.
- [Google Scholar]
- Bio-based nano-enabled cosmetic formulations for the treatment of cutibacterium acnes-associated skin infections. Antioxidants. 2023;12(2):432.
- [Google Scholar]
- Engineered nanoparticles in consumer products: understanding a new ingredient. Environ. Health Perspect.. 2011;119(3):a120.
- [Google Scholar]
- Nanotechnology, inflammation and the skin barrier: innovative approaches for skin health and cosmesis. Cosmetics. 2015;2(2):177-186.
- [Google Scholar]
- Heavy metal contamination in soil alongside mountain railway in Sichuan, China. Environ. Monit. Assess.. 2009;152(1–4):25-33.
- [Google Scholar]
- Use and potential of nanotechnology in cosmetic dermatology. Clin. Cosmet. Investig. Dermatol.. 2010;3:5-13.
- [Google Scholar]
- Potential for inhalation exposure to engineered nanoparticles from nanotechnology-based cosmetic powders. Environ. Health Perspect.. 2012;120(6):885-892.
- [Google Scholar]
- Occurrence, behavior and effects of nanoparticles in the environment. Environ. Pollut.. 2007;150(1):5-22.
- [Google Scholar]
- Physicochemical parameters and toxic heavy metals concentration in coffee. Asian J. Appl. Chem. Res.. 2019;3(3):1-8.
- [Google Scholar]
- Novel cosmetic delivery systems: an application update. Int. J. Cosmet. Sci.. 2008;30(1):19-33.
- [Google Scholar]
- Assessment if Nano-Enabled Technologies in Cosmetics. Copenhagen, Denmark: The Danish Environmental Protection Agency; 2016.
- Impact of different surface treatments and repair material reinforcement on the flexural strength of repaired PMMA denture base material. Dent. Mater. J.. 2020;39(3):471-482.
- [Google Scholar]
- Nanotechnology in cosmetics: opportunities and challenges. J. Pharm. Bioallied Sci.. 2012;4(3):186-193.
- [Google Scholar]
- A simple transmission electron microscopy method for fast thickness characterization of suspended graphene and graphite flakes. Microsc. Microanal.. 2016;22(1):250-256.
- [Google Scholar]
- Synthesis of mixed calcite–calcium oxide nanojasmine flowers. Ceram. Int.. 2016;42(2, Part A):2339-2348.
- [Google Scholar]
- Determination of some heavy metals in selected cosmetic products sold in Kano metropolis, Nigeria. Toxicol. Rep.. 2016;3:866-869.
- [Google Scholar]
- Risk assessment of engineered nanomaterials and nanotechnologies–a review. Toxicology. 2010;269(2–3):92-104.
- [Google Scholar]
- Tagra Biotechnologies: Improving cosmetic microencapsulation to create new user experiences. Tagra Biotechnol. 2019
- [Google Scholar]
- Development and evaluation of an aerosol generation and supplying system for inhalation experiments of manufactured nanoparticles. Environ. Sci. Technol.. 2009;43(14):5529-5534.
- [Google Scholar]
- Theresa, O.C., Onebunne, O.C., et al., 2010. Potentially Toxic Metals Exposure From Body Creams Sold in Lagos, Nigeria.
- Comparative pulmonary toxicity inhalation and instillation studies with different TiO2 particle formulations: impact of surface treatments on particle toxicity. Toxicol. Sci.. 2005;88(2):514-524.
- [Google Scholar]
- Research on hydrophobicity treatment of aluminum nitride powder and the fabrication and characterization of AlN/PTFE composite substrates. J. Mater. Sci. Mater. Electron.. 2018;29(17):14890-14896.
- [Google Scholar]
- Heavy metals in lipstick products marketed in Saudi Arabia. J. Cosmet. Dermatol. Sci. Appl.. 2017;7:336-348.
- [Google Scholar]
- Heavy metals contamination in lipsticks and their associated health risks to lipstick consumers. Regul. Toxicol. Pharm.. 2015;73(1):191-195.
- [Google Scholar]
- Comparison of heavy and trace metals levels in soil of Peshawar basin at different time intervals. J. Chem. Soc. Pak.. 2009;31:246-256.
- [Google Scholar]


