

Translate this page into:
Causes of higher levels of stress among students in higher education who used eLearning platforms during the COVID-19 pandemic
⁎Corresponding author. robertselvam@loyolacollege.edu (D. Robert Selvam)
-
Received: ,
Accepted: ,
This article was originally published by Elsevier and was migrated to Scientific Scholar after the change of Publisher.
Peer review under responsibility of King Saud University.
Abstract
Background
This work aims to study the levels of stress among students using e-learning platforms during the COVID-19 pandemic in higher education institutions. The major factors of higher-level stress among the student community focused on this study are: Changes in academic environment, family, social, personal, health and cognitive.
Objective
the objective of this research the Partial Least Squares Structural Equation Modelling (PLS-SEM) procedure was used to explore the relationship and its impact on various levels of stress.
Results
Data were collected by using a total of 1,000 email IDs of students that were made available by teachers from 12 Indian higher education institutions where they were enrolled and by using a random number method. With this procedure, a total of 800 email IDs were selected. The results drawn from this research are that students experienced more stress due to sudden changes in the academic environment, family, and personal factors. The stress levels of cognitive and social were found to be equally distributed among higher education students, but less than academic environment, family and personal. This research intends to fill the gap of short-term individual psychological changes that occur after the outbreak.
Conclusion
Policy-makers can take note of the current study’s observations in continuing their fight against COVID-19 pandemic by improving the stability for student risk groups.
Keywords
Academic Environment
Covid-19
Cluster Analysis
Personal and Cognitive Factors
PLS-SEM
Stress

1 Introduction
Corona Virus Disease 2019, abbreviated as COVID-19, is a highly infectious disease caused by Severe Acute Respiratory Syndrome Corona virus 2 (SARS-COV2) and its incubation period is very long attending to the studies available. According to the editorial report published by The Lancet 2020, government decisions to order lockdowns were taken without any preparedness and were implemented in a hastily manner that directly harmed vulnerable populations. As one of the major critical determinants of the economic future of a country, the higher education sector has is also in a critical position due to this pandemic (Mohammedqasem et al., 2023; Richa, 2020; Calvo et al., 2020).
The World Health Organization (WHO) announced Corona virus (COVID-19) a pandemic that required certain measures (WHO, 2020). Since then, COVID-19 is Severe Acute Respiratory Syndrome Corona virus 2 (SARS-CoV-2) affects higher education by forcing universities to close down and look for alternative ways to deliver education (UNISCO, 2020a). With the unbelievable spread of COVID-19 in India coupled with absence of an immediate solution, the learning continuity of 285 million young students was not only impacted in the short-term, but it also may have serious consequences for the country’s economy and societal development (Schleicher, 2018). Using various online methods produced positive as well as negative outcomes (UNESCO, 2020b). Unfortunately, there is little research on the linkages between COVID-19 and higher education, this paper aims to fill this gap by exploring psychological impact of involuntary online education on students and their mental health.
Caskey & Anfara (2007), Early adolescence is defined as a distinct period in human development characterized by interrelated changes in cognitive, physical, and socioemotional development. It also explained the nine key components of the program in the form of guiding principles, operations, and mechanisms and how a comprehensive approach is created out of this, during the process of educating children for success in life. This research work was intended to contribute to the development of a process with implications on college and classroom Learning and Development practices, as formulated (Darling-Hammond et al., 2020). Further, also mentioned that the student scores must be interpreted by faculty, since they are also managers and members of the assessment committee (Linse 2017).) Analyzed the correlation between social-economic-technical-environmental significance in the process of achieving sustainable development (Padmanathan et al.,2019).
According to Selye H. (1956), the stress is the body’s response to a stimulus that occurred due to a good or bad experience. Though the repeated instances of acute stress do not affect the human health, frequent acute stress or otherwise termed as episodic acute stress should be managed carefully. People who undergo episodic stress are mostly seen as irritable, anxious, and in crisis mode, since they are constantly worried. It becomes difficult for people with episodic stress to manage it since they get overwhelmed by it. Though the symptoms are similar between acute and episodic stress, the latter has extreme outcomes with high frequency. In addition to physical relation, stress creates a negative impact on one’s cognition, behavior, and emotions. Social cognitive theory earlier postulated few important personal, behavioral, and environmental influences that play a developmental role in motivation (Kumari et al. 2009; Al-Otaibi, et al., 2023; Mohammedqasem et al., 2023).
The motivation pattern of researchers who analyze the attributional processes was explored which provide insight on this temporal sequence, emphasizing cognitions and emotions which are triggered as soon as behavior is stopped (Graham et al., 2020). The stress can be defined as any situation which simulates a threat or danger to the well-being of the human being. When it comes to student community, the past few weeks observed an abrupt increase in the academic pressure, especially due to examinations, tasks, and other curricular activities which are mandatory for students (Auerbach and Grambling 1998; Alfawaz et al., 202). mentioned that excess stress may create a long-lasting impact on emotional well-being and academic performance (Mc Kean et al., 2000; Mohammedqasem et al., 2023).The current research aimed at studying the stress level of academic environment, family, social, personal, health and cognitive. The behaviors in the academic environments which cause students to stress are measured according to eight variables.
2 Materials and method
The research tool was designed by the authors in two sections. While the first section consists of characterizing the profile of the respondents who are part of the sample in terms of gender, nature of degree, graduation and years of study, the second section covers questions related to dimensions that can quantify the stress from academic environment, family, social, personal, health and cognitive perspectives. While the first section variables are determined by nominal data, the second section variables are measured using Likert Scale (McIver &Carmines, 1981) with 5 points (1 = Strongly Disagree, 2 = Disagree, 3 = Neutral, 4 = Agree and 5 = Strongly Agree).
2.1 Sampling procedure
In this study a convenient sampling procedure was used to select the research sample. A total of 1,000 email IDs of students were collected from the teachers of the 12 higher education institutions where they were enrolled, in India. Bearing in mind ethical issues and confidentiality the names of students were not disclosed. Using random number method, a total of 800 email IDs were selected. The Google form was used to construct the questionnaire which was later sent via email. From the total questionnaires sent by email, 602 questionnaires were received. All entries were selected since the Google form does not allow any question to be left unanswered. After detection and removal of outliers, the final sample size was restricted to 538 responses for the current study, which represents an excellent sample rate of 65.25%.
To evaluate the causes of student stress levels deriving from the COVID-19 pandemic emergency, the Partial Least Square Structural Modeling (PLS-SEM) was used, and a conceptual model designed. The PLS-SEM method is nonparametric in nature, which means that it does not need any assumption concerning the distribution of data. The PLS-SEM presents an opportunity to determine multifaceted procedure of associations and causal relationships that are otherwise hard to uncover (Hair et al. 2012). PLS-SEM processes data for the assessment of path coefficients. This study uses the PLS-SEM to better understand the factors that most influence student stress level because of COVID-19. The conceptual model explains the relationships between the latent variables and their related manifest variables. By using the PLS-SEM technique, a model was developed and a total of 43 factors were also identified as the observed variables, which were followed and clustered into six groups such as Academic environment (Busari 2012; Kotter et al., 2017), Family (Byron et al., 2008; Chernomas & Shapiro 2013; Goff 2011), Social (Bennett & Holloway 2014; King et al., 2014), Personal (Deb et al., 2015; Verma et al., 2002), Health (Dallman et al., 1993; Deb et al., 2015; King et al., 2014) and Cognitive (Shinto 1998; Liu 2015; Liu and Lu 2011).
2.2 Statistical evaluation
The primary data was analyzed using some statistical tools, such as partial least squares structural equation modeling and line charts, Cluster analysis, Mean and Error Bar plot. In this research, the statistical package R Language 3.6.3 was used with other packages, such as Hmisc, plssem, ggplot2, ggdendro and dendextend and MS-Excel 2007.
2.3 Cluster Analysis
In order to identify the similarity and dissimilarity among constructs, the cluster analysis was conducted. The variables were clustered based on the Wald minimum variance measures, using different colors to identify the six constructs.
Mean and Error Bar Plot: For every construct, mean and standard deviation were computed on the basis of the average measure of its variables.
Partial Least Square-Structural Equation Modeling (PLS-SEM): PLS-SEM is one of the non-parametric statistical tools that is generally used to develop the theoretical model (Hair et al., 2012; Henseler et al., 2009).
Measurement model: This model was assessed through Unidimensionality, Loadings and Communalities, Discriminant validity and Cross loading. One needs to evaluate the outer model to estimate the inner model settings.
3 Results
3.1 Respondent profile and its influence on stress variables
Table 1 shows a brief description of the profile of respondents in terms of gender, nature of degree, graduation and years of study. Out of the 538 respondents, men accounted for 40.9%, while women amounted to59.1 % of total respondents. The majority of the students were from the Commerce department (39.6%), followed by the Science department (38.7%) and Arts department (16.0%), while the rest were from the Education and Management departments. With regards to Education, undergraduate students account for 70.8 %, while postgraduate students were 29.2 %. With regards to the years of study, the largest group was third year under-graduate UG (29.2%) and second year UG (27%) students. First-year UG students accounted for 17.1 %, while the second year PG students accounted for 13.0%. In case of first year post-graduate PG students, the value was 11.3 %. The smallest number of respondents was from the Education department i.e., 2.5 %. These details are tabulated below (Table 1). Legend: B.Ed - Bachelor of Education; UG – Undergraduate; PG – Postgraduate;
Frequency
Percentage
Gender
Male
220
40.9%
Female
318
59.1%
Nature of Degree
Science
208
38.7%
Arts
86
16.0%
Commerce
213
39.6%
B.Ed
15
2.8%
M.B.A
16
3.0%
Graduation
UG
381
70.8%
PG
157
29.2%
Years of Study
First year UG
92
17.1%
Second year UG
145
27.0%
Third year UG
157
29.2%
First year PG
61
11.3%
Second year PG
70
13.0%
First year B.Ed
3
0.6%
Second year B.Ed
10
1.9%
Fig. 1(a) shows attending the undergraduate final year students are under a lot of stress from the academic, family, social, personal, health and cognitive environment in comparison with first- and second-year undergraduate students. Final year undergraduate students also suffered from stress during the lockdown period. In line with this, the stress from academic, family, social, personal and cognitive environment was higher for final-year postgraduate students than the first year PG students. Concerning stress from health, levels were almost the same for first- and second-year students. At the end, first- and second-year undergraduate students showed contrasting results. While first-year Education students are under a lot of stress compared to second-year students. The observed stress score for first-year education students was in the range of 2.87 to 3.93, whereas final-year students’ stress levels were in the range of 2.40 to 3.20. This shows a significant difference between first-year education students and second-year students.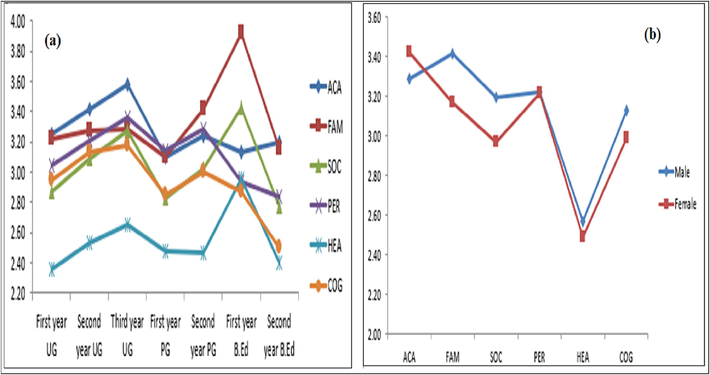
(a): Stress levels of academic, family, social, personal, health and cognitive environment during year of study; (b) Stress levels by male and female students during year of study.
Stress levels were found to be higher among male students than female students according to the Fig. 1(b). In academic environment, the stress level was slightly higher among women than men. Personal stress remained same for both male and female students. Family, social, health and cognitive types of stress were higher in male students than female students.
3.2 Cluster analysis
In order to identify the similarity and dissimilarity among constructs, the cluster analysis was conducted. The variables were clustered based on the Wald minimum variance measures, using different colors to identify the six constructs. This provides explanatory insight about variables that are linked with constructs. Due to mismatch between one another, few variables are dropped to arrive at the conceptual idea shows the final set of variables in Fig. 2 (a).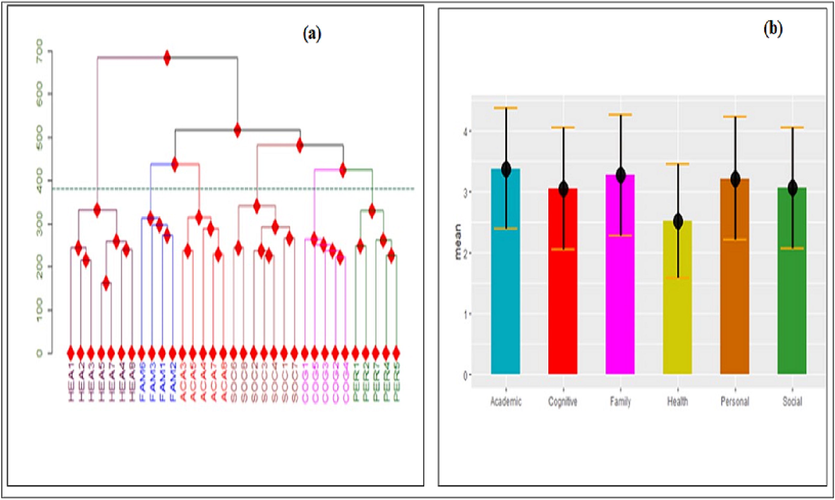
(a): Dendrogram showing similarities and dissimilarities among MVs; (b) Bar chart with mean and error of family, social, personal, health and cognitive environment.
For every construct, mean and standard deviation were computed on the basis of the average measure of its variables. Fig. 2 (b) shows the error bar chat that was drawn using R language with ggplot2 package. The bars illustrate the mean of every construct, while the head of the bars upside and downside show the plus or minus standard deviation. The constructs, such as academic environment, cognitive, family, personal and social mean values ranged between 3 and 5. This infers the intention of participants’ response towards their stress level. Meanwhile, the health mean value was 2.5, which is less than 3, thus denoting that stress related to health is less than other constructs.
Looking at Fig. 2 (b) it is possible to identify academic environment as the main factor responsible for stress level, followed by family, and personal is the third top factor. We would like also to highlight the weak influence that the health factor has on the level of stress.
3.3 Partial least Square-Structural Equation Modeling (PLS-SEM)
PLS-SEM is one of the non-parametric statistical tools that is generally used to develop the theoretical model. According to some researchers, it exhibits extraordinary statistical outcomes despite the small sample size, since it has no assumption about the distribution of data. However, it should not be far away from the normal so that the model significance can be assessed. The ordinary least square regression-based method is the usual procedure for estimating the parameters in PLS-SEM. PLS-SEM has two types of model constructions, namely the inner model and outer model. The relationship between latent constructs is explained in the inner model (structural model), which is shown in Fig. 3. The relationship between manifest variables and latent construct is explained in the outer model (measurement model). Few constructs, such as academic environment, family, social and personal, were exogenous latent constructs, while the endogenous latent constructs were health and cognitive. According to Fig. 3, the stronger relationships that can be identified are between the constructs” Personal” “Health”,”Personal” “Cognitive” and “Academic environment” “Cognitive”. Also, the weak relationship is between “Academic environment” and “Health”.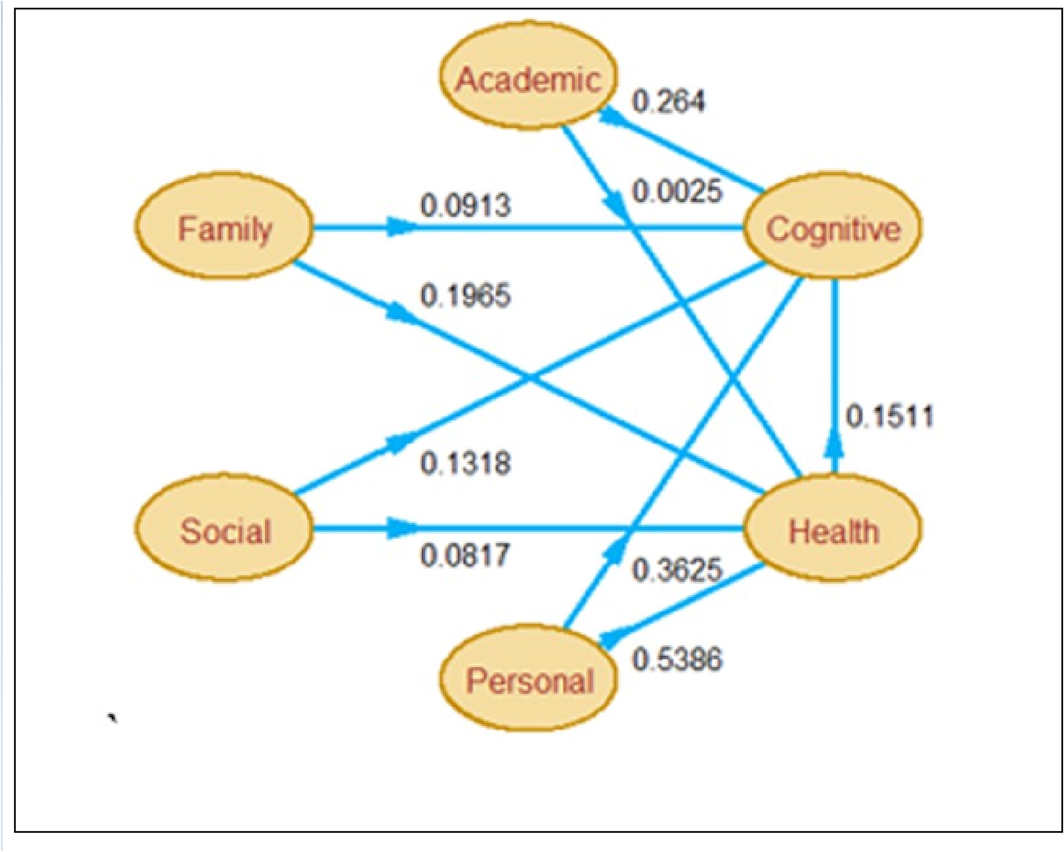
PLS-SEM diagram with regression coefficients of family, social, personal, health and cognitive environment of the students;
3.4 Measurement model:
This model was assessed through Unidimensionality, Loadings and Communalities, Discriminant validity and Cross loading. One needs to evaluate the outer model to estimate the inner model settings.
3.5 Unidimensional:
Unidimensionality represents the correlation between manifest variables and associated latent variables. When there is a change in the latent variable position (either decrease or increase), then the indicators associated with it also tend to change in the same direction. C. alpha, DG.rho and Eigen values are used to measure the unidimensionality and are illustrated in Table 2.
Constructs
Mode
MVs
C.alpha
DG.rho
eig.1st
eig.2nd
Academic environment
A
5
0.835
0.884
3.02
0.741
Family
A
4
0.760
0.848
2.33
0.661
Social
A
7
0.887
0.912
4.18
0.775
Personal
A
5
0.854
0.896
3.16
0.695
Health
A
7
0.886
0.911
4.16
0.728
Cognitive
A
5
0.899
0.926
3.57
0.520
3.6 Factor loadings and communalities
The correlation between a latent variable and its manifest variables is explained by the loadings of construct. Communality is no more than the square of loadings of a construct. Fig. 4(a) shows the loadings, whereas Fig. 4 (b) shows the communalities. The rule of thumb is that each manifest variable loading should be more than 0.7, which is satisfied in all the manifest variables under specified construct, while communality values above 0.49 is accepted.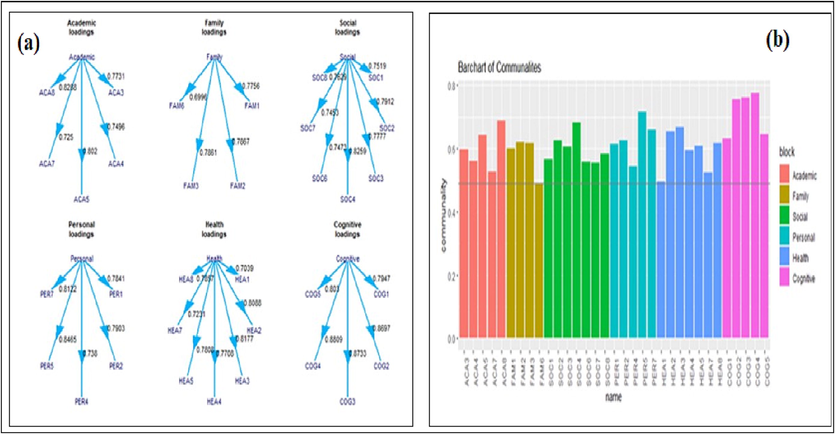
(a) Loadings of each Construct of family, social, personal, health and cognitive environment; (b) Communalities of each construct and its threshold value of family, social, personal, health and cognitive environment.
The communalities represent the amount of variability explained by a latent variable. When the communality value is greater than 0.5, it denotes that more than 50% of the variability in an indicator is captured by its latent construct. Fig. 4 shows that the current study meets the assumption made herewith.
3.7 Measurement model validity
The measurement model needs to be validated using Average Variance Explained (AVE), Construct Reliability (CR) and Discriminant Validity (DV), expressed as follows:
The AVE values of academic environment, family, social, personal, health and cognitive were 0.603, 0.582, 0.596, 0.632, 0.595 and 0.714, respectively. These observed AVE values were higher than 0.5 (Hair et al., 2017) and Construct Reliability values were higher than 0.7 (Cohen, 1988). Both AVE and CR met the requirement for model performance in the current study. Table 3 shows the Construct Reliability (CR) and Average Variance Extracted (AVE) values.
Construct
Type
AVE
CR
Decision
Academic environment
Exogenous
0.603
0.8835
Accepted
Family
Exogenous
0.582
0.8477
Accepted
Social
Exogenous
0.596
0.9117
Accepted
Personal
Exogenous
0.632
0.8955
Accepted
Health
Endogenous
0.595
0.9111
Accepted
Cognitive
Endogenous
0.714
0.9258
Accepted
One more DV form was developed with the help of cross loading of manifest variables. Table 4 shows the cross loading of each manifest variable. There are five manifest variables (MV) which measure highly loaded academic environments ranging from 0.725 to 0.829. Similarly, the four Manifest Variables (MVs) are highly loaded to family and range from 0.700 to 0.787. The seven MVs are highly loaded to social, ranging from 0.747 to 0.826, five MVs are highly loaded to personal and range from 0.738 to 0.847, seven MVs are highly loaded to health and range from 0.704 to 0.818 and five manifest variables are highly loaded to cognitive and range from 0.795 to 0.881. The cross loading of each manifest variable supports that these manifest variables are highly loaded to their underlying construct compared to other constructs. Therefore, these outcomes provide the adequate level of DV of constructs.
MVs
Academic
Environment
Family
Social
Personal
Health
Cognitive
ACA_3
0.773
0.385
0.411
0.431
0.341
0.484
ACA_4
0.750
0.409
0.402
0.443
0.386
0.49
ACA_5
0.802
0.440
0.452
0.474
0.372
0.516
ACA_7
0.725
0.335
0.386
0.385
0.258
0.461
ACA_8
0.829
0.452
0.514
0.526
0.432
0.624
FAM_1
0.418
0.776
0.418
0.383
0.329
0.42
FAM_2
0.355
0.787
0.377
0.395
0.446
0.432
FAM_3
0.451
0.786
0.450
0.445
0.440
0.493
FAM_6
0.375
0.700
0.454
0.380
0.379
0.397
SOC_1
0.409
0.458
0.752
0.470
0.384
0.462
SOC_2
0.458
0.417
0.791
0.486
0.390
0.510
SOC_3
0.454
0.392
0.778
0.478
0.379
0.476
SOC_4
0.478
0.414
0.826
0.552
0.419
0.529
SOC_6
0.404
0.478
0.747
0.526
0.494
0.528
SOC_7
0.409
0.370
0.745
0.462
0.387
0.461
SOC_8
0.426
0.458
0.763
0.644
0.520
0.577
PER_1
0.425
0.457
0.582
0.784
0.559
0.567
PER_2
0.511
0.464
0.613
0.790
0.543
0.659
PER_4
0.381
0.321
0.422
0.738
0.526
0.518
PER_5
0.514
0.426
0.546
0.847
0.566
0.649
PER_7
0.490
0.418
0.518
0.812
0.583
0.619
HEA_1
0.330
0.355
0.392
0.524
0.704
0.459
HEA_2
0.327
0.409
0.406
0.544
0.809
0.497
HEA_3
0.357
0.397
0.434
0.577
0.818
0.519
HEA_4
0.405
0.416
0.468
0.576
0.771
0.527
HEA_5
0.362
0.425
0.438
0.473
0.781
0.458
HEA_7
0.321
0.386
0.412
0.481
0.723
0.466
HEA_8
0.409
0.449
0.448
0.585
0.786
0.565
COG_1
0.602
0.463
0.501
0.571
0.447
0.795
COG_2
0.552
0.478
0.556
0.659
0.547
0.870
COG_3
0.546
0.518
0.623
0.656
0.620
0.873
COG_4
0.577
0.506
0.567
0.696
0.585
0.881
COG_5
0.557
0.456
0.537
0.626
0.535
0.803
3.8 Assessment of Structural model
The Structural Model is explained in Eqs. (4) and (5). The coefficient of each construct was estimated using PLS-SEM procedures. The estimated coefficients are given in Table 5.
*** p less than 0.001, ** p less than 0.01, *p less than 0.05 Social significance at Health at10 %.
H
Hypothesized path
Estimate (β)
Std. Error
t-value
Decision
H1
Academic environment → Health
0.0025
0.0395
0.0641
Not Significant
H2
Family → Health
0.1960
0.0382
5.1500***
Highly Significant
H3
Social → Health
0.0817
0.0435
1.8800
Not Significant
H4
Personal → Health
0.5390
0.0436
12.400***
Highly Significant
H5
Academic environment → Cognitive
0.2640
0.0320
8.2400***
Highly Significant
H6
Family → Cognitive
0.0913
0.0317
2.8800**
Highly Significant
H7
Social → Cognitive
0.1320
0.0354
3.7200***
Highly Significant
H8
Personal → Cognitive
0.3630
0.0400
9.0500***
Highly Significant
H9
Health → Cognitive
0.1510
0.0351
4.3100***
Highly Significant
Where:
The proposed nine hypotheses must be examined based on the estimated regression coefficients and their significance (Table 5). The significant value of academic environment ( = 0.0025, t = 0.0641) and social ( = 0.0817, t = 1.8800) towards health was more than 0.05, yet insignificant at 5% alpha level. This result infers that both academic environment and social factors do impact the health of the respondents. The significant values of family ( = 0.1960, t = 5.1500***) and personal ( = 0.5390, t = 12.400***) towards health were less than 0.001, yet significant at 0.1 % alpha level. This phenomenon infers that both family and personal impact the health of respondents. Out of these two constructs, personal seems to influence the health of the respondents significantly. The significant values of academic environment ( = 0.2640, t = 8.2400***), social ( = 0.1320, t = 3.7200***), personal ( = 0.3630, t = 9.0500***) and health ( = 0.1510, t = 4.3100***) towards cognitive stress were less than 0.001, but highly significant at 0.1 % alpha level. However, the significant value of family ( = 0.0913, t = 2.8800**) was less than 0.01, but significant at 1% alpha level. The regression coefficients of structural model were found to be significant at alpha level. However, there is still a requirement to evaluate the overall fitting model using fit indices. To quantify model efficacy, the coefficients of determination and Goodness of Fit (GoF) are the two fit indices generally used. The coefficient of determination is the amount of variance which is shown in the latent endogenous construct by the latent exogenous constructs. The GoF index helps assess the performance of both the outer (measurement) model and the inner model (Structural Model).
The estimated R-square value was 0.527, which underscores the relationship between health and academic environment, family, social and personal. Health is explained through the amount of variance, i.e., 52.7 %,in the constructs academic environment, family, social and personal. Similarly, the estimated R-square value was 0.690, which proves the relationship that exists between cognitive stress and academic environment, family, social, personal, health. The cognitive stress explains the amount of variance, i.e., 69.0%,inconstructs such as academic environment, family, social, personal and health. The GoF index is computed as the geometric mean of the average communality and the average R-square value. The GoF index value 0.6134 was observed for the developed model. The prediction power of the model was good at 61.34 % and it can be concluded that the derived model possesses high explanatory power in terms of performance of both outer and inner models.
4 Discussion
This paper aims to study a set of factors (academic environment, family, personal, cognitive, social and health) which are responsible for higher levels of stress among students who used the e-learning platforms during COVID-19 pandemic. To reach this objective a questionnaire was sent by email to students enrolled in Indian higher education institutions and a set of statistics tools were developed, in particular the PLS-SEM (Popa et al., 2022). Exploring the demographic characteristics of the sample (Fig. 1(a-b) it is possible to infer that students in their final year face more stress than the other undergraduate and postgraduate students. This result was also reached in previous research (Tang et al., 2020; Mardiana et al., 2020) justifying that students who are enrolled in the final year at university had short sleep durations which contributes more likely to experience Post-Traumatic Stress Disorder (PTSD) and symptoms of depression. Moreover, first-year students experienced more stress than final-year students in the Education stream. Comparing gender, male students were found to be more stressed than female students (Bermejo-Franco et al., 2022).
By applying the PLS-SEM methodology it was possible to conclude that students experienced more stress under academic environment, family, and personal factors. The stress levels of cognitive and social were found to be equally distributed among higher education students, but less than academic environment, family and personal. There is some stress that comes from health. Fig. 1(b) highlights that stress is present data considerable level and, in all factors, except health. According to Liu et al., (2021) this result could be justified by high levels of psychological resilience developed by students throughout the pandemic period. However, this result is contrary to Khan et al., (2020) research that concluded that the fear of becoming affected with COVID-19 together with the absence of physical exercise, uncertainty about the pandemic trajectory and lack of information were identified as risk factors for mental health among university students in Bangladesh. Furthermore, the fear of being infected and the perceived high risk of becoming infected were also identified to impact university students’ mental health in China Jiang (2020). Also, a study by Goodman et al., demonstrated that 60% of students living in the U.S. reported a negative impact of the pandemic on their mental health (Goodman et al., 2020).
The relationship among the stress factors, determined by using the PLS-SEM, one can conclude that stress from family and personal proved to have a positive influence on health-related stress. Personal stress gained the prominent position when it comes to students’ health family-related stress. There is also no impact created by academic environment and social stress on health. Cognitive stress is heavily impacted by personal and academic environment stress. Both social and health stress have equal impact on cognitive stress, while the stress from family was the factor that least contributed to cognitive stress. When students mitigate their stress levels from personal and academic environment, cognitive stress is largely relieved (Tang et al., 2020; Mardiana et al., 2020).
The Cronbach’s alpha values of academic environment, family, social, personal, health and cognitive were 0.835, 0.760, 0.887, 0.854, 0.886 and 0.899, respectively. These values are considered higher than the rule of thumb 0.7 (Hair et al., 2012). If the Cronbach’s alpha value is higher than 0.7 it is ‘good’ but it is excellent if it is over 0.8 (George & Mallery, 2003). These measures explain how much better a block of variables measure against its corresponding latent construct. The estimated measure values of DG.rho of six constructs were higher than the 0.7 threshold, supporting the one-dimensionality of constructs. The estimated first Eigen values were higher than 1, while the second Eigen values were less than 1, yet again proving the unidimensionality. These three measures confirm good correlation between manifest variables and their corresponding construct.
This framework clearly details the role of the interactions between environmental factors, relationships, learning opportunities and among the students with physical, psychological, cognitive, social, and emotional processes that influence one another—both biologically and functionally - in shaping student development and learning. One of the best ways to address this gap is to extend learning time. The ‘Study on Social and Emotional Skills’ is the first international effort of this kind to develop a comprehensive set of metrics around social and emotional skills, which are specifically developed to enhance the policies that improve development and student well-being. This knowledge base highlights the progress required in the education system that was designed a century ago based on factory-model concepts, in which privileged standardization was followed with minimal relationships (Leiringer & Cardellino, 2011). This further infers the importance of developing a college/university system around developmental support relationships; coherent and well-integrated approaches to support home and school connections, among others; well-scaffolded instruction that intentionally supports the development of social, emotional, and academic skills, habits, and mindsets; and culturally competent, personalized response to the assets and needs of each student.
5 Conclusion
To conclude, the current study results provide the empirical evidence to support the theoretical distinction between regulation of cognition, motivation, behavior, and context. The four areas of SRL are distinguishable processes that address the important and unique aspects of student learning. The results drawn from this research are that students experienced more stress due to sudden changes in the academic environment, family, and personal factors. The current research work contributes to the field by further exploring these gaps and the relationship between different aspects of SRL and by suggesting the unique role of each aspect in students' learning achievements. Policy-makers can take note of the current study’s observations in continuing their fight against COVID-19 pandemic by improving the stability for student risk groups.
Acknowledgments
The authors express their sincere appreciation to the Researchers Supporting Project Number (RSP2023R466) King Saud University, Riyadh, Saudi Arabia. We are very much grateful to Prof. Keith Gomes, Social Scientist(Medical and psychiatric), Student Counselors, Loyola College and Dr. Subbulakshmi Natarajan MBBS, DCN (Lond) Ph.D Head of Academic Service and Research, The Institute of Neurological Sciences, VHS Hospital Chennai.
Declaration of Competing Interest
The authors declare that they have no known competing financial interests or personal relationships that could have appeared to influence the work reported in this paper.
References
- Psychological well-being during COVID-19 lockdown: Insights from a Saudi State University's Academic Community. Journal of King Saud University. Science.. 2021;33(1):101262
- [CrossRef] [Google Scholar]
- Determinants, predictors and negative impacts of burnout among health care workers during COVID-19 pandemic. Journal of King Saud University. Science.. 2023;35(1):102441
- [CrossRef] [Google Scholar]
- Stress Management: Psychological Foundations. Upper Saddle River, N.J.: Prentice Hall; 1998.
- Drug misuse among university students in the UK: implications for prevention. National Library of Medicine.. 2014;49(4):448-455.
- [CrossRef] [Google Scholar]
- Gender Differences in Psychological Stress Factors of Physical Therapy Degree Students in the COVID-19 Pandemic: A Cross-Sectional Study. Int. J. Environ. Res. Public Health. 2022;19(2):810.
- [CrossRef] [Google Scholar]
- Carmines, E. G., McIver, J. P. Analyzing Models with Unobserved Variables: Analysis of Covariance Structures. In G. W. Bohrnstedt, & E. F. Borgatta (Eds.), Social Measurement: Beverly Hills: Sage Publications, Inc.1981, pp.65-115.
- Caskey, M. and Anfara, V.A. 2007. Research Summary: Young Adolescents’ Developmental Characteristics. National Middle School Association, 2007. https://www.amle.org/BrowsebyTopic/WhatsNew/WNDet/TabId/270/ArtMID/888/ArticleID.
- Stress, depression, and anxiety among undergraduate nursing students. Int. J. Nurs. Educ. Scholarsh.. 2013 Nov;7:10.
- [CrossRef] [Google Scholar]
- Implications for educational practice of the science of learning and development. Appl. Dev. Sci.. 2020;24(2):97-140.
- [CrossRef] [Google Scholar]
- Academic stress, parental pressure, anxiety and mental health among Indian high school students. International Journal of Psychology and Behavioral Science. 2015;5(1):26-34.
- [Google Scholar]
- Goff, A. Stressors, Academic Performance, and Learned Resourcefulness in Baccalaureate Nursing Students [Electronic Version]. International Journal of Nursing Education Scholarship, 2011, 8, 1-15. https://doi.org/10.2202/1548-923X.2114.
- Goodman, J., Wang, S.X., Ornelas, R.A.G., Santana, M.H. 202. Mental health of undocumented college students during the COVID-19 pandemic. medRxiv, p. 2020.09.28.20203489, 2020.
- Graham, M. M., Higginson, L., Brindley, P. G. Jetly, R. 2020. Feel better, work better: the COVID-19 perspective. Canadian Journal of Cardiology. 36, pp,789–791. 10.1016/j.cjca.2020.04.012.
- Hair, J. F., Sarstedt, M., Pieper, T. M., & Ringle, C. M. The use of partial least squares structural equation modeling in strategic management research: A review of past practices and recommendations for future applications. Long Range Planning: International Journal of Strategic Management, 2012, 45(5-6), 320–340. https://doi.org/10.1016/j.lrp.2012.09.008.
- A Primer on Partial Least Squares Structural Equation Modeling (PLS-SEM) (2nd Edition). Thousand Oaks, CA: Sage Publications Inc.; 2017.
- Henseler, J., Ringle, C. M., & Sinkovics, R. R. 2009. The use of partial least squares path modeling in international marketing. In Advances in International Marketing| Advances in International Marketing, 2009, Vol. 20, pp. 277-319. Emerald Publishing Limited. https://doi.org/10.1108/S1474-7979(2009)0000020014.
- Knowledge, attitudes and mental health of university students during the COVID-19 pandemic in China. Child Youth Serv. Rev.. 2020;119:105494
- [CrossRef] [Google Scholar]
- The impact of COVID-19 pandemic on mental health & wellbeing among home-quarantined Bangladeshi students: a cross-sectional pilot study. J. Affect. Disord.. 2020;277:121-128.
- [CrossRef] [Google Scholar]
- Condoms, sex, and sexually transmitted diseases: Exploring sexual health issues among Asian-Indian college students. Sexuality & Culture: An Interdisciplinary Quarterly. 2014;18(3):649-663.
- [CrossRef] [Google Scholar]
- Perceived Medical School stress of undergraduate medical students predicts academic performance: An observational study. BMC Med. Educ.. 2017;171:256.
- [Google Scholar]
- Kivimaki M (2009) Cortisol secretion and fatigue: associations in a community based cohort. Psychoneuroendocrinology. 2009;34:1476-1485.
- [CrossRef] [Google Scholar]
- Schools for the twenty-first century: School design and educational transformation. Br. Educ. Res. J.. 2011;37(6):915-934.
- [Google Scholar]
- Interpreting and using student ratings data: Guidance for faculty serving as administrators and on evaluation committees. Stud. Educ. Eval.. 2017;54:94-106.
- [CrossRef] [Google Scholar]
- Association between perceived stress and depression among medical students during the outbreak of COVID-19: The mediating role of insomnia. J. Affect. Disord.. 2021;292:89-94.
- [Google Scholar]
- The Chinese high school student’s stress in the school and academic achievement. Educ. Psychol.. 2011;311:27-35.
- [Google Scholar]
- Mardiana, N., Farhansyah, A., Nurdiawan, O., Nurhayati, L., Risnanto, S., Nurwathi, A. COVID-19 Website Quality Towards User Satisfaction and Intention To Use Analysis Using Partial Least Square-Structural Equation Modeling. 2020 14th International Conference on Telecommunication Systems, Services, and Applications (TSSA, Bandung, Indonesia, 2020, pp. 1-5, doi: 10.1109/TSSA51342.2020.9310808.
- Mohammedqasem, R., Mohammedqasim, H., Asad Ali Biabani, S., Ata, O., Alomary, M. N., Almehmadi, M., Amer Alsairi, A., & Azam Ansari, M. Multi-objective deep learning framework for COVID-19 dataset problems. Journal of King Saud University. Science.2023, 35(3), pp. 102527. https://doi.org/10.1016/j.jksus.2022.102527.
- Sociocultural study on solar photovoltaic energy system in India: Stratification and policy implication. J. Clean. Prod.. 2019;216:461-481.
- [CrossRef] [Google Scholar]
- Modelling the COVID-19 Pandemic Effects on Employees’ Health and Performance: A PLS-SEM Mediation Approach. Int. J. Environ. Res. Public Health. 2022;19:1865.
- [CrossRef] [Google Scholar]
- Richa C. COVID-19 Pandemic: Impact and strategies for education sector in India. 2020, https://government.economictimes.indiatimes.com/news/education/covid-19-pandemic-impact-and-strategies-for-education-sector-in-india/75173099.
- The stress of life. New York: McGraw-Hill; 1956.
- Effects of academic stressors and coping strategies on stress responses, feeling of self-growth and motivation in junior high school students. Jpn. J. Educ. Psychol.. 1998;464:442-451.
- [Google Scholar]
- Prevalence and correlates of PTSD and depressive symptoms one month after the outbreak of the COVID-19 epidemic in a sample of home-quarantined Chinese university students. J. Affect. Disord.. 2020;274:1-7.
- [Google Scholar]
- UNESCO. (2020, March 4a). 290 million students out of school due to COVID-19: UNESCO releasesfirst global numbers and mobilizes response. Retrieved April 17, 2020, from UNESCO: https://en.unesco.org/news/290-million-students-out-school-due-covid-19- unesco-releases-first-global-numbers-and-mobilizes.
- WHO (2020). Situation reports. Available at https://www.who.int/emergenccies/diseases/novel-coronavirus-2019/situation-reports/ accessed April 20, 2020.


