

Translate this page into:
Carbon sequestration potential of reserve forests present in the protected Margalla Hills National Park
⁎Corresponding authors. smkhan@qau.edu.pk (Shujaul Mulk Khan)
-
Received: ,
Accepted: ,
This article was originally published by Elsevier and was migrated to Scientific Scholar after the change of Publisher.
Peer review under responsibility of King Saud University.
Abstract
Objective
Protected areas are of immense importance to enhance the functional role of plants due to abundance of woody species, their carbon sequestration ability and the rich organic matter and hence it needs to be documented and quantified scientifically with special focus on its carbon sink potential.
Mathods
In this study, the Carbon sequestration, diversity and abundance of woody plants were evaluated in the Margalla Hills National Park (MHNP), Pakistan using quantitative and functional ecological approaches. We randomly sampled 40 (20 m × 20 m) plots from March, 2020 to March, 2021. PC-ORD version-5 and CANOCO software were used to evaluate relationships of different environmental factors with species composition, distribution pattern and other quantitative traits of forests. R program was used for regression and correlation analyses to model Carbon sequestration capacity of MHNP.
Results
A total of 4916 individuals belonging to 49 species and 28 families were reported. The higher carbon sequestration was found in Albizia lebbeck 2620.75 lbs per year followed by Pinus roxburghii 2214.48 lbs and Castanea sativa 1731.59 lbs while the lower rate of carbon dioxide sequestration per year were found in Myrsine africana 1.81 (lbs) followed by Nerium oleander 2.84 (lbs) and Jasminum officinale 3.92 (lbs). The Two-way Cluster Analysis shows the distribution of species in the study area. The CCA analysis show that pH, EC, and TDS play a significant role in the distribution of woody plant vegetation. Carbon sequestration mainly depends on plant DBH, followed by plant crown.
Conclusion
The results prove that the DBH has a leading role in the carbon sequestration rather than height of the woody species. The present study indicates the MHNP is a rich source of woody plant vegetation because of its conserve nature and plays a significant role in ecosystem stability and air quality, therefore, more studies are required to study other aspects of the woody plant vegetation in the MHNP.
Keywords
Margalla Hills National Park
Woody Plants
Carbon sequestration
Diversity
Protected Forests

- MHNP
-
Margalla Hill National Park
- CCA
-
Canonical Correspondance Analysis
- DBH
-
Diameter at Breast Height
Abbreviations
1 Introduction
The Himalayas and Hindu Kush are considered as complex and dynamic ecosystems on surface of the earth (Mani 1978, Khan et al., 2016, Khan, Page et al. 2012, Zeb et al., 2021). It has a range of species and forest types due to its varying altitude, topography, and climatic condition (Khan et al., 2020, Khan, et al., 2012). This mountainous range is supporting massive floristic diversity along with larger amount of carbon stock (Sharma, Baduni et al. 2010, Dar and Somaiah 2015, Dar and Sundarapandian 2015). It is recognised as one of the important global biodiversity hotspots and harbours nearly 8,000 flowering plant species, out of which 25.3% are endemic.
The woody plants diversity defines the forest ecosystem's entire biodiversity as it affect the shrubby and herbaceous layers significantly (Huang, Pohjonen et al. 2003, Kumar and Sharma 2015). Trees play a vital role in defining forest ecosystem structural, functional, and environmental complexity, heterogeneity litter fall, organic matter on forest floor and hence fertility of the soil (Anwar et al., 2019; Bano et al., 2018). In turn these traits enhance plant abundance, individuals' heights, DBH and plant crown depth (Christanty, Mailly et al. 1996, Roxburgh, Wood et al. 2006). The sequestration concept is very complex and needs explanations in terms of amounts, compositions, ages, localities of forest types and soil. Approximately, 53% of carbon is stored in Temperate and Boreal regions while the remaining 37 % is stored in the Tropical regions of the world (Sohngen and Sedjo 2006). In the forest ecosystems carbon sequestration is carried out through trees biomass. About 50% of tree dry biomass is considered as carbon (Malhi, Meir et al. 2002). Generally, reducing the atmospheric CO2 and storing it in in any other media rather than atmosphere are the plants in general and trees in particular. Trees store the most carbon because of its large volume and long-live storage such as; trees trunks, leaves, wood, roots, as well as the soil in which the plant exist unless they are decomposed or burnt (Toochi, 2018). Quantification of sequestred CO2 has recently been one of the prime interst of the scientific community.
Rapid increase in the concentration of the greenhouse gases, especially, Carbon dioxide, Methane, and Methane dioxide are the major causes for climate change according to the IPCC, 2007 report. According to UNCED signed by 153 nations of the world in 1992 emphasized that GHGS should be reduced in the atmosphere to protect atmosphere and overcome the global warming. According to the scientific communities around the globe, increasing level of carbon dioxide and other greenhouse gasses lead to global warming, which is the matter of great concern. Carbon dioxide is the main contributing agent in climate change and global warming. After industrial revolution the global emission of the carbon dioxide has increased by 18% which damaged the environment by reaching to the highest level after 1750 (Chavan and Rasal 2012). Due to carbon sequestration, plants increase soil infiltration capacity, decrease wind and water erosions, improve the quality of water, decrease carbon emission, imped pesticides movement and enhance environmental quality. In short carbon capturing, and conservation planning are imperative for the present day global resources and our future quality of life (Solomon 2007).
Furthermore, the national parks are the main source to increase plant abundance and composition and hence the Carbon sequestration (Asmat et al., 2022; Nazakat et al., 2021). Protected forests are of much bigger importance in mitigating climate change and enhancing carbon sequestration potentials (Ruddell, Sampson et al. 2007; Iqbal et al., 2021). Forest ecosystem are the largest source of carbon sequestration on the surface of the earth and cost-effective approach for mitigating greenhouse gas emissions (Domke, Oswalt et al. 2020). In the last 40 years protected areas has increase tripled, 15.4% of the world terrestrial areas, and still lies behind the Convection on Biological Diversity target which needs at least 17% by 2020 (Nazakat et al., 2022; Asmat et al., 2021; Juffe-Bignoli, Burgess et al. 2014). Approximately, 20% of ecosystem carbon stock is stored in the protected areas out of all carbon stock of terrestrial ecosystem (Melillo, Lu et al. 2016). For determination that whether the biodiversity protection and ecosystem services of the protected areas have attained their preferred goal, it is essential to study the protected areas with special reverence to carbon sequestration capacity (Andam, Ferraro et al. 2008, Larkin, Chiarion-Sileni et al. 2015).
Few studies are available on carbon sequestration from disturb ecosystem (Ali et al., 2022, Terakunpisut, Gajaseni et al. 2007, Afzal and Akhtar 2013) but no detailed information has been found from protected regions. Therefore, current study was designed to evaluate the role of woody plants height, DBH and abundance in relation with carbon sequestration. In this study, we aim to (1) explore the distribution of woody plant species and their role in carbon sequestration (2) understand the role of height and DBH in the carbon sequestration and (3) estimate average carbon sequestration for woody plant species (in terms of taxon) of the study area.
2 Materials and methods
2.1 Study area
The Margalla Hills National Park (MHNP) is located in the lower Himalayas mountain range between 33043′N and 72055′E. It covers approximately 17,386 ha area with an elevation range from 450 to 1580 m above sea level (Iqbal et al., 2021, Jabeen, Khan et al. 2009). The MHNP has subtropical to semi arid climatic conditions. Its topography is irregular with sheer slopes. The soil is ranging from dark brown to yellowish-brown in color with fine texture (Hijazi 1984). The maximum and minimum average temperature is ranging from 34.3°C to 3.4°C with 1200 mm/year average precipitation (Shinwari and Khan 2000) (Figs. 1-2).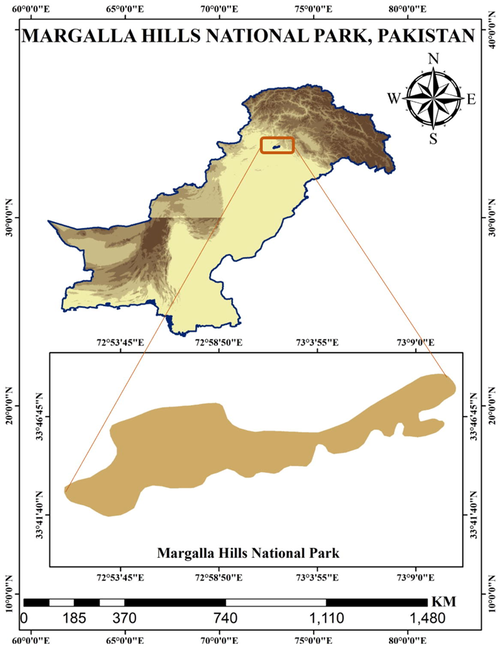
Map of the Margalla Hills National Park (MHNP), Pakistan.
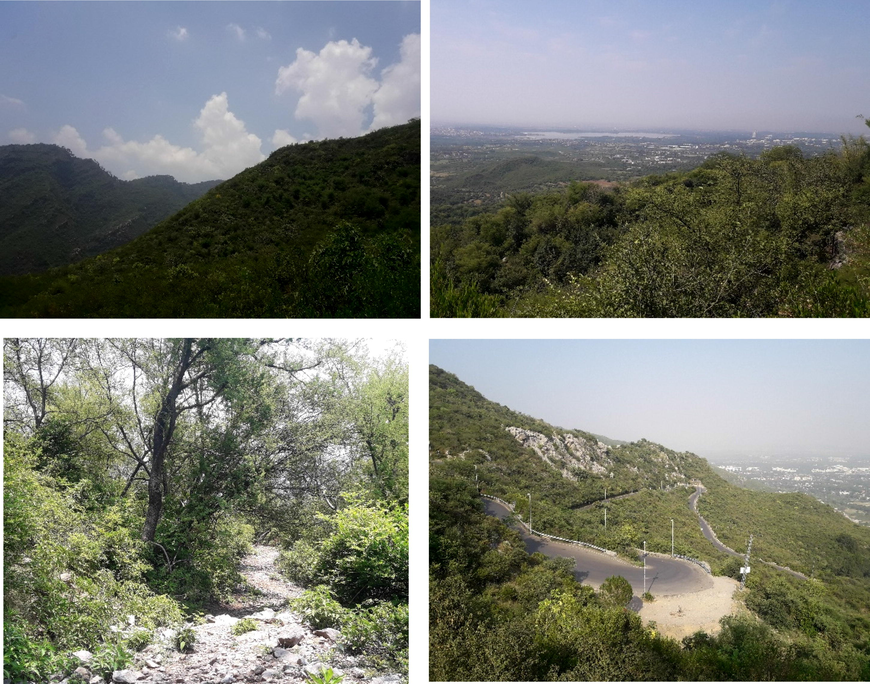
Different sites of Margalla Hills National Park, Lesser Himalayas, Pakistan.
2.2 Data collection using quantitative ecological techniques
We have randomly sampled 40 (20 m × 20 m) plots in MHNP lesser Himalayas from March 2020 to March 2021. Each plot was established at a distance of one km or 20 m altitudinal variation (Manan et al., 2020). All woody plant individuals having diameter at breast height (DBH) ≥ 1 cm were noted and quantified within each plot. The tree height and DBH was measured using a clinometer; DBH and the crown depth were meaured via measuring tape. All woody plants present in the plot were identified and confirmed from plants lists available at http://www.efloras.org/flora_page.aspx?flora_id=5 and http://www.theplantlist.org/tpl1.1/search. Geographical coordinates, aspect, slop and elevation of each plot were noted using GPS (geographical positioning system) and kilinometer.
2.3 Estimation of CO2 sequestration
Carbon sequestration for each woody tree species were assessed through mean diameter at breast height (mDBH) and mean tree height (mTH).
2.4 Determining total tree green weight
The following algorithmic equation were applied for weighting the Carbon sequestration of woody plant species for 10 years.
W = above ground weight of the tree in pounds (lbs).
D = Diameter of the trunk in inches.
H = Height of the tree in feet.
The green weight is alive tree's weight. First we calculated the green weight of above-ground following Clark III, & Saucier et al. 1986.
Wabove-ground = 0.15 × D2 × H (for trees with D > 11).
The underground system weight of the tree is about 20% of the above-ground weight. Therefore, we calculated the total green weight of the tree by multiplying the above-ground weight by 1.2.
W total green weight = 1.2 × Wabove ground weight.
The total average mass of the tree is almost 72.5% dry matter and moisture content of the tree is 27.5%, the dry weight of the tree was calculated by multiplying total green weight of the tree with 0.725 (DeWald 2005).
W Dry weight = 0.725 × Wtotal green weight.
The average carbon contents in the tree is generally 50% of the total tree volume (Toochi, 2018; DeWald, 2005). Thus, we determined weight of carbon in the tree by multiply the dry weight of tree by 50% or 0.5.
Wcarbon = 0.5 × WDry weight.
The chemical composition of CO2 is equal to one molecule of Carbon and two molecules of Oxygen. The Carbon atomic weight is 12.001115 and the Oxygen atomic weight is 15.9994 therefore the determination of CO2 weight in trees is the ratio of CO2 C + 2 × O = 43.999915C (Carbon) is 43.999915/12.001115 = 3.6663. Thus, we have determined the weight of sequestered carbon dioxide in the tree, multiply by the carbon weight in the tree by 3.6663 rounded to 3.67 (Toochi, 2018).(Afzal and Akhtar 2013).
Wcarbo-dioxide = 3.67 × Wcarbon.
2.5 Soil analysis
Soil samples were taken up to 20 cm depth in each plot at three points and mixed thoroughly for further analyses. The samples were kept in the polythene bag, labeled, dried at room temperature and the chemical properties were measured. The soil (pH), Electrical Conductivity (EC), and Total Dissolved Solids (TDS) were determined using pH, EC, and TDS meter, respectively. The soil pH was determined following the methods of McLean 1982 & Russel RL060P. Soil bulk density (SBD) was assessed using Al-Shammary, Kouzani et al. 2018 methods.
2.6 Data analysis
Linear regression analyses were performed to find out the impact of independent variable on dependent variable. We have find out the correlation among all the measured variables. The data were further analysed to evaluate woody plant species and impact of environmental factors. Two-way Cluster Analysis (TWCA) was performed in order to know the distribution of each plant species at each plot using PC-ORD version-5 software (McCunc and Mefford, 1999). Direct gradient analysis i.e., Canonical Correspondence Analysis (CCA) and indirect gradient analysis i.e., Detrended Correspondence Analysis (DCA) were performed using CANOCO software.
3 Results
A total of 4916 woody plant individuals belonging to 49 different species and 28 plant families were recoded from MHNP. The maximum mean Diameter at Breast Height (DBH) was observed in A. lebbeck followed by P. roxburghii, C. sativa, and B. ceiba, while the minimum DBH were shown by M. africana, followed by J. officinale, N. oleander, and J. adhatoda. The maximum plant mean height was observed in P. roxburghii, followed by C. sativa, A. lebbeck, and B. ceiba, while the minimum plant height was noted in M. africana, followed by N. oleander, J. adhatoda, and J. officinale. The maximum crown depth was perceived by C. sativa followed by P. roxburghii, B. papyrifera, and C. spinosum while the minimum crown depth was recorded in M. africana followed by J. adhatoda, N. oleander, and L. camara (Supplementary Table 1). ***p < 0.01, ** p < 0.05, * p < 0.1.
Wcarbondioxide lbs/1y
Coef.
St.Err.
t-value
p-value
[95% Conf
Interval]
Sig
No of Spp.
−1.211
0.762
−1.59
0.119
−2.747
0.326
Mean Height (feet)
0.659
0.264
2.49
0.017
0.126
1.192
**
Mean DBH (inches)
32.703
3.257
10.04
0.000
26.140
39.267
***
Mean Crown depth (feet)
2.733
1.068
2.56
0.014
4.886 0.580
**
Constant
400.021
74.197
5.39
0.000
549.556
250.486
***
Mean dependent var
278.421
SD dependent var
485.344
R-squared
0.792
Number of obs
49.000
F-test
41.935
Prob > F
0.0001
Akaike crit. (AIC)
677.174
Bayesian crit. (BIC)
686.633
3.1 Carbon dioxide sequestration
Carbon dioxide sequestration data was analysed through Linear regression. It showed that the DBH (PV = 0.0001), crown depth (PV = 0.014), and height of plant (PV = 0.017) have significant effect on carbon dioxide sequestration. At the same time, number of plants (PV = 0.119) has an insignificant effect on carbon dioxide sequestration in the region (Table. 2 & Figs. 3–4).
Wcarbondioxide / 1y
No of Spp.
Mean H (feet)
Mean DBH (Inches)
Mean Crown depth (feet)
W carbondioxide / 1y
1.0000
No of Spp.
0.1530
1.0000
Mean H (feet)
0.0709
0.9564
1.0000
Mean DBH (Inches)
0.8664
0.2861
0.1849
1.0000
Mean Crown depth (feet)
0.5611
0.2596
0.1422
0.6462
1.0000
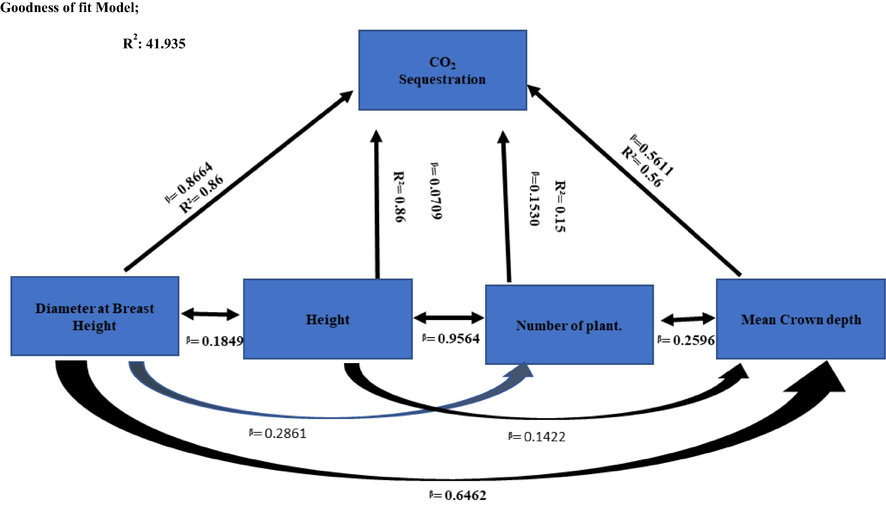
Model evaluating the impact of MDBH-I = mean dbh in inches, MH-F = mean height in feet, TNP = total Number of plant, MCD = Mean Crown depth on sequestration of Carbon dioxide.
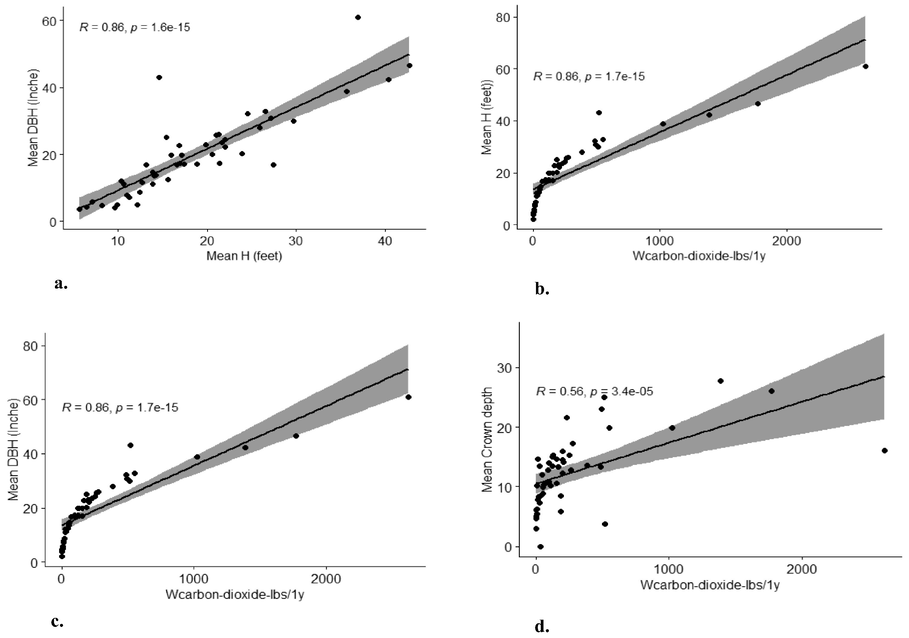
Regressions analyses a. MDBH-I = mean dbh in inches, and Co2-Lbs/1y = carbon dioxide weight in pound per one year. b. MH-F = mean height in feet, and Co2-Lbs/1y = carbon dioxide weight in pound per one year. c. MDBH-I = mean dbh in inches, and MH-F = mean height in feet.
The correlation between variable shows that the DBH (R2 = 0.86; β = 0.8664), crown depth (R2 = 0.56; β = 0.5611), and height of plant (R2 = 0.86; β = 0.0709) have significant correlation, while number of plant (R2 = 0.15; β = 0.1530) has weak correlation and impact (Tables 2–3; Figs. 3- 4).
Variable
Obs.
Mean
Std. Dev.
Min
Max
Wcarbon dioxide /1y
49
278.4215
485.3437
1.44867
2620.752
No. of Spp.
49
100.3265
254.2615
1
1329
Mean DBH Inches
49
19.99096
12.17551
3.668148
60.87044
Mean Crown depth (feet)
49
3.869375
1.759864
0.92
8.47
Mean Height (feet)
49
18.60076
8.476437
5.620035
42.74685
3.2 Two-way Cluster analysis
Two-way cluster analysis representing the presence and absence of woody plant species at each plot in the studied national park. The dendrogram was constructed using 1, 0 data of woody plant species. The black dots show the presence and white dots show the absence of woody plant species (Fig. 5).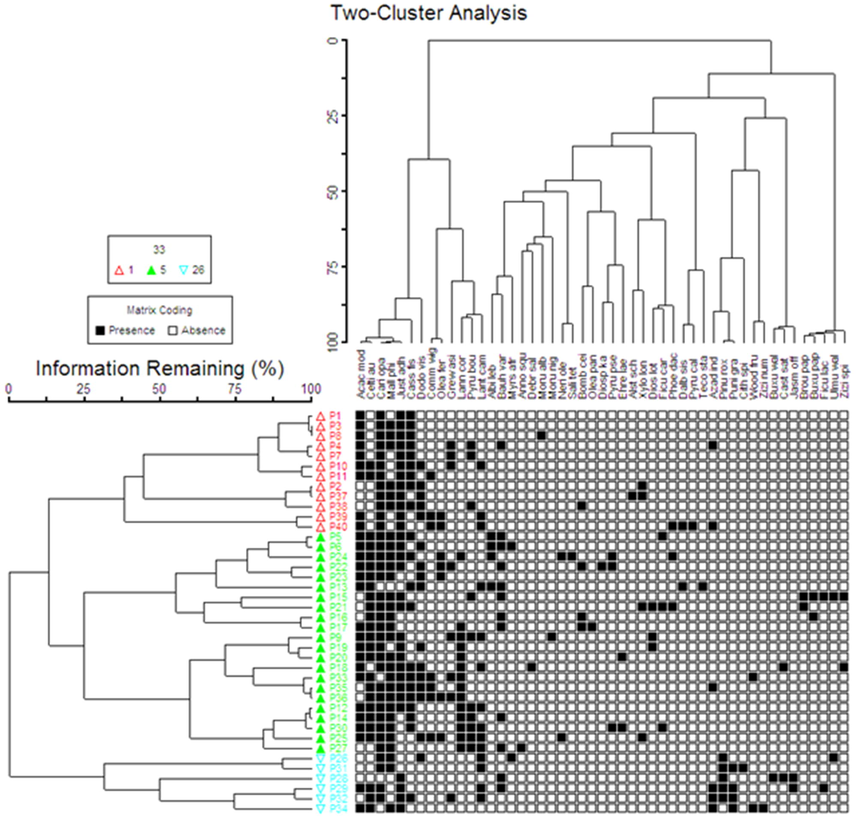
Distribution of woody plant species in MHNP.
3.3 Direct gradient analyses
The impact of analysed environmental variable were elevation, aspect, slope, SBD, LFD, LFW, pH, TDS, and EC. Each triangle represent sampled plot and the space between them, showing the similarity and differences index. The CCA showed the distribution of woody plants in relation to the environmental variables. First quadrant of CCA bi-plot showed the woody plants distribution under the impact of higher SBD, LFW, LFD, and aspect. The second quadrant clustered majority of the plant species under the influence of TDS. Whereas, in the 3rd quadrant majority of the woody plants were under the impact of pH, and EC. While the 4th quadrant plots gathered under high elevation and slope angle (Fig. 6-B).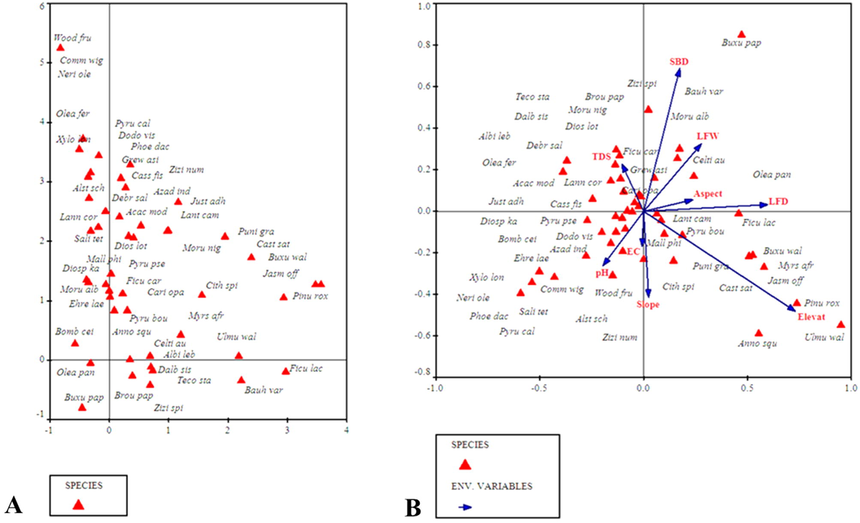
(A) DCA diagram showing distribution of 49 species and their relationship (B) The CCA plot indicated the Environmental factors affecting the abundance of woody species in MHNP.
Indirect gradient analysis
DCA diagram (Fig. 6-A) shows the distribution and association of the 49 woody plant species in the study area. In the DCA ordination for 49 woody plant species, the higher gradient length was recorded for axis 1 i.e., 3.029 with eigenvalue 0.627. The gradient length recorded for axis 2 was 2.720 with an eigenvalue of 0.415. Whereas the gradient length recorded for axis 3 was 2.469 with an eigenvalue of 0.189. While the gradient length recorded for axis 4 was 1.761 with an eigenvalue of 0.136. The total inertia in woody plant data was 4.079 (Table 2).
4 Discussion
National Parks play a key role in many ecosystem services, like air purification carbon sequestration, microclimate regulation, and wildlife habitat (Chiesura 2004). The present study indicate that national parks have a crucial role in woody plant distribution and facilitate larger heights as we as crown these results are supported from others studies i.e. Managed forest Kioloa study area located within the southern forest zone region of New South Wales, Australia (Roxburgh, Wood et al. 2006).
In the current study we determined the carbon sequestration for 4916 woody plant species in the MHNP. The similar techniques were also used by (Aguaron and McPherson 2012) in the Sacramento metropolitan region in which they determined 640 trees in 300 plots. Carbon sequestration is mainly depend on the height (H) and diameter at breast height of the trees (Shimamoto, Botosso et al. 2014). In the current study we found that carbon sequestration is mainly depend on plant DBH, followed by plant crown and plant height. It is due to grater DBH containing plant poses larger crown and hence play crucial role in carbonsequestration. The finding of the current study also highlighted that the tree with greater DBH, has more carbon sequestration ability as compared to higher plant height. These results are align with many other scientist (Shimamoto, Botosso et al. 2014). These findings are also supported by other studies i.e. Sharma from the Garwal region reported a negative correlation between height and carbon sequestration (Sharma, Chauhan et al. 2016). According to (Afzal and Akhtar 2013) reported from Changa Manga that trees DBH have more influential role than trees height. Our study indicates the trees with grater diameter sequestered more carbon dioxide because when diameter increase as a result plant crown also increase and hence plants increase carbon dioxide sequestration. Despite, in this study, carbon sequestration is directly affected by tree height, DBH, and crown, unlike the findings Carbon sequestration mainly depends on the height (H) (Rahman et al., 2021, Shimamoto, Botosso et al. 2014). These results also indicate that tree crown, DBH, height, and species richness has directly affect carbon sequestration.
Multivariate statistical analyses through PCORD-V5 software distribute the sampled plots (Fig. 3) based on similar vegetation types and available environmental variables. This type of analyses can be seen in the studies of (Khan, Khan et al. 2015, Ahmad et al., 2016, 2022, Mumshad et al., 2021, Rasheed et al., 2022, Hussain, Khan et al. 2019). The CANOCO 4.5 version was used to analyse the effect of the biotic and abiotic factors on species composition and abundance (Figs. 4, 5) this software was used by other scientists (Brown and Bezuidenhout 2005). The elevation, slope angle soil bulk density clearly indicates that this variable has a strong impact on woody plant species composition and distribution (Figs. 4, 5) these results are supported by various other studies like (Hussain, Khan et al. 2019). The CCA biplot showed that species were clustered around a high concentration of EC, TDS, and pH (Figs. 4, 5) these findings are supported by (Rahman et al., 2022, Khan, Sue et al. 2013). The findings of the previous researcher clearly indicate that plant abundance is key factor of National Parks and hence plays important role in climate change through carbon sequestration an important greenhouse gas.
5 Conclusion
Woody plant species abundance, DBH, and plant crown depth are highly related to carbon sink. The current study shows that MHNP has a high diversity and abundance of woody plant species, which contribute significant services to the whole ecosystem and plays a significant role in carbon sequestration.
Acknowledgements
The authors would like to extend their sincere appreciation to the Researchers Supporting Project Number (RSP-2021/ 356), King Saud University, Riyadh, Saudi Arabia.
Declaration of Competing Interest
The authors declare that they have no known competing financial interests or personal relationships that could have appeared to influence the work reported in this paper.
References
- Comparison of methods for estimating carbon dioxide storage by Sacramento’s urban forest. Carbon sequestration in urban ecosystems . Springer 2012:43-71.
- [Google Scholar]
- Weed species composition and distribution pattern in the maize crop under the influence of edaphic factors and farming practices: A case study from Mardan, Pakistan. Saudi Journal of Biological Sciences. 2016;23(6):741-748.
- [Google Scholar]
- Plants predict the mineral mines – A methodological approach to use indicator plant species for the discovery of mining sites. Journal of Advanced Research 2022
- [CrossRef] [Google Scholar]
- Indicator species analysis and assessment of ornamental plants using multivariate statistical techniques in the home gardens of Rustam Valley, Pakistan. International Journal of Applied and Experimental Biology. 2022;1(2):87-95.
- [Google Scholar]
- Measuring the effectiveness of protected area networks in reducing deforestation. Proceedings of the national academy of sciences. 2008;105(42):16089-16094.
- [Google Scholar]
- Floristic composition and ecological gradient analyses of the Liakot Forests in the Kalam region of District Swat, Pakistan. Journal of Forestry Research. 2019;30(4):1407-1416.
- [Google Scholar]
- Study of medicinal plants of the Chitral Gol National Park (CGNP) with special emphasis on future conservation and sustainability. In: Ethnobiology of Mountain Communities in Asia. Cham: Springer; 2021. p. :71-85.
- [Google Scholar]
- Role of Chitral Gol National Park in Maintaining and Conserving Plant Diversity of the Region. In: Ozturk M., ed. Biodiversity, Conservation and Sustainability in Asia: Prospects and Challenges in South and Middle Asia. Vol 2. Switzerland: Cham: Springer International Publishing; 2022. p. :199-217.
- [Google Scholar]
- Eco-Floristic studies of native plants of the Beer Hills along the Indus River in the districts Haripur and Abbottabad, Pakistan. Saudi journal of biological sciences. 2018;25(4):801-810.
- [Google Scholar]
- The vegetation of the farms Ingleside and Welgedacht of the Mountain Zebra National Park, Eastern Cape. Koedoe. 2005;48(2):23-42.
- [Google Scholar]
- Total sequestered carbon stock of Mangifera indica. Journal of Environment and Earth science. 2012;2(1)
- [Google Scholar]
- The role of urban parks for the sustainable city. Landscape and urban planning. 2004;68(1):129-138.
- [Google Scholar]
- “Without bamboo, the land dies”: biomass, litterfall, and soil organic matter dynamics of a Javanese bamboo talun-kebun system. Forest Ecology and Management. 1996;87(1–3):75-88.
- [Google Scholar]
- Spatial Dynamics of Forest Cover and Land Use Changes in the Western Himalayas of Pakistan. Vegetation Index and Dynamics 2022:193.
- [Google Scholar]
- -Impact of multiple environmental factors on species abundance in various forest layers using an integrative modeling approach. Global Ecology and Conservation. 2021;29:e01712.
- [Google Scholar]
- Phytogeographic Elements and Vegetation along the River Panjkora-Classification and Ordination Studies from the Hindu Kush Mountains Range. The Botanical Review. 2021;87(4):518-542.
- Clark III, A., et al. (1986). “Total-tree weight, stem weight, and volume tables for hardwood species in the southeast.” Georgia Forest Research Paper(60).
- Altitudinal variation of soil organic carbon stocks in temperate forests of Kashmir Himalayas, India. Environmental monitoring and assessment. 2015;187(2):1-15.
- [Google Scholar]
- Variation of biomass and carbon pools with forest type in temperate forests of Kashmir Himalaya, India. Environmental monitoring and assessment. 2015;187(2):1-17.
- [Google Scholar]
- DeWald, S. J. (2005). Heating with wood: Producing, harvesting and processing firewood, Cooperative Extension, Institute of Agriculture and Natural Resources ….
- Tree planting has the potential to increase carbon sequestration capacity of forests in the United States. Proceedings of the National Academy of Sciences. 2020;117(40):24649-24651.
- [Google Scholar]
- A phytosociological study of Margallah Hills National Park. Islamabad: Quaid-i-Azam University; 1984.
- Forest structure, Species composition and diversity of Tanzanian rain forest. Forest Ecology and Management. 2003;173:11-24.
- [Google Scholar]
- Assessment of Plant communities and identification of indicator species of an ecotnal forest zone at durand line, district Kurram, Pakistan. APPLIED ECOLOGY AND ENVIRONMENTAL RESEARCH. 2019;17(3):6375-6396.
- [Google Scholar]
- Vegetation Classification of the Margalla Foothills, Islamabad under the influence of edaphic factors and anthropogenic activities using modern ecological tools. Pak. J. Bot. 2021;53(5):10-30848.
- [Google Scholar]
- Indigenous uses of economically important flora of Margallah hills national park, Islamabad, Pakistan. African Journal of Biotechnology. 2009;8(5)
- [Google Scholar]
- Juffe-Bignoli, D., et al. (2014). “Protected planet report 2014.” UNEP-WCMC: Cambridge, UK 11.
- Vegetation dynamics in the Western Himalayas, diversity indices and climate change. Sci., Tech. and Dev. 2012;31(3):232-243.
- [Google Scholar]
- Phyto-climatic gradient of vegetation and habitat specificity in the high elevation western Himalayas. Pakistan Journal of Botany. 2013;45(Suppl. 1):223-230.
- [Google Scholar]
- Altitudinal variation in plant species richness and diversity at Thandiani sub forests division, Abbottabad, Pakistan. Journal of Biodiversity and Environmental Sciences. 2015;7(1):46-53.
- [Google Scholar]
- Vegetation mapping and multivariate approach to indicator species of a forest ecosystem: A case study from the Thandiani sub Forests Division (TsFD) in the Western Himalayas. Ecological Indicators. 2016;71:336-351.
- [Google Scholar]
- Phytogeographic classification using multivariate approach; a case study from the Jambil Valley Swat, Pakistan. Pak J Bot. 2020;52:279-290.
- [Google Scholar]
- Estimation of carbon stocks of Balganga reserved forest, Uttarakhand, India. Forest science and technology. 2015;11(4):177-181.
- [Google Scholar]
- Combined nivolumab and ipilimumab or monotherapy in untreated melanoma. New England journal of medicine. 2015;373(1):23-34.
- [Google Scholar]
- Environmental determinants of plant associations and evaluation of the conservation status of Parrotiopsis jacquemontiana in Dir, the Hindu Kush Range of Mountains. Tropical Ecology. 2020;61(4):509-526.
- [Google Scholar]
- Ecology and phytogeography of high altitude plants of the Northwest Himalaya. Chapman and Hall; 1978.
- 0. 1982. Soil pH and lime requirement. Methods of soil analysis, part. 1982;2:199-224.
- [Google Scholar]
- Phyto-ecological studies and distribution pattern of plant species and communities of Dhirkot, Azad Jammu and Kashmir, Pakistan. Plos One. 2021;16(10)
- [Google Scholar]
- Floral composition, sustainable utilization, and conservation of important medicinal plants in the Ayubia National Park, Abbottabad, Khyber Pakhtunkhwa, Pakistan. In: Abbasi A.M., Bussmann R.W., eds. Ethnobiology of Mountain Communities in Asia. Switzerland: Springer; 2021. p. :103-123.
- [Google Scholar]
- Ecological assessment and indicator species analyses of the Cholistan desert using multivariate statistical tools. Pakistan Journal of Botany. 2022;54(2)
- [Google Scholar]
- Assessing the carbon sequestration potential of managed forests: a case study from temperate Australia. Journal of Applied Ecology. 2006;43(6):1149-1159.
- [Google Scholar]
- The role for sustainably managed forests in climate change mitigation. Journal of Forestry. 2007;105(6):314-319.
- [Google Scholar]
- Tree diversity and carbon stocks of some major forest types of Garhwal Himalaya, India. Forest Ecology and Management. 2010;260(12):2170-2179.
- [Google Scholar]
- Carbon sequestration potential in agroforestry system in India: an analysis for carbon project. Agroforestry systems. 2016;90(4):631-644.
- [Google Scholar]
- How much carbon is sequestered during the restoration of tropical forests? Estimates from tree species in the Brazilian Atlantic forest. Forest Ecology and Management. 2014;329:1-9.
- [Google Scholar]
- Folk use of medicinal herbs of Margalla hills national park, Islamabad. Journal of ethnopharmacology. 2000;69(1):45-56.
- [Google Scholar]
- Carbon sequestration in global forests under different carbon price regimes. The Energy Journal(Special Issue#. 2006;SI2006(01)
- [Google Scholar]
- S. Solomon IPCC (2007): Climate change the physical science basis. Agu fall meeting abstracts 2007.
- Carbon sequestration potential in aboveground biomass of Thong Pha Phum national forest, Thailand. APPLIED ECOLOGY AND ENVIRONMENTAL RESEARCH. 2007;5(2):93-102.
- [Google Scholar]
- Carbon sequestration: how much can forestry sequester CO2. Forestry Research and Engineering: International Journal. 2018;2(3):148-150.
- [Google Scholar]


