

Translate this page into:
Boron Application in Yermosols Improves Grain Yield and Quality of Chickpea (Cicer arietinum L.)
⁎Corresponding authors. atiqjugg@gmail.com (Atique ur Rehman), wangxiukang@yan.edu.cn (Xiukang Wang), mubashiragr@gmail.com (Mubshar Hussain)
-
Received: ,
Accepted: ,
This article was originally published by Elsevier and was migrated to Scientific Scholar after the change of Publisher.
Peer review under responsibility of King Saud University.
Abstract
Background
Boron (B) contents are decreasing in most of crop areas of semi-arid yermosols, hindering yield and quality of chickpea.
Objective
This study investigated the growth and quality alterations associated with soil applied B on chickpea in semiarid yermosols.
Method
A pot experiment was conducted using Yermosols soil with two chickpea cultivars (cv. Noor-2013 and Bittle-98) and five soil applied B concentration @ 0.00, 0.18, 0.27, 0.36 and 0.45 mg B kg−1, as borax (Na2B4O7·10H2O). Treatments arrangement was according to completely randomized design with factorial arrangements and each treatment was replicated five times.
Results
Soil applied B (0.45 mg B kg−1) significantly (P ≤ 0.05) improved plant height, number of pods and seeds per plant, 100-grain weight, grain and biological yield, chlorophyll contents, transpiration rate, stomatal conductance, water use efficiency, B uptake by roots, seed, leaves and shoot of plant body and grain protein, crud fiber, starch and total sugar in both cultivars of chickpea, but the degree of effects was varied between cultivars. The results indicated that studied traits of both cultivars were significantly (P ≤ 0.05) decreased in B deficient treatments. Between cultivars, Noor-2013 recorded significant improvement (P ≤ 0.05) in all parameters with 0.45 mg B kg−1 application compared than Bittle-98. Further, yield, yield attributing, physiological, B uptake by plants and grain quality parameters were positively correlated with each other except grain crude fiber.
Conclusion
Our findings conclude that the adequate concentration of B (0.45 mg B kg−1) had pronounced effects on various growth, yield, physiological and grain quality traits.
Keywords
Chickpea
Soil application
Photosynthesis
Grain quality
Boron

1 Introduction
Chickpea (Cicer arietinum L.) is one of the prominent pulses and widely cultivated in the world after beans and soybean. In Pakistan, it’s area under cultivation is 940 thousand hectares having annual seed production is 545 thousand tones (Govt. of Pakistan, 2019–2020). Chickpea average yield is lower in Pakistan than other chickpea growing countries. It is a well-adjusted crop in arid to semi-arid regions and is commonly cultivated on dry conditions (Kagan and Kayan, 2014). It is common and cheap protein source particularly for poor peoples of unindustrialized countries and thus can help to decrease malnutrition and improves human health. Chickpea has ability to bear low-risk in semi-arid environment due to its intensive rooting features (Rehman et al., 2014). Among different factors causing low yield, lack of balanced fertilization is the most important factor, especially deficiency of micronutrients (Borie et al., 2006). Boron (B) has significant microelement which is essential for crop growth, but quickly becoming scarce in soils (Tahir et al., 2009). However, Pakistani calcareous soils are B-deficient, that results in lower crop production and economic benefits (Atique-ur-Rehman et al., 2020). It has dominant role in cell growth, pollen tube development, membranes stability, grain development and fertilization (Zhao et al., 2001).
Boron deficiency and surplus leads to physiological and morphological disorder in crop plants (Kastori et al., 2008). Boron deficiency symptoms are poor root proliferation, inferior development of apical meristem, weak leaves growth, lower chlorophyll and photosynthetic rate, disturbance in ion channel; higher phenolic and lignin concentrations, and lower crop production (Wang et al., 2015). Boron deficiency leads to higher enzymatic and non-enzymatic oxidation reactions by using phenolic contents as substrate, outcomes in higher polyphenolic and quinine concentrations, which are hazardous for crop production (Hajiboland et al., 2013). Boron application is reported to have significant improvement in chickpea development and its scarcity cause destructive effects on chickpea production. Boron deficiency may be under alkaline soil, and accessibility lower at pH 6.5–7.0 or above on sandy soils or having lower organic content soils (Sims 2000). Hence, chickpea shows more response to the application of B as compared to other legumes, even though dissimilarity among chickpea cultivars correlated to B deficiency (Ahlawat et al., 2007). Boron application in soil is necessary when its concentration is less than 0.3 mg kg per ha (Ahlawat et al., 2007).
Deficiency of B may be corrected in a number of ways, however, soil and exogenous application strategy are more suitable way for effectiveness of microelements especially B (Rehman et al., 2019). Agronomic biofortification of micronutrients is easier and can be applied by exogenous spray, soil incorporation and seed coating methods (priming and coating) (Rehman et al. 2018a, 2018b). It has been observed that soil applied B showed significant role on chickpea dry matter production while foliar application has prominent effect on grain production (Padbhushan and Kumar, 2014).
In Pakistan, limited research was done to evaluate the consequence of B application in calcareous condition. Adjusting the B concentration in soil may be helpful for improving growth and production on calcareous Yermosols. The objective of present study was to surmise the response of chickpea to different concentrations of soil applied B on Yermosols. It was hypothesized that chickpea cultivars will exhibit changing behavior to soil applied B with improvement in grain yield and quality.
2 Materials and methods
The experiment was performed in a wire-house at Bahauddin Zakariya University, Multan (30.10 oN, 71.25 oE and 421 ft. altitude above sea level) in winter during 2017–18. Calcareous alluvial soil of 20 kg weight and 1.04 mg m−3 bulk density were added in earthen pots (25 cm × 40 cm), firstly the inner side of pots were enclosed with polyethylene sheet. Water holding and field capacity were kept with 33% and 70% through using de-ionized water respectively. Before performing study, different soil physico-chemical characteristics were determined. Soil texture was silty clay loam calculated through Hydrometer and fits to Sindhlianwali series (hyperthermic, sodic haplocambids) in USDA Haplic Yermosols classification. Soil pH was 8.3 recorded through pH meter (Beckman 45 Modal, US) and EC was 12 dS m−1 noted by EC meter (VWR Conductivity Meter DIG2052). Soil organic content was 0.78% (Walkely-Block method), N was 4.16% (Kjeldahl Method), extractable-P was 7.65% (Olsen’s Method) and potassium was 270%. Soil analysis showed 0.24 mg kg−1 of B that it was deficient which determined through procedure modified by Wolf (1974). Environmental data of crop growing period during 2017–2018 is given in Table 1.
Months
Average temperature (°C)
Maximum temperature (°C)
Minimum temperature (°C)
Atmospheric pressure at sea level (hPa)
Average relative humidity (%)
Total rainfall (mm)
Average wind speed (Km/h)
Mean monthly sunshine (Hours)
November 2017
18.3
22.2
13.8
1014.9
69.6
4.20
2.4
3.7
December 2017
14.6
20.4
8.9
1018.7
58.8
16.00
2.1
5.2
January 2018
13.4
19.7
7.6
1015.8
72.8
0.00
2.6
4.4
February 2018
17.7
22.8
12.2
1014.5
65.3
6.80
4.7
4.9
March 2018
24.7
30.3
16.7
1010.4
62.8
0.00
5.9
7.2
April 2018
28.5
36.1
22.8
1008.0
46.9
3.00
8.4
5.4
Two chickpea cultivars viz. Noor-2013 and Bittle-98 with five soil applied B concentration viz. B0 (control), B1: 0.18; B2: 0.27; B3: 0.36 and B4: 0.45 mg B kg−1 were tested and each treatment was replicated five times. Borax (Na2B4O7·10H2O) was used as source of B. Solution of different B concentrations were applied on dried soil than mixed into soil manually. Ten seeds were sown into each pot and kept five after 20 days after sowing. Soil moisture contents checked regularly and maintained up to 70%. Recommend doses of N and P @ 34 and 85 kg ha−1 were equally incorporated into the pots on soil weight basis. At maturity, pods were separated and air dried to detach seed and seed dried weight was recorded. Standard agronomic production practices were applied during growing period.
At maturity plant height (cm) and number of pods were measured. Pods were separated manually to find out seeds per pod and plant. Weight 100-grain was measured by using an analytical balance (Model Number: HC2204) after oven-drying at 70 °C for 24 h. Chlorophyll contents were determined after 45 days of sowing by ‘SPAD-502′ chlorophyll meter. For measurements of transpiration and stomatal conductance, portable photosynthesis system (LI-6200, LI-COR, Inc., Lincoln, NE) was used. Water use efficiency (WUE) was calculated by dividing photosynthesis with transpiration rate. For determination of B contents in plants, mature plants were uprooted and separated into roots, shoots, leaves and seeds. Separated parts were cleaned with distilled water and dried for constant weight in a thermo-ventilated oven at 65 ± 5 °C. Material was crushed into a John Wiley mill and sieved through a 40 mesh screen. The powdered material was converted into ash by using muffle furnace at 550 °C for six hours. After that 0.36 N H2SO4 was added and the B concentration was determined by spectrophotometer at 420 nm wavelength using azomethine-H method (Bingham, 1982). Soluble protein (mg g−1 dry weight) content in the seed sample was estimated by Folin-Ciocalteau reagent method Lowry et al. (1951). For determination of B content in seed, 500 mg seed was milled in a pestle and mortor using 5–10 ml of potassium sodium tartarate buffer, subjected to centrifugation and the supernatant was collected. From extract, 0.2 ml was diluted up to 1 ml by addition of distilled water and allowed rest for ten minutes. Folin-Ciocalteau reagent (0.5 ml) was mixed into it and covered in dark at room temperature for 30 min. The concentration of blue color established was measured at 660 nm. Blank was prepared without plant sample and the absorbance was measured. Starch content in grains was estimated by Anthrone Reagent method (Sadasivam and Manickam, 1996). For this purpose, 0.5 g sample was standardized then centrifuged in 80% ethanol to eliminate sugars and continued to wash until green color of anthrone reagent developed. Filtrate was desiccated well into a water bath, consisted of 5 ml water and 6.5 ml of 52% perchloric acid, centrifuged at 0 °C for 20 min and supernatant was pooled repeatedly using fresh perchloric acid and made up to 100 ml. Distilled water was added in 0.1 ml supernatant and volume was made up to 1 ml, then 4 ml anthrone reagent was added and warmed into a water bath for eight minutes. It was air-cooled and green color intensity was read in spectrophotometer at 630 nm. Standard curve was prepared with standard glucose solution. Glucose content in sample was obtained from standard graph then multiplied by 0.9 factor to attain starch content. Starch contents were calculated by applying the procedure of Rong et al. (1996). The termination and gradation of sugar compounds from seeds were carried out by an Agilent 1100 series HPLC system (Agilent, USA), (Zeng et al., 2007).
Experimental treatments were set in completely randomized design with factorial arrangement. SAS software (Version 9.1; SAS Institute, Cary, NC, USA) (SAS Institute, 2008) was used for ANOVA on all traits and their means were marked by applying Duncan’s multiple range test at significance (p less than 0.05) level of 5% (Steel, 1997). Analysis of correlation and scatter plot with linear regression were prepared by applying Minitab (Version 12, State College, PA, USA) (Minitab, Inc. 1998) to evaluate the effect of studied traits particular on the achieved results.
3 Results
Soil applied 0.45 mg B kg−1 produced 13.5% taller plant height than control (Table 2). Similarly, no. of pods of Bittle-98 was measured 38.7% maximum than Noor-2013. Boron application of 0.45 mg kg−1 gave 15% more no. of pods. Among different treatments, Bittle-98 with 0.45 mg kg−1 had 47.9% higher no. of pods than Noor-2013 with B0 (Table 2). Likewise, 0.45 mg B kg−1 had 34.8% significantly maximum no. of grains per pod than control. Cultivar Noor-2013 produced 24.6% more no. of grains per pod than Bittle-98 in different concentrations of B (Table 2). Cultivar Noor-2013 produced 41.5% more no. of grains per plant than Bittle-98 under different concentrations of B (Table 2). Regarding 100-grain weight, 0.45 mg kg−1 had 11.6% more grain weight than control. The cultivar Noor-2013 produced 43% heavier grains than Bittle-98 under different concentrations of soil applied B. Likewise, 0.45 mg B kg−1 produced 51.8% and 28.5% higher grain and biological yield than control, respectively. The cultivar Noor-2013 produced 31.2% and 3.4% higher grain and biological yield per plant than Bittle-98 under different concentrations of B, respectively (Table 3).
Treatments
Plant Height (cm)
Number of pods per plant
Number of seeds per pod
Number of seeds per plant
Noor-2013
Bittle-98
Mean
Noor-2013
Bittle-98
Mean
Noor-2013
Bittle-98
Mean
Noor-2013
Bittle-98
Mean
B0 = 0 mg B kg−1 of soil
56.00
48.58
52.29E
38.37i
62.60e
50.49E
0.98
0.79
0.88C
42.10
22.93
32.15E
B1 = 0.18 mg B kg−1 of soil
58.03
50.58
54.25D
40.86h
66.00d
53.43D
1.10
0.88
0.99BC
44.55
24.90
34.73D
B2 = 0.27 mg B kg−1 of soil
60.39
52.00
56.19C
42.12gh
69.00c
55.56C
1.26
0.95
1.07ABC
46.77
27.19
36.98C
B3 = 0.36 mg B kg−1 of soil
B4 = 0.45 mg B kg−1 of soil63.10
65.2553.55
55.6758.32B
60.46A43.07g
45.25f71.31b
73.60a57.19B
59.42A1.35
1.601.04
1.101.19AB
1.35A51.03
53.7530.31
33.9040.67B43.83A
Mean
60.54A
52.06B
41.96B
68.50A
1.26A
0.95B
47.64A
27.85B
LSD at 5 %
Cultivars (C): 0.51; Boron levels (B): 1.15; C × B: NS
Cultivars (C): 0.64; Boron levels (B): 1.02; C × B: 1.44
Cultivars (C): 0.12; Boron levels (B): 0.29; C × B: NS
Cultivars (C): 0.91; Boron levels (B): 1.45; C × B: NS
Treatments
100 grain weight (g)
Grain yield (g/plant)
Biological yield (g/plant)
Noor-2013
Bittle-98
Mean
Noor-2013
Bittle-98
Mean
Noor-2013
Bittle-98
Mean
B0 = 0 mg B kg−1 of soil
27.25
14.87
21.05E
9.73
7.27
8.50D
30.93
30.75
30.84D
B1 = 0.18 mg B kg−1 of soil
27.66
15.88
21.77D
12.45
9.26
10.85C
33.35
34.20
33.77C
B2 = 0.27 mg B kg−1 of soil
28.40
16.20
22.30C
14.64
10.15
12.40C
37.05
36.74
36.76B
B3 = 0.36 mg B kg−1 of soil
B4 = 0.45 mg B kg−1 of soil28.95
30.0016.75
17.6022.85B
23.80A17.65
21.6612.10
13.6014.88B
17.63A39.95
45.7238.32
40.5439.14B
43.13A
Mean
28.53A
16.26B
15.23A
10.48B
37.36A
36.09B
LSD at 5 %
Cultivars (C): 0.27; Boron levels (B): 0.43; C × B: NS
Cultivars (C): 1.39; Boron levels (B): 2.20; C × B: NS
Cultivars (C): 1.52; Boron levels (B): 2.41; C × B: NS
Boron applied @ 0.45 mg kg−1 produced 11.8% higher chlorophyll contents than control which was also significantly lower than other B concentrations. Between cultivars, Noor-2013 resulted 3.4% more chlorophyll contents than Bittle-98 (Table 4). Plants applied with 0.45 mg B kg−1 recorded 4.7% more transpiration rate than all other B concentrations. From both cultivars, transpiration rate of Noor-2013 had 0.73% higher than Bittle-98. Likewise, Noor-2013 with 0.45 mg kg−1 gave 5.7% higher transpiration rate than Bittle-98 with control and other treatments. Boron applied @ 0.45 mg kg−1 produced 36.9% higher stomatal conductance than control and other B concentrations. Moreover, Noor-2013 recorded 1.9% higher stomatal conductance than Bittle-98 (Table 4). A 7.7% higher WUE was recorded with 0.45 mg kg−1 than control and other treatments. Moreover, Noor-2013 with 0.45 mg kg−1 showed 10.9% higher WUE than Bittle-98 with control. Among both cultivars, 2.5% higher WUE was noted in Noor-2013 than Bittle-98 (Table 4).
Treatments
Chlorophyll contents (SPAD)
Transpiration rate (mmol H2O m−2 s−1)
Stomatal conductance (µmol H2O m−2 s−1)
Water use efficiency (μmol CO2 mol−1 H2O day−1 m−2)
Noor-2013
Bittle-98
Mean
Noor-2013
Bittle-98
Mean
Noor-2013
Bittle-98
Mean
Noor-2013
Bittle-98
Mean
B0 = 0 mg B kg−1 of soil
40.77
38.81
39.79D
13.38g
13.18h
13.28E
2.38
2.34
2.36E
3.03ef
2.94g
2.99D
B1 = 0.18 mg B kg−1 of soil
41.02
40.35
40.69C
13.52e
13.45f
13.49D
2.84
2.80
2.82D
3.05de
3.00ef
3.03C
B2 = 0.27 mg B kg−1 of soil
43.46
41.98
42.71B
13.66d
13.57e
13.62C
3.00
2.92
2.96C
3.18b
3.09cd
3.14B
B3 = 0.36 mg B kg−1 of soil
B4 = 0.45 mg B kg−1 of soil44.13
46.1542.88
44.0643.50B
45.10A13.80c
13.98a13.76c
13.89b13.78B
13.94A3.60
3.773.55
3.713.58B
3.74A3.20b
3.30a3.12bc
3.17b3.16B
3.24A
Mean
43.10A
41.62B
13.67A
13.57B
3.12A
3.06B
3.15A
3.07B
LSD at 5 %
Cultivars (C): 0.37; Boron levels (B): 0.84; C × B: NS
Cultivars (C): 0.01; Boron levels (B): 0.03; C × B: 0.06
Cultivars (C): 0.001; Boron levels (B): 0.038; C × B: NS
Cultivars (C): 0.01; Boron levels (B): 0.03; C × B: 0.06
Boron application @ 0.45 mg kg−1 recorded 74.3% more B content of roots than control. Among treatments, Noor-2013 with @ 0.45 mg kg−1 produced 76.1% higher B in roots than Bittle-98 with control (Table 5). Among various concentrations of B, 0.45 mg B kg−1 gave 40.1% more grain B contents than control. Noor-2013 and Bittle-98 with 0.45 mg kg−1 produced 41.5% more grain B contents than Bittle-98 and Noor-2013 with control (Table 5). Nonetheless, 0.45 mg B kg−1 produced 36.6% more B contents of leaves in Noor-2013 than Bittle-98. The cultivar Noor-2013 recorded with 10.8% more B in leaves than Bittle-98 under various concentrations of B. Likewise, higher concentration of B in stalk was measured with 0.45 mg kg−1 that was 9% higher than control (Table 5).
Treatments
Boron uptake by roots (mg kg−1)
Boron uptake by seed (mg kg−1)
Boron uptake by leaves (mg kg−1)
Boron uptake by shoot (mg kg−1)
Noor-2013
Bittle-98
Mean
Noor-2013
Bittle-98
Mean
Noor-2013
Bittle-98
Mean
Noor-2013
Bittle-98
Mean
B0 = 0 mg B kg−1 of soil
12.00i
10.75j
11.38E
1.14e
1.10e
1.12E
26.16i
23.08j
24.62E
18.36e
14.46j
16.41E
B1 = 0.18 mg B kg−1 of soil
30.15g
28.72h
29.44D
1.33d
1.30d
1.32D
31.45e
26.45h
28.95D
18.78d
14.86i
16.82D
B2 = 0.27 mg B kg−1 of soil
37.00e
35.82f
36.41C
1.46c
1.41c
1.44C
32.72d
29.47g
31.10C
19.14c
15.30h
17.22C
B3 = 0.36 mg B kg−1 of soil
B4 = 0.45 mg B kg−1 of soil41.76c
44.96a39.67d
43.54b40.72B
44.25A1.68b
1.88a1.63b
1.85a1.66B
1.87A34.14b
36.43a31.10f
33.41c32.62B
34.92A19.47b
19.66a15.90g
16.40f17.69B
18.03A
Mean
33.17A
31.70B
1.50A
1.46B
32.18 A
28.70B
19.08A
15.38B
LSD at 5 %
Cultivars (C):0.01; Boron levels (B): 0.03; C × B: 0.06
Cultivars (C): 0.01; Boron levels (B): 0.03; C × B: 0.06
Cultivars (C): 0.01; Boron levels (B): 0.03; C × B: 0.06
Cultivars (C): 0.08; Boron levels (B): 0.12; C × B: 0.18
Grain protein was significantly improved by B application and 0.45 mg kg−1 produced 2.9% higher grain protein than control. Moreover, 4.1% higher grain protein was recorded in Noor-2013 with 0.45 mg kg−1 than Bittle-98 with control (Table 6). Likewise, applied B significantly affected grain starch and 0.45 mg B kg−1 recorded 1.4% more grain starch than control. Overall, the cultivar Noor-2013 presented 0.3% higher grain starch than Bittle-98 (Table 6). Regarding grain total sugar, 0.45 mg kg−1 exhibited 4.5% higher grain total sugar than control. Contrarily, Bittle-98 without B produced 10% higher grain crude fiber than Noor-2013 and Bittle-98 with 0.45 mg B kg−1 (Table 6).
Treatments
Grain protein (%)
Grain crud fiber (%)
Grain starch (mg kg−1)
Grain total sugar (%)
Noor-2013
Bittle-98
Mean
Noor-2013
Bittle-98
Mean
Noor-2013
Bittle-98
Mean
Noor-2013
Bittle-98
Mean
B0 = 0 mg B kg−1 of soil
11.88f
11.78 g
11.83E
5.90b
5.98a
5.94A
143.14
143.10
143.12E
5.33
5.29
5.31D
B1 = 0.18 mg B kg−1 of soil
11.96de
11.88f
11.92D
5.80 cd
5.86bc
5.83B
143.39
143.32
143.36D
5.40
5.36
5.38C
B2 = 0.27 mg B kg−1 of soil
12.02 cd
11.90ef
11.96C
5.70e
5.79d
5.75C
144.16
144.10
144.13C
5.47
5.41
5.44B
B3 = 0.36 mg B kg−1 of soil
B4 = 0.45 mg B kg−1 of soil12.16b
12.28a11.98d
12.08c12.07B
12.18A5.50f
5.38g5.55f
5.43g5.53D
5.41E144.52
145.22144.48
145.18144.50B
145.20A5.50
5.585.42
5.535.46B
5.56A
Mean
12.06A
11.92B
5.66B
5.72A
144.09A
144.04B
5.46A
5.40B
LSD at 5 %
Cultivars (C): 0.01; Boron levels (B): 0.03; C × B: 0.06
Cultivars (C): 0.01; Boron levels (B): 0.03; C × B: 0.06
Cultivars (C): 0.01; Boron levels (B): 0.03; C × B: NS
Cultivars (C): 0.005; Boron levels (B): 0.03; C × B: NS
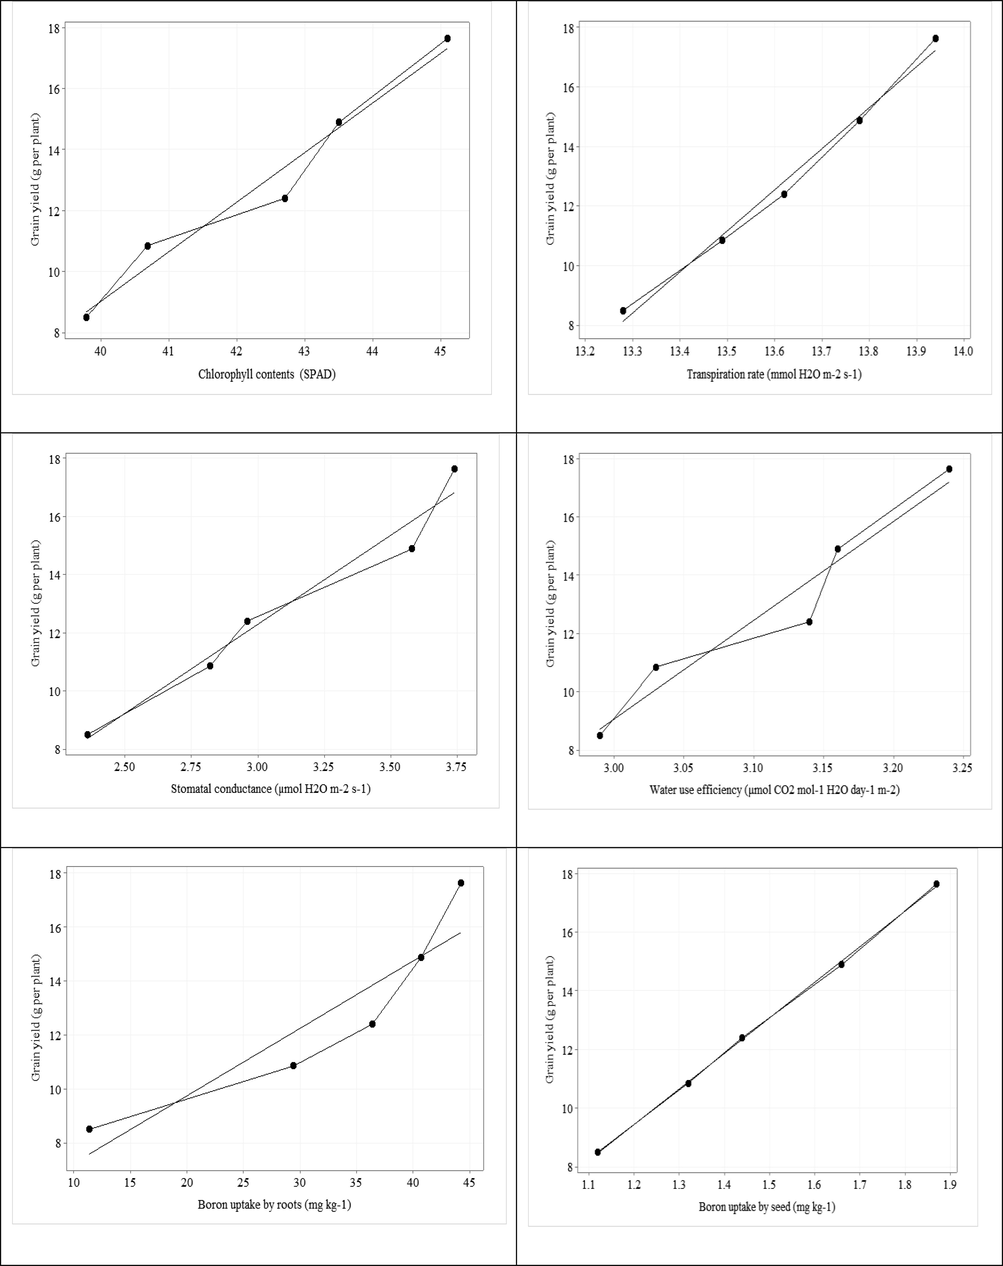
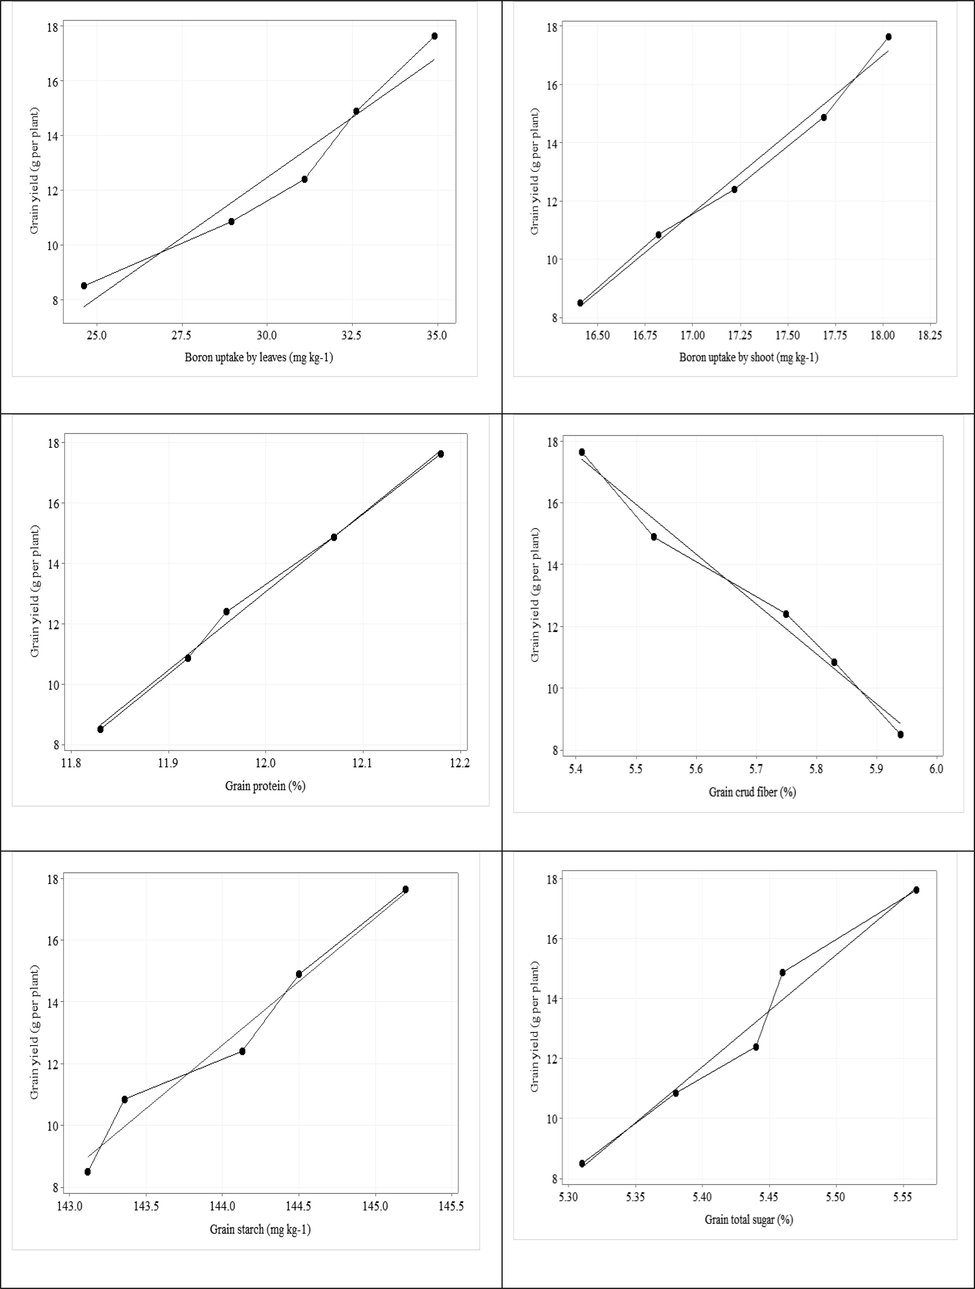
Significant and positive correlation was recorded between grain yield per plant and plant height (r = 0.99), no. of pods (r = 0.98); no. of grains per pod (r = 0.99); no. of grains per plant (r = 0.99); 100-grain weight (r = 0.99); biological yield per plant (r = 0.99); chlorophyll contents (r = 0.98); transpiration rate (r = 0.99); stomatal conductance (r = 0.98); WUE (r = 0.97); B uptake by roots (r = 0.91); B uptake by seed (r = 1.00); B uptake by leaves (r = 0.97); B uptake by stalk (r = 0.99); grain protein (r = 0.99); grain starch (r = 0.98) and grain total sugar (r = 0.98) (Table 7). Scatterplot with regression line was drawn among grain yield with all other parameters (Fig. 1). The regression line among grain yield with all parameters showed positive relationship except grain crude fiber. Scatterplot dots showed the variation of parameters with grain yield. **. Correlation is significant at the 0.01 level 9two-tailed). PH = Plant height; NPP = Number of pods per plant; NSP = Number of seeds per pod; NSPP = Number of seeds per plant; GWT = 100-grain weight; GY = Grain yield per plant; BY = Biological yield per plant; CH = Chlorophyll contents; TRAN = Transpiration rate; SC = Stomatal conductance; WUE = Water use efficiency; BUR = Boron uptake by roots; BUS = Boron uptake by seed; BUL = Boron uptake by leaves; BUST = Boron uptake by stalk; GP = Grain protein; GCF = Grain crud fiber; GS = Grain starch and GTS = Grain total sugar.
PH
NPP
NSP
NSPP
GWT
GY
BY
CH
TRAN
SC
WUE
BUR
BUS
BUL
BUST
GP
GCF
GS
PH
1
NPP
0.99**
1
NSP
0.99**
0.98**
1
NSPP
0.99**
0.98**
0.99**
1
GWT
0.99**
0.99**
0.99**
0.99**
1
GY
0.99**
0.98**
0.99**
0.99**
0.99**
1
BY
0.99**
0.99**
0.99**
0.99**
0.99**
0.99**
1
CH
0.99**
0.98**
0.98**
0.98**
0.98**
0.98**
0.99**
1
TRAN
0.99**
0.99**
0.99**
0.99**
0.99**
0.99**
0.99**
0.98**
1
SC
0.98**
0.97**
0.97**
0.98**
0.96**
0.98**
0.96**
0.95**
0.98**
1
WUE
0.98**
0.98**
0.96**
0.96**
0.97**
0.97**
0.98**
0.99**
0.97**
0.93**
1
BUR
0.92**
0.96**
0.90**
0.90**
0.92**
0.91**
0.92**
0.91**
0.95**
0.92**
0.91**
1
BUS
0.99**
0.98**
0.99**
0.99**
0.99**
1.00**
0.99**
0.98**
0.99**
0.98**
0.96**
0.92**
1
BUL
0.97**
0.99**
0.96**
0.96**
0.97**
0.97**
0.97**
0.96**
0.98**
0.96**
0.96**
0.98**
0.97**
1
BUST
0.99**
0.99**
0.98**
0.99**
0.98**
0.99**
0.99**
0.98**
0.99**
0.98**
0.97**
0.93**
0.99**
0.97**
1
GP
0.99**
0.97**
0.99**
0.99**
0.99**
0.99**
0.99**
0.97**
0.98**
0.98**
0.95**
0.90**
0.99**
0.95**
0.98**
1
GCF
−0.99**
−0.97**
−0.99**
−0.99**
−0.98**
−0.99**
−0.98**
−0.96**
−0.98**
−0.98**
−0.95**
−0.89**
−0.99**
−0.94**
−0.99**
−0.99**
1
GS
0.99**
0.97**
0.98**
0.98**
0.98**
0.98**
0.99**
0.99**
0.97**
0.94**
0.99**
0.89**
0.98**
0.95**
0.985**
0.97**
−0.97**
1
GTS
0.98**
0.98**
0.98**
0.97**
0.99**
0.98**
0.99**
0.98**
0.98**
0.94**
0.98**
0.92**
0.98**
0.97**
0.975**
0.97**
−0.95**
0.98**
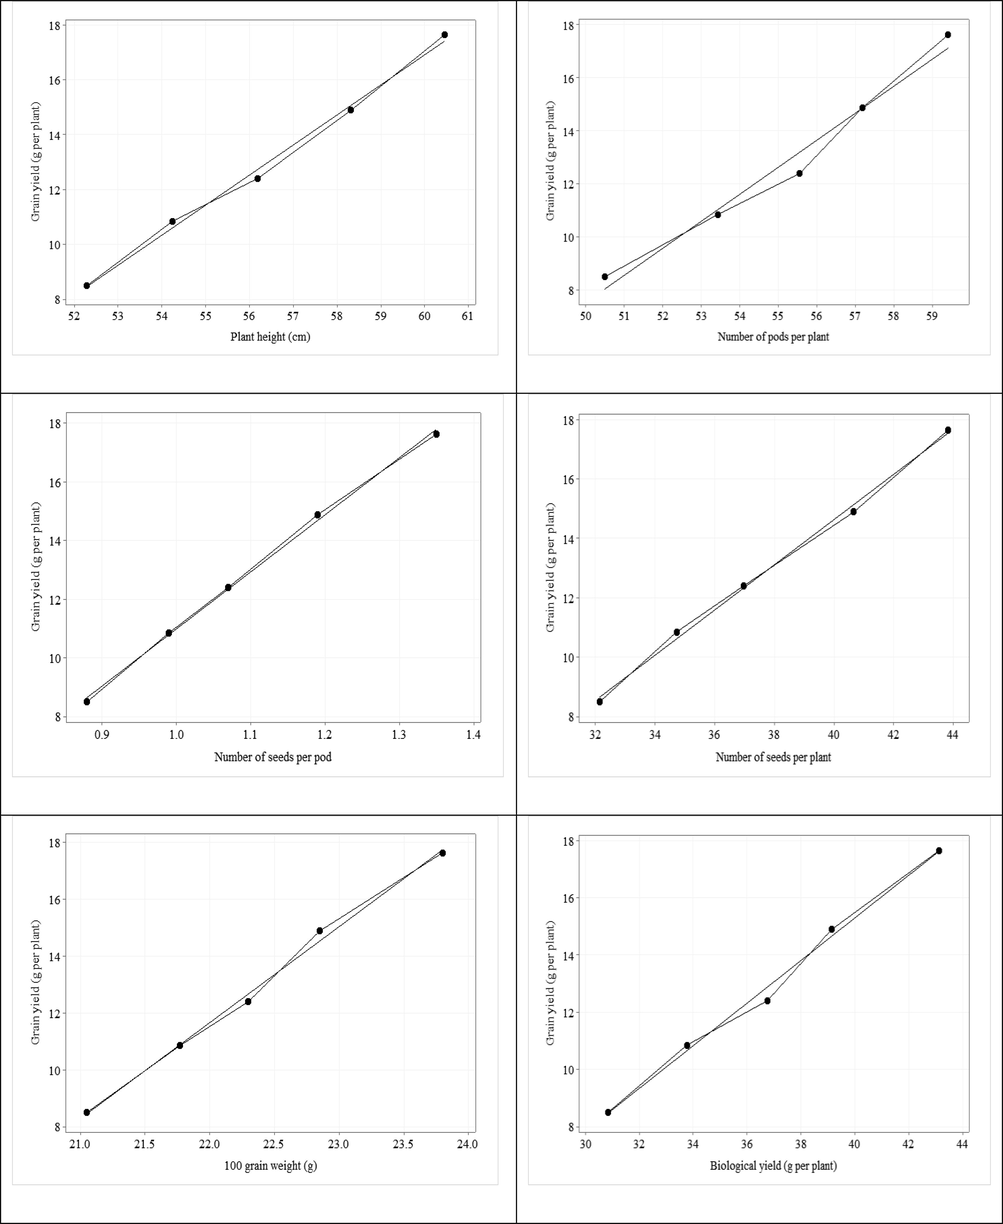
Scatterplot with regression line of grain yield vs plant height, number of pods per plant, number of seeds per pod, number of seeds per plant, 100 grain weight, biological yield, chlorophyll contents, transpiration rate, stomatal conductance, water use efficiency, boron uptake by roots, boron uptake by seeds, boron uptake by leaves, boron uptake by shoot, grain protein, grain crud fiber, grain starch, grain total sugar.
Scatterplot with regression line of grain yield vs plant height, number of pods per plant, number of seeds per pod, number of seeds per plant, 100 grain weight, biological yield, chlorophyll contents, transpiration rate, stomatal conductance, water use efficiency, boron uptake by roots, boron uptake by seeds, boron uptake by leaves, boron uptake by shoot, grain protein, grain crud fiber, grain starch, grain total sugar.
Scatterplot with regression line of grain yield vs plant height, number of pods per plant, number of seeds per pod, number of seeds per plant, 100 grain weight, biological yield, chlorophyll contents, transpiration rate, stomatal conductance, water use efficiency, boron uptake by roots, boron uptake by seeds, boron uptake by leaves, boron uptake by shoot, grain protein, grain crud fiber, grain starch, grain total sugar.
4 Discussion
Boron shortage is increasing and becoming a serious issue on calcareous soils (hyperthermic, sodic haplocambids) (Atique-ur-Rehman et al., 2020). Regardless of different concentrations and cultivars, considerable change was recorded in plant height of chickpea due to soil applied B (Table 2). Significant improvement in chickpea plant height of soil applied at 0.45 mg B kg−1 (Table 2) could be possible due to appropriate dose of boron, which is used as a part of many plant body functions. Deficiency of B reduces plant height as a result of depression in various physiological and growth parameters (Shrestha et al., 2019). Current findings are in line with Rehman et al. (2019) that crop with B incorporation supported in producing higher number of pods per plant. Suitable concentrations of B had prominent role in movement of photo assimilates from roots to other body parts and it also brings improvement in pollen tube development that leads to enhance number of seeds per pod (Silva et al., 2011). Significantly, higher 100-grain weight was recorded in 0.45 mg B kg−1 might be improvement in plant growth and less flower abortion. Experimental findings confirm the finding of Khatun et al. (2016) who found significant higher 100-grain weight in chickpea due to improvements of nutrients uptake that leads to healthy plant growth and flower development. Similarly, B had prominent role in fertilization that leads to enhance the grain filling rate, which encouraged to increase grain weight (Islam et al., 2017) (Table 3). Boron application brings improvement in flower formation and development, pollen formation, fertilization and seed development. Therefore, these improvements reduced the rate of flower and fruit shedding and ultimately resulted in higher number of pods and grain weight (Rehman et al., 2019).
Chlorophyll contents significantly improved with the increasing B concentration in the soil and maximum value was recorded with 0.45 mg B kg−1. Moreover, some researchers reported that B had indirect relationship with photosynthesis (Liu et al., 2005). Our study agreed with the outcomes of Liu et al. (2005) who reported that soil applied B had higher photosynthetic rate of crop by support of cell membrane and photosynthate movement as well as larger leaf area. The smaller size of leaf is primarily cause for reduction in photosynthetic rate of chickpea under B deficiency. Present study showed minimum rate of transpiration, stomatal conductance and WUE in B deficiency than 0.45 mg B kg−1 which might be due to damage of vascular bundle by B0 (Li et al., 2017). Statistically lower rate of transpiration rate and stomatal conductance in B0 also lowered the WUE (Table 6). Pinho et al. (2010) supported our results and concluded that linear correlation exists in stomatal conductance and B concentrations. Han et al. (2008) reported that 0.45 mg B kg−1 improved stomatal conductance and decreased intercellular CO2 absorption and resulting a considerable improvement in physiological characteristics. Boron contents were increased as increased concentration of B from 0.18, 0.27, 0.36 and 0.45 mg B kg−1 (Rehman et al., 2012). Boron deficiency quickly degenerated the appearance of genes in Arabidopsis of roots, hence, delayed the root development (Martín-Rejano et al., 2011). The division of B contents among plant parts had considerable change with increasing B concentration. Boron was absorbed in the direction of leaf > shoot > root (Table 7) (Reid et al., 2004).
Improved grain protein, crude fiber, starch and total sugar supported by the results of Rehman et al., (2019), that soil applied B in chickpea cultivars improves the grain quality traits due to considerable role of B on enzymes which are responsible for the buildup and alteration of assimilates into grains. Rehman et al. (2019) concluded that B application enhanced seed quality in form of storage, protein, fiber and starch. Genetic characteristics of cultivars is also responsible for improving grain quality traits (Bellaloui et al., 2009b). The improving development in quality traits by soil applied B (Rehman et al., 2019) could be the positive role of B on enzymes activities which are responsible for buildup and alteration of fatty acids (Bellaloui et al., 2009a).
5 Conclusion
Boron application to chickpea cultivars improved growth and grain production under semiarid region Yermosols. Application of B @ 0.45 mg B kg−1 remained better than other treatments.
Acknowledgments
The authors would like to express their gratitude to the Research Center of Advanced Materials—King Khalid University, Saudi Arabia for support by grant number (KKU/RCAMS/G001/21). The publication of the present work is supported by the National Natural Science Foundation of China (51809224), Top Young Talents of Shaanxi Special Support Program. We acknowledge Bahauddin Zakariya University, Multan, Pakistan for financial assistance during the study.
Declaration of Competing Interest
The authors declare that they have no known competing financial interests or personal relationships that could have appeared to influence the work reported in this paper.
References
- Ahlawat, I.P.S., Gangaiah, B., Ashraf Z.M., 2007. Nutrient management in chickpea. In: Chickpea Breeding and Management (Yadav S.S., Redden R., Chen W., Sharma B., eds). CAB International, Wallingford, Oxon, United Kingdom. pp. 213-232. 10.1079/9781845932138.010.
- Soil applied boron (B) improves growth, yield and fiber quality traits of cotton grown on calcareous saline soil. PLoS ONE. 2020;15(8):e0231805
- [CrossRef] [Google Scholar]
- Effect of glyphosate− boron application on seed composition and nitrogen metabolism in glyphosate-resistant soybean. J. Agric. Food Chem.. 2009;57(19):9050-9056.
- [CrossRef] [Google Scholar]
- Effect of maturity on seed composition in the early soybean production system as measured on near-isogenic soybean lines. Crop Sci.. 2009;49(2):608-620.
- [CrossRef] [Google Scholar]
- Bingham, F.T., 1982. Boron. In: Page, A.L., Ed., Methods of soil Analysis Part-2 Chemical and Mineralogical Properties. Am. Soc. Agron. 431-448. 10.2134/agronmonogr9.2.2ed.
- Effects of tillage systems on soil characteristics, glomalin and mycorrhizal propagules in a Chilean Ultisol. Soil Till. Res.. 2006;88:253-261.
- [Google Scholar]
- Govt. of Pakistan, 2019-2020. Economic Survey of Pakistan, Economic adviser’s Wing, Finance Division, Government of Pakistan, Islamabad. pp 121.
- Phenolics metabolism in boron-deficient tea [Camellia sinensis (L.) O. Kuntze] plants. Acta Biol. Hung.. 2013;64:196-206.
- [CrossRef] [Google Scholar]
- Growth and yield response of mungbean (Vigna radiata L.) as influenced by Sulphur and boron application. Sci. J. Crop Sci.. 2017;6:153-160.
- [CrossRef] [Google Scholar]
- The influence of inoculation and nitrogen treatments on yield and yield components in chickpea (Cicer arietinum L.) cultivars. Legume Res.. 2014;37:363-371.
- [CrossRef] [Google Scholar]
- Physiological and genetic basis of plant tolerance to excess boron. Zb Mat srp prir nauk (114):41-51.
- [CrossRef] [Google Scholar]
- Effect of fungicides on seed quality of lentil (Lens culinaris L.) during storage. Jahangirnagar Uni. J. Biol. Sci.. 2016;5:51-56.
- [CrossRef] [Google Scholar]
- Effects of increased nitrogen and phosphorus deposition on offspring performance of two dominant species in a temperate steppe ecosystem. Sci. Rep.. 2017;7:1-11.
- [CrossRef] [Google Scholar]
- The effect of molybdenum and boron in soil on the growth and photosynthesis of three soybean varieties. Plant Soil Environ.. 2005;51(No. 5):197-205.
- [CrossRef] [Google Scholar]
- Protein measurement with the Folin phenol reagent. J. Biol. Chem.. 1951;193(1):265-275.
- [CrossRef] [Google Scholar]
- Martı́n-Rejano, E.M., Camacho-Cristóbal, J.J., Herrera-Rodrı́guez, M.B., Rexach, J., Navarro-Gochicoa, M.T., González-Fontes, A., 2011. Auxin and ethylene are involved in the responses of root system architecture to low boron supply in Arabidopsis seedlings. Physiol. Plant. 142: 170-178. Google Scholar.
- MINITAB release 12 for windows. Pacific Grove: Brooks/Cole; 1998.
- Influence of soil and foliar applied boron on green gram in calcareous soils. Int. J. Agric., Environ. Biotechnol.. 2014;7:129.
- [CrossRef] [Google Scholar]
- Boron deficiency affects gas exchange and photochemical efficiency (JPI test parameters) in green dwarf coconut. J. Plant Nutr.. 2010;33(3):439-451.
- [CrossRef] [Google Scholar]
- Rehman, A.U., Ali, U.I., Qamar, R., Rehman, A., Hussain, M., Javeed, H.M.R., Ahmad, S., 2019. Boron foliage application mediates growth, oil yield and quality of sunflower in yermosols of southern Punjab. Intl. J. Agric. Biol., 21: 209–214. Google Scholar.
- Zinc nutrition in wheat-based cropping systems. Plant and Soil.. 2018;422(1-2):283-315.
- [CrossRef] [Google Scholar]
- Seed priming of Zn with endophytic bacteria improves the productivity and grain biofortification of bread wheat. Eur. J. Agron.. 2018;94:98-107.
- [CrossRef] [Google Scholar]
- Seed priming with boron improves growth and yield of fine grain aromatic rice. Plant Growth Regul.. 2012;68:189-201.
- [CrossRef] [Google Scholar]
- Thermal hardening improves germination and early seedling growth of chickpea. Asian J. Agric. Biol.. 2014;2(1):51-58.
- [Google Scholar]
- Reid, R.J., Hayes, J.E., Post, A., Stangoulis, J.C.R., Graham, R.D., 2004. A critical analysis of the causes of boron toxicity in plants. Plant Cell Environ. 27, 1405-1414. Google Scholar.
- Seasonal changes in nonstructural carbohydrates, protein, and macronutrient in roots of alfalfa, red clover, sweet clover, and birds foot trefoil. Crop Sci.. 1996;36:617-623.
- [CrossRef] [Google Scholar]
- SAS Institute, 2008. SAS/STAT 9.1 User’s Guide the Regular Procedure, (Book Excerpt). SAS Institute, Cary. Google Scholar.
- Role of seed priming in improving seed germination and seedling growth of maize (Zea mays L.) under rain fed condition. J. Agric. Nat. Res.. 2019;2:265-273.
- [CrossRef] [Google Scholar]
- Silva, C.A.T., Cagol, A., Silva, T.R.B., Nobrega, L.H.P., 2011. Boron application before sowing of sunflower hybrid. J. Food Agric. Environ. 9, 580-583. Google Scholar.
- Sims, T.T., 2000. Soil fertility evaluation. In: Handbook of soil science (Summer M. E., ed). Boca Raton, Florida, USA, CRC Press. Pp. 113-154. Google Scholar.
- Steel, R.G., 1997. Pinciples and procedures of statistics a biometrical approach (No. 519.5 S8). Google Scholar.
- Tahir, M., Tanveer, A., Shah, T.H., Fiaz, N., Wasaya, A., 2009. Yield response of wheat (Triticum aestivum L.) to boron application at different growth stages. Pak. J. Life Soc. Sci. 7: 39-42. Google Scholar.
- Boron deficiency in woody plants: various responses and tolerance mechanisms. Front. Plant Sci.. 2015;6:916.
- [CrossRef] [Google Scholar]
- Improvements in the azomethine-H method for the determination of boron. Commun. Soil Sci. Plant Anal.. 1974;5(1):39-44.
- [CrossRef] [Google Scholar]
- Zeng, X., Li, Y., Sun, Y., Hong, Y., Liu, J., Xiang, X., Wang, K., 2007. Determination of free sugars by high performance liquid chromatography. Chin. J. Anal. Chem. 35, 930-938. Google Scholar.
- Influence of potassium deficiency on photosynthesis, chlorophyll content, and chloroplast ultrastructure of cotton plants. Photosynthetica.. 2001;39(1):103-109.
- [CrossRef] [Google Scholar]


