

Translate this page into:
Biochemical composition, morphology and antimicrobial susceptibility pattern of Corynebacterium pseudotuberculosis biofilm
⁎Corresponding author. fakharulzaman@uitm.edu.my (Mohd Fakharul Zaman Raja Yahya)
-
Received: ,
Accepted: ,
This article was originally published by Elsevier and was migrated to Scientific Scholar after the change of Publisher.
Peer review under responsibility of King Saud University.
Abstract
Caseous lymphadenitis (CLA) is a ruminant disease caused by Corynebacterium pseudotuberculosis, a Gram-positive facultative intracellular pathogen. The present work was performed to investigate the biochemical composition, morphology and antimicrobial susceptibility pattern of C. pseudotuberculosis biofilm using Raman spectroscopy, field emission scanning electron microscopy (FESEM) and microplate biofilm assay respectively. Results showed that the 24-h-old biofilm was characterized by Raman spectral peaks at 615 cm−1 (CCC symmetric bend phenyl ring), 668 cm−1 (Valine) and 825 cm−1 (Ring breath Tyr.) whilst the 48-h-old and 72-h-old biofilms were characterized by Raman spectral peaks at 1400 cm−1 (COO— sym.), 1450 cm−1 (COO— sym.), 1581 cm−1 (Ring breath Trp.), 1650 cm−1 (COO— asym.) and 1725 cm−1 (C⚌O str.). Raman spectra also revealed the biochemical heterogeneity in C. pseudotuberculosis biofilm. FESEM images clearly showed the biofilm cells which were surrounded by the extracellular matrix. Treatment with nalidixic acid, streptomycin, tetracyclin, ethylenediaminetetraacetic acid (EDTA) and dimethyl sulfoxide (DMSO) significantly (p < 0.05) inhibited the viability of C. pseudotuberculosis biofilm. The present study suggests that the biochemical composition of C. pseudotuberculosis biofilm may vary across different developmental stages. Meanwhile, nalidixic acid, streptomycin, tetracyclin, EDTA and DMSO may be useful in the treatment of CLA.
Keywords
Biofilm
Extracellular polymeric substances
Corynebacterium pseudotuberculosis
Caseous lymphadenitis
Raman spectroscopy
Field emission scanning electron microscopy

- CLA
-
Caseous lymphadenitis
- C. pseudotuberculosis
-
Corynebacterium pseudotuberculosis
- S. typhimurium
-
Salmonella typhimurium
- FESEM
-
Field emission scanning electron microscope
- h
-
Hours
- Tyr
-
Tyrosine
- sym
-
Symmetric
- asym
-
Asymmetric
- Trp
-
Tryptophan
- str
-
Stretching
- EDTA
-
Ethylenediaminetetraacetic acid
- DMSO
-
Dimethyl sulfoxide
- EPS
-
Extracellular polymeric substances
- NIH
-
National Institutes of Health
- VLSU
-
Veterinary Laboratory Service Unit
- UPM
-
Universiti Putra Malaysia
- ATCC
-
American type culture collection
- OD
-
Optical density
- nm
-
Nanometre
- µm
-
Micrometre
- mW
-
Milliwatt
- Ω/cm
-
Ohm per centimetre
- cm-1
-
Reciprocal centimetre
- ml
-
Millilitre
- °C
-
Degree Celsius
- CCD
-
Charge-coupled device
- s
-
Seconds
- µg/ml
-
Microgram per millilitre
- mM
-
Millimolar
- µl
-
Microliter
- IP
-
Intellectual property
- NaOH
-
Sodium hydroxide
- EtOH
-
Ethanol
- MBEC
-
Minimum biofilm eradication concentration
Abbreviations
1 Introduction
Caseous lymphadenitis (CLA) in small ruminants is caused by Corynebacterium pseudotuberculosis, a Gram-positive facultative intracellular pathogen. It is an easily transmitted infectious disease that commonly infects sheep and goats (Nascimento, 2020). The disease causes inflammation of the lymph node resulting in the formation of caseaous cheesy material in the nodes, abscess formation in superficial and internal lymph nodes as well as in internal organs (Cetinkaya et al., 2002). CLA cases have been reported by many countries such as Malaysia (Komala et al., 2008), Brazil (Guimarães et al., 2009), Egypt (Al-Gaabary et al., 2010), northern Norway (Hektoen, 2012), France and Spain (De La Fuente et al., 2017). The severity of CLA is expected to associate with biofilm formation of the causative organism.
Biofilm is a complex and structured microbial community that tends to attach to inert and living surfaces in the presence of extracellular polymeric substances (EPS) and causes a wide range of diseases. Bacteria within the biofilm become more resistant to antimicrobial treatment compared with planktonic counterparts because the bacterial community in the biofilm differs from its planktonic counterpart in the gene and protein expression patterns that typically results in distinct metabolic and antimicrobial resistance profiles (Giaouris et al., 2013). According to National Institutes of Health (NIH), among all microbial and chronic infections, 65% and 80%, respectively, are associated with the biofilm formation. Over the past few decades, many aspects of biofilms have been understood including basic life cycle, antimicrobial susceptibility pattern (Costerton et al., 1999), essential enzymes for biofilms (Yahya et al., 2014), biofilm heterogeneity (Yahya et al., 2017), chemical composition of EPS matrix (Costerton et al., 1999; Yahya et al., 2018) and whole-cell proteome expression (Giaouris et al., 2013; Zawawi et al., 2020).
Since the last few years, previous works have addressed the important genes for vaccination and the protein interaction networks in C. pseudotuberculosis. Hassan et al. (2014) adopted a novel integrative strategy combining substractive proteomics and modelomics. They successfully identified four essential and non-homologous proteins as potential vaccine targets. On the other hand, Folador et al. (2016) identified 181 essential proteins, among which 41 are non-host homologous from the inferred protein interaction networks. However, until now, there is still a lack of experimental data on C. pseudotuberculosis biofilm. Thus, the present work was performed to determine the biochemical composition of C. pseudotuberculosis biofilm using Raman spectroscopy. Biofilm morphology and biofilm susceptibility towards antimicrobials were investigated using field emission scanning electron microscopy (FESEM) and microplate biofilm assay respectively.
2 Materials and methods
2.1 Chemicals and antibiotics
The following commercially available antibiotics and chemicals were used herein: streptomycin (Sigma, USA), tetracyclin (Sigma, USA), nalidixic acid (Sigma, USA), ethylenediaminetetraacetic acid (Sigma, USA), dimethyl sulfoxide (Merck, Germany), ethanol (Merck, Germany), sodium hydroxide (Sigma, USA), sodium chloride (Sigma, USA), formaldehyde (Merck, Germany), hydrochloric acid (AJAX Chemicals), hydrogen fluoride (Merck, Germany), hydrogen peroxide (Merck, Germany), ammonium hydroxide (Merck, Germany), crystal violet (Sigma, USA) and resazurin (Sigma, USA).
2.2 Test microorganisms
C. pseudotuberculosis clinical isolate was obtained from Veterinary Laboratory Service Unit (VLSU), Department of Veterinary Pathology and Microbiology, Faculty of Veterinary Medicine, Universiti Putra Malaysia (UPM) while Salmonella typhimurium ATCC 14028 was obtained from Microbiology Laboratory, Faculty of Applied Sciences, Universiti Teknologi MARA Shah Alam. Both bacterial species were grown in nutrient broth (Difco Laboratories, USA) and incubated at 37 °C. Prior to biofilm assay, the bacterial inocula were adjusted to optical density (OD) of 0.7 at 600 nm.
2.3 Substrate
P-type Crystal Silicon (111) (Sigma, USA) with thickness of 625 ± 25 µm and 0–10 Ω/cm resistivity was used as a substrate. The substrate was cleaned using deionized water in order to remove dust and external particles on the surface of the substrate. The substrate was then immersed in H2O:H2O2:HCl (with ratio of 6:1:1) solution for 10 m to remove the metallic and microbiological contaminants. In order to remove the organic residues and oxide layer, the substrates were immersed in H2O:H2O2:NH4OH (ratio 5:1:1) and H2O:HF (with ratio of 10:1) solutions for 5 m for each solutions. Deionized water was used to rinse the samples after immersed in each solution. Finally, substrates were purge with N2 gas to clean and dry the surface.
2.4 Microplate biofilm assay for spectroscopic and microscopic characterization
C. pseudotuberculosis biofilm was grown in 6-well microplate. Overnight inoculum (4 ml) was added into the microplate wells. Then, a volume of 1 ml of fresh nutrient medium was added. For spectroscopic and microscopic experiments, the sterile silicon substrate and glass cover slip were introduced into the biofilm assay with the surface of interest facing upward, respectively. The microplate was incubated overnight at 37 °C. Then, the silicon substrate and glass cover slip were removed from the microplate and rinsed with phosphate-buffered saline twice.
2.5 Raman spectroscopy
Raman spectra of biofilm were obtained using Renishaw InVia Raman microscope (Wotton-under-Edge, UK) with a charge-coupled device (CCD) detector and a diffraction grating of 1200 lines/mm. An argon ion laser with excitation wavelength and laser power of 514 nm and 10 mW respectively were used. The measurement was carried out by 100% laser power and 40 s exposure time. Scanning range was limited from 500 to 3200 cm−1. Before measurement, the single crystalline silicone with 520 cm−1 Raman shift was used as calibration.
2.6 Field emission scanning electron microscopy
The morphology of C. pseudotuberculosis biofilm was studied using field emission scanning electron microscope (FESEM) (Hitachi, Japan). The biofilm on the glass cover slip was fixed in 4% formaldehyde at 4 °C for 3 h, rinsed with sterile distilled water thrice and dehydrated (once in 25%, 50%, 75% and twice in 100% of ethanol each for 10 m). The slide was air dried overnight and observed at 5000x magnification using FESEM.
2.7 Pellicle assay
C. pseudotuberculosis and S. typhimurium were grown in sterile test tubes. After incubation at 37 °C for 24 h, nutrient medium was discarded. The pellicle fractions were rinsed with sterile distilled water twice, heat-fixed at 60 °C for 30 m and stained with 0.5% crystal violet for 10 m. Then, the pellicle fractions were distained with sterile distilled water gently. The pellicle formation was inspected visually.
2.8 Antibiofilm screening assay
The susceptibility of C. pseudotuberculosis biofilm towards antimicrobials was evaluated using a range of veterinary antibiotics and common chemicals in 96-wells microplate. A stock of 0.02% resazurin was prepared and stored at 4 °C in the dark. Antibiotic solutions were prepared in distilled water to the concentration of 100 μg/ml, 50 μg/ml, 25 μg/ml, 12.5 μg/ml, 6.25 μg/ml and 3.12 μg/ml. Sodium hydroxide and Ethylenediaminetetraacetic acid (EDTA) solutions were prepared at 500 mM, 250 mM, 125 mM, 62,5mM, 31.3 mM and 15.6 mM while dimethyl sulfoxide (DMSO) and ethanol solutions were prepared at 50%, 25%, 12.5%, 6.25%, 3.13% and 1.56%. Overnight inocula (200 µl) were added into the microplate wells. Then, a volume of 50 µl of test solutions were added. Equal volume of fresh broth and intellectual property (IP)-protected antibiofilm cocktail were also added as negative and positive controls, respectively. The microplates were incubated overnight at 37 °C. On the following day, the medium was discarded whilst the biofilm fractions were rinsed with distilled water twice and heat-fixed at 60 °C for 30 min. The biofilm fractions were suspended in 220 µl of phosphate-buffered saline and 30 µl of 0.02% resazurin was added to the wells. The microplate was incubated for at least 3 h at 37 °C and analyzed using microplate reader (ThermoFisher Scientific, USA) for measuring absorbance at 570 nm.
2.9 Statistical analysis
All data from antibiofilm screening assay were expressed as mean ± standard deviation with n = 3. Independent t test was performed to determine the degree of significant difference between control and test groups whereby p < 0.05 was considered significant.
3 Results
3.1 Differential Raman spectra of C. pseudotuberculosis biofilm across different growth stages
Fig. 1 shows microscopic images and averaged Raman spectra of C. pseudotuberculosis biofilm at 24 h, 48 h and 72 h. Microscopic images were compared with the corresponding averaged Raman spectra in order to determine the correlation between density and biochemical composition of C. pseudotuberculosis biofilm. Almost the entire surface of silicon substrate was covered by C. pseudotuberculosis cells at 48 h and 72 h, indicating the biofilm maturity. Across all stages, C. pseudotuberculosis biofilm showed Raman spectral peaks at 615 cm−1 (CCC symmetric bend phenyl ring), 668 cm−1 (Valine) and 825 cm−1 (Ring breath Tyr). The Raman spectral peaks at 1400 cm−1 (COO— sym.), 1450 cm−1 (COO— sym.), 1581 cm−1 (Ring breath Trp.), 1650 cm−1 (COO— asym.) and 1725 cm−1 (C⚌O str.) were observed to appear in both 48-h-old and 72-h-old biofilms, but not in 24-h-old biofilm. These five Raman spectral bands may specifically associate with the mature stage of C. pseudotuberculosis biofilm.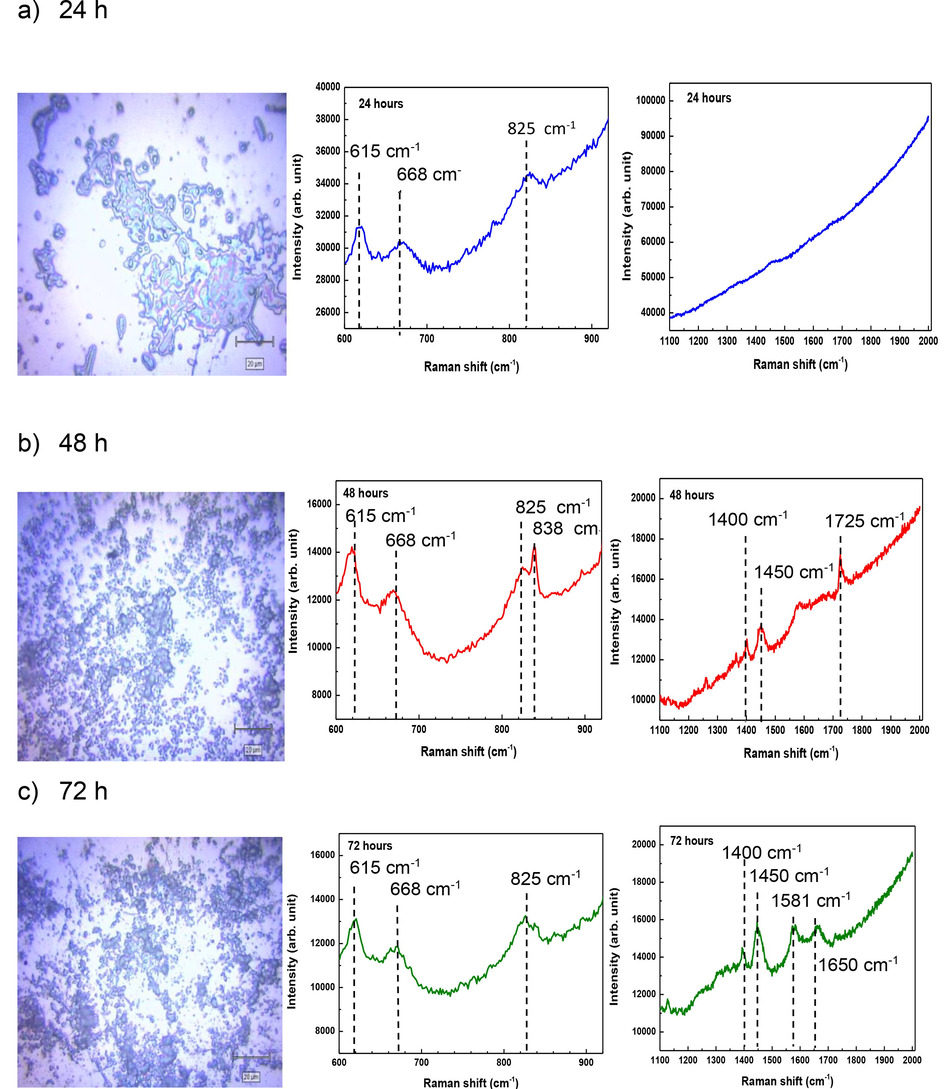
Microscopic images at 100x magnification and the corresponding averaged spectra of C. pseudotuberculosis biofilm. a) 24 h-old biofilm; b) 48 h-old biofilm and c) 72-h biofilm. Spectral regions that commonly show organic molecules in biofilms: 600–900 cm−1; 1100–2000 cm−1. Functional groups: 615 cm−1 (CCC symmetric bend phenyl ring), 668 cm−1 (Valine), 825 cm−1 (Ring breath Tyr), 838 cm−1 (phosphodiester symmetric str.), 1400 cm−1 (COO— sym.), 1450 cm−1 (COO— sym.), 1581 cm−1 (Ring breath Trp.), 1650 cm−1 (COO— asym.) and 1725 cm−1 (C⚌O str.).
3.2 Heterogeneity of C. pseudotuberculosis biofilm at 48 h and 72 h
Fig. 2 shows the Raman spectra of C. pseudotuberculosis taken at three different locations of the C. pseudotuberculosis biofilm. Raman spectral peaks in the range 1000–9000 cm−1 indicated the silicon substrate. There were no differences in all Raman spectra of C. pseudotuberculosis at 24 h. However, inconsistent Raman spectral bands at 835 cm−1 (phosphodiester symmetric str.) and 1725 cm−1 (C⚌O str.) were observed in 48 h-old biofilm and 72 h-old biofilm, showing the biochemical heterogeneity.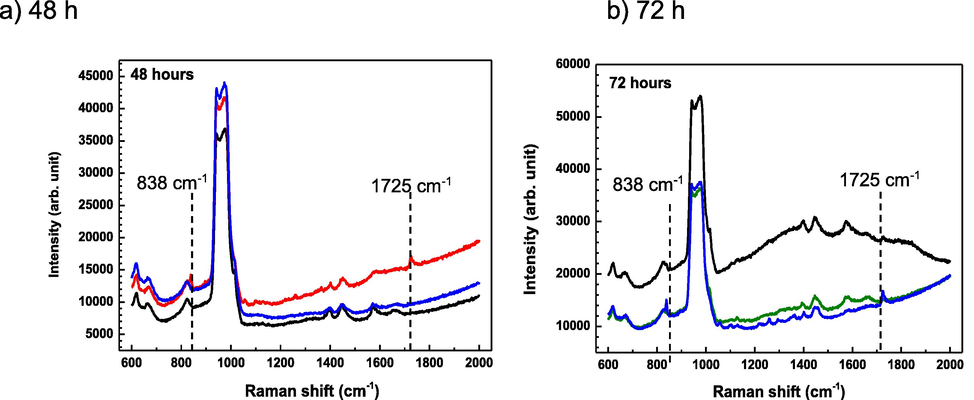
Diverse Raman spectra within the specific stage of C. pseudotuberculosis biofilm. a) 48 h-old biofilm and b) 72 h-old biofilm. Functional groups: 838 cm−1 (phosphodiester symmetric str.) and 1725 cm−1 (C⚌O str.). Different colours in each panel indicate Raman spectra taken at three different locations within single biofilm samples.
3.3 Morphology of C. pseudotuberculosis biofilm
Fig. 3 shows the morphology of C. pseudotuberculosis biofilm at a magnification of 5000x. Rod-shaped cells of C. pseudotuberculosis were clearly observed in the 24-h-old biofilm. There was only one layer of biofilm that was formed on the surface. The biofilm cells were also encapsulated in a fibrous extracellular matrix.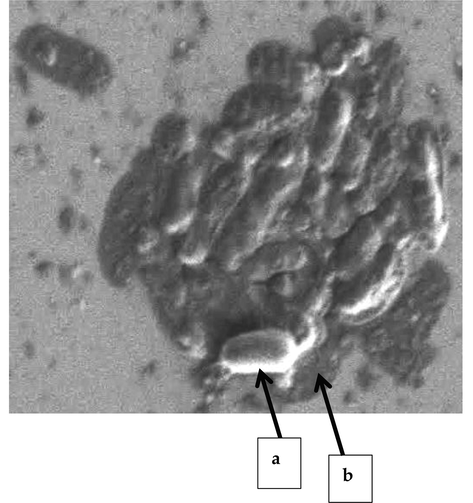
FESEM image of C. pseudotuberculosis biofilm at 5000x magnification. a) Biofilm cells; b) Extracellular matrix.
3.4 Pellicle formation at air–liquid interface
The pellicle formation was compared between C. pseudotuberculosis biofilm and S. typhimurium biofilm. Fig. 4 shows C. pseudotuberculosis pellicle biofilm at air–liquid interface. It was found that C. pseudotuberculosis biofilm formed an intact pellicle similar to that formed by S. typhimurium biofilm.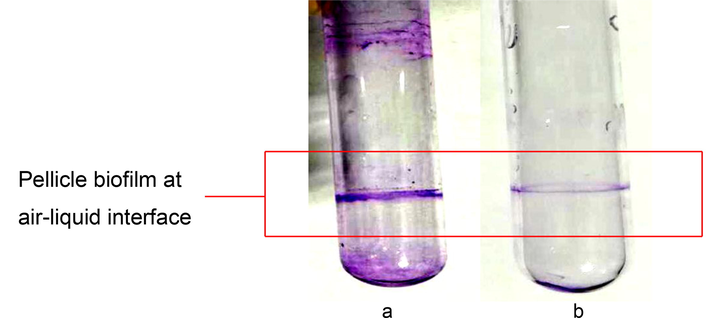
Formation of pellicle biofilm at air–liquid interface. a) S. typhimurium; b) C. pseudotuberculosis. Adequate staining with 0.5% crystal violet, 25% methanol was achieved after 5 min.
3.5 Inhibitory action of antibiotics against C. pseudotuberculosis biofilm
The biofilm susceptibility towards antibiotics was compared between C. pseudotuberculosis biofilm and S. typhimurium biofilm. Fig. 5 shows the antibiofilm activities of antibiotics. Four test concentrations of streptomycin (3.12 µg/ml, 12.5 µg/ml, 25 µg/ml, 100 µg/ml) significantly (p < 0.05) inhibited C. pseudotuberculosis biofilm. The same effect was also observed in S. typhimurium biofilm. Three test concentrations of tetracyclin (3 µg/ml, 12.5 µg/ml, 50 µg/ml) significantly (p < 0.05) inhibited C. pseudotuberculosis biofilm but not S. typhimurium biofilm. Two test concentrations of nalidixic acid (25 µg/ml, 50 µg/ml) significantly (p < 0.05) inhibited C. pseudotuberculosis and S. typhimurium biofilms while 12.5 µg/ml nalidixic acid significantly (p < 0.05) inhibited C. pseudotuberculosis biofilm but not S. typhimurium biofilm.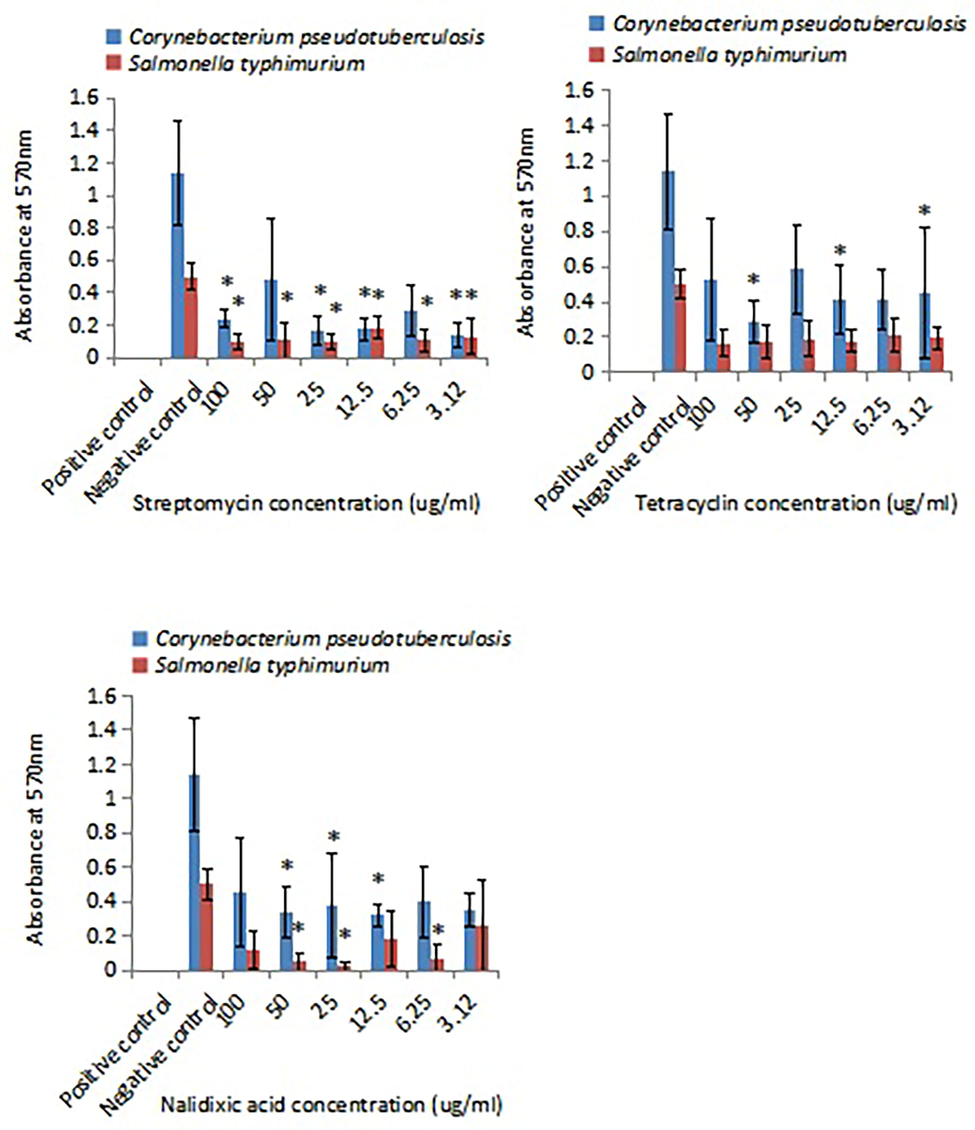
Inhibitory effects of antibiotics on C. pseudotuberculosis biofilm and S. typhimurium biofilm. Positive control: overnight inocula added with IP-protected antibiofilm cocktail; negative control: overnight inocula added with fresh broth. Each bar represents mean ± standard deviation. Significant differences (p < 0.05) when compared with control group are shown by *.
3.6 Inhibitory action of common chemicals against C. pseudotuberculosis biofilm
The biofilm susceptibility towards common chemicals was compared between C. pseudotuberculosis biofilm and S. typhimurium biofilm. Fig. 6 shows antibiofilm activities of common chemicals. Two test concentrations of EDTA (250 mM and 500 mM) significantly (p < 0.05) inhibited C. pseudotuberculosis and S. typhimurium biofilms. All test concentrations of DMSO (1.56%, 3.13%, 6.25%, 12.5%, 25%, 50%) significantly (p < 0.05) inhibited C. pseudotuberculosis biofilm but not S. typhimurium biofilm. NaOH and ethanol did not show any significant inhibitory actions against C. pseudotuberculosis biofilm and S. typhimurium biofilm.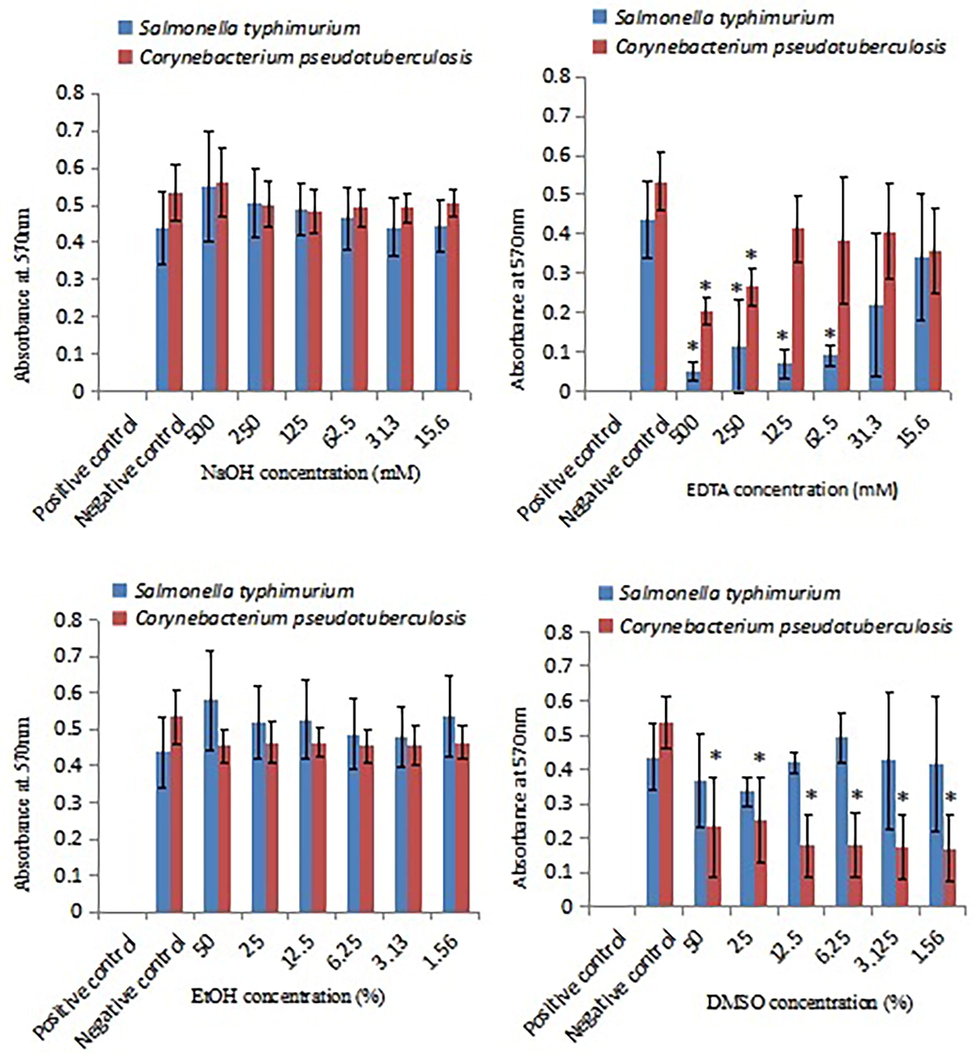
Effect of common chemicals on C. pseudotuberculosis biofilm and S. typhimurium biofilm. Positive control: overnight inocula added with IP-protected antibiofilm cocktail; negative control: overnight inocula added with fresh broth. Each bar represents mean ± standard deviation. Significant differences (p < 0.05) when compared with control group are shown by *.
4 Discussion
Proteinaceous components are important for all stages of biofilm formation. They play crucial roles in initial attachment to surface, stabilization of the biofilm matrix via interactions with exopolysaccharide and nucleic acid components, and development of three-dimensional biofilm architectures. The present study showed the presence of Raman spectral peaks associated with protein groups (615 cm−1, 668 cm−1, 828 cm−1 and 1581 cm−1) in C. pseudotuberculosis biofilm (Fig. 1). Raman spectral peak at 1581 cm−1 (Trp. proteins) may represent a component of extracellular matrix of C. pseudotuberculosis biofilm (Ivleva et al., 2009).
Multiple lines of evidences have shown that lipids are present on the plasma membrane and extracellular matrix which are important for the architectural stability of the microbial complex. In most cases, planktonic and biofilm cells exhibit different profiles of sterol and sphingolipid. Herein, Raman spectral peaks at 668 cm−1 (CN+(CH3)3 str., lipids) and 1650 cm−1 (C⚌C and C⚌O, lipids) were found to be present in C. pseudotuberculosis biofilm (Fig. 1). The Raman spectral peak at 668 cm−1 has been shown to be present in Pseudomonas aeruginosa biofilm (Jung et al., 2014).
It has been established that the dense extracellular matrix surrounding mature biofilms is composed primarily of glycoproteins and carbohydrates along with lipids and nucleic acids. Carbohydrates function in providing structure to biofilms, allowing stratification of the bacterial community and establishing gradients of nutrients and waste products. Raman spectral peaks associated with carbohydrate group (1400 cm−1, 1450 cm−1, 1650 cm−1 and 1725 cm−1) were identified in the present study (Fig. 1). These Raman spectral peaks may also represent components of extracellular matrix of C. pseudotuberculosis biofilm (Ivleva et al., 2009).
Mature biofilms from both clinical and environmental settings have been extensively investigated due to its harmful impacts and antimicrobial resistance phenotype. In most experiments, the 48-h-old biofilm and older ones are considered as mature biofilms. Herein, the mature C. pseudotuberculosis biofilms were characterized by the Raman spectral peaks associated with proteins, carbohydrates and lipids groups (Fig. 1). This result may indicate the domination of extracellular matrix of the mature C. pseudotuberculosis biofilm by high composition of protein fraction and relatively lower composition of saturated fatty acids and polysaccharides (Ramirez-Mora et al., 2019).
Physiological heterogeneity in the biofilm is due to the multilayer microbial communities and three dimensional structures that are established on the surface. In the present study, the heterogeneity in C. pseudotuberculosis biofilm based on altered Raman spectra was observed at 48 h and 72 h (Fig. 2). Spectra taken from different positions within single biofilm colonies could reveal the formation of more than one layer in the colonies (Kelestemur et al., 2018). Thus, changes in Raman spectral features are useful to explain heterogeneity in different developmental stages of C. pseudotuberculosis biofilm (Sandt et al., 2007).
FESEM analysis is useful for biofilm study because it provides information on the size, shape, production of extracellular matrix and localization within the biofilm of single bacteria. In the present study, FESEM images showed that the extracellular matrix surrounded the C. pseudotuberculosis biofilm cells and attached them to surface (Fig. 3). It is believed that extracellular matrix may play an important role in establishing C. pseudotuberculosis biofilm on surfaces (Combrouse et al., 2013; Ivleva et al., 2009; Jung et al., 2014; Ramirez-Mora et al., 2019).
Biofilm tends to form pellicle at air–liquid interface in aerobic environment. The pellicle gives a more cloudy appearance to the culture than planktonic population. Glucose-rich, cellulose-like polymer is essential for the formation of a pellicle at the air–liquid interface. In the present study, C. pseudotuberculosis biofilm successfully formed the pellicle at air–liquid interface like S. typhimurium biofilm (Fig. 4). According to Jolly (1965), the pellicle formation contributes to the pathogenesis of Corynebacterium ovis. Thus, the pellicle formation observed herein may also play role in the pathogenesis of C. pseudotuberculosis.
Streptomycin controls the bacterial infection by inhibiting the binding of formyl-methionyl-tRNA to the 30S subunit during protein synthesis. In the present study, streptomycin effectively inhibited C. pseudotuberculosis biofilm (Fig. 5). This finding contradicts Olson et al. (2002) that demonstrated the resistance of C. pseudotuberculosis biofilm against streptomycin with the minimum biofilm eradication concentration (MBEC) values greater than 256 µg/ml. The disparity in this case is probably due to different growth medium used in the respective experiment whereby nutrient broth was used in the present study whilst tryptic soy broth supplemented with fetal bovine serum was used in the study performed by Olson et al. (2002). The present study used only nutrient broth because C. pseudotuberculosis biofilm was being compared with a veterinary model pathogen namely S. typhimurium to investigate the pellicle formation and antibiofilm activity.
Inhibition of bacterial growth by DMSO is known to involve membrane perturbation. The present study revealed the inhibitory action of DMSO against C. pseudotuberculosis biofilm (Fig. 6). Inhibition of C. pseudotuberculosis biofilm by four disinfectants namely iodine, chlorhexidine, chlorine and quaternary ammonia has previously been reported (Sá et al., 2013). The present finding provides the first evidence for antibiofilm activity of DMSO against C. pseudotuberculosis and also suggests the potential use of DMSO as a surface disinfectant to control microbial surface attachment (Siddiqui et al., 2016).
Based on the significantly effective test concentrations, discrepancies in antibiofilm susceptibility pattern between C. pseudotuberculosis biofilm and S. typhimurium biofilm were observed. In Fig. 5, C. pseudotuberculosis biofilm was less susceptible to streptomycin and more susceptible to tetracyclin, as compared with S. typhimurium biofilm. On the other hand, C. pseudotuberculosis biofilm was less susceptible to EDTA and more susceptible to DMSO, as compared with S. typhimurium biofilm (Fig. 6). These discrepancies remain not well understood, however, the possible explanations are possibly due to the presence of outer membrane proteins in Gram-negative pathogen (Rollauer et al., 2015) and species-dependent antimicrobial effects (Fernandes et al., 2020).
5 Conclusions
We have demonstrated the biochemical composition and morphology of C. pseudotuberculosis biofilm. The pellicle formation of C. pseudotuberculosis biofilm is similar to that of S. typhimurium biofilm while the antibiofilm susceptibility pattern of C. pseudotuberculosis is slightly different from that of S. typhimurium. To our knowledge, the present study represents the first effort to extensively characterize the biofilm formation by C. pseudotuberculosis that may mediate the persistence of CLA in small ruminants. A detailed investigation on how these antimicrobials could inhibit C. pseudotuberculosis biofilm at gene and protein expression levels need further attention.
Acknowledgement
The authors are grateful to Faculty of Science, University of Malaya Kuala Lumpur, Malaysia for providing technical advice on Raman spectroscopy and FESEM.
Funding
This research was funded by Malaysian Ministry of Higher Education under a research grant, 600-IRMI/FRGS 5/3 (417/2019).
Declaration of Competing Interest
The authors declare that they have no known competing financial interests or personal relationships that could have appeared to influence the work reported in this paper.
References
- Abattoir survey on caseous lymphadenitis in sheep and goats in Tanta, Egypt. Small Rum. Res.. 2010;94:117-124.
- [CrossRef] [Google Scholar]
- Vaneechoutte, M. Identification of Corynebacterium pseudotuberculosis isolates from sheep and goats by PCR. Vet. Microbiol.. 2002;88:75-83.
- [Google Scholar]
- Quantification of the extracellular matrix of the Listeria monocytogenes biofilms of different phylogenic lineages with optimization of culture conditions. J. Appl. Microbiol.. 2013;114:1120-1131.
- [CrossRef] [Google Scholar]
- Bacterial Biofilms: a common cause of persistent infections. Science. 1999;284:1318-1322.
- [CrossRef] [Google Scholar]
- Short communication: isolation frequency of bacteria causing lymphadenitis and abscesses in small ruminants in central Spain. Small Rum. Res.. 2017;154:5-8.
- [CrossRef] [Google Scholar]
- Antimicrobial activity of glycolic acid and glyoxal against Bacillus cereus and Pseudomonas fluorescens. Food Res. Int.. 2020;136
- [Google Scholar]
- In silico identification of essential proteins in Corynebacterium pseudotuberculosis based on protein-protein interaction networks. BMC Syst. Biol.. 2016;10:103.
- [CrossRef] [Google Scholar]
- Differential protein expression patterns between planktonic and biofilm cells of Salmonella enterica serovar Enteritidis PT4 on stainless steel surface. Int. J. Food Microbiol.. 2013;162:105-113.
- [CrossRef] [Google Scholar]
- Caseous lymphadenitis in sheep flocks of the state of Minas Gerais, Brazil: prevalence and management surveys. Small Rum. Res.. 2009;87:86-91.
- [CrossRef] [Google Scholar]
- Proteome scale comparative modeling for conserved drug and vaccine targets identification in Corynebacterium pseudotuberculosis. BMC Genomics. 2014;15
- [Google Scholar]
- An outbreak of caseous lymphadenitis in a Norwegian ram circle and attempts to eliminate the disease. Small Rum. Res.. 2012;106:25-26.
- [CrossRef] [Google Scholar]
- Towards a nondestructive chemical characterization of biofilm matrix by Raman microscopy. Anal. Bioanal. Chem.. 2009;393:197-206.
- [CrossRef] [Google Scholar]
- The pathogenic action of the exotoxin of Corynebacterium ovis. Comp. Path.. 1965;75:417-431.
- [Google Scholar]
- Evaluation of antibiotic effects on Pseudomonas aeruginosa biofilm using Raman spectroscopy and multivariate analysis. Biomed. Opt. Express. 2014;5:3238-3251.
- [Google Scholar]
- Raman and Surface-Enhanced Raman scattering for biofilm characterization. Chemosensors.. 2018;6(5)
- [CrossRef] [Google Scholar]
- A survey of caseous lymphadenitis in small ruminant farms from two districts in Perak, Malaysia – Kinta and Hilir Perak. Trop. Biomed.. 2008;25(3):196-201.
- [Google Scholar]
- Can vaccinating sheep reduce the occurrence of caseous lymphadenitis? Vet. Evidence. 2020;5
- [Google Scholar]
- Biofilm bacteria: formation and comparative susceptibility to antibiotics. Can. J. Vet. Res.. 2002;66:86-92.
- [Google Scholar]
- Raman spectroscopic characterization of endodontic biofilm matrices. J. Spectrosc.. 2019;1–7
- [CrossRef] [Google Scholar]
- Outer membrane protein biogenesis in Gram-negative bacteria. Philos. Trans. R. Soc. Lond. B Biol. Sci.. 2015;370(1679):20150023.
- [CrossRef] [Google Scholar]
- Activity of Disinfectants and Biofilm Production of Corynebacterium pseudotuberculosis. Pesquisa Vet. Bras.. 2013;33(11):1319-1324.
- [Google Scholar]
- Confocal Raman microspectroscopy as a tool for studying the chemical heterogeneities of biofilms in situ. J. Appl. Microbiol.. 2007;103:1808-1820.
- [CrossRef] [Google Scholar]
- The use of dimethyl sulfoxide in contact lens disinfectants is a potential preventative strategy against contracting Acanthamoeba keratitis. Contact Lens Anterior Eye. 2016;39(5):389-393.
- [Google Scholar]
- Antibiofilm activity and mode of action of DMSO alone and its combination with afatinib against Gram-negative pathogens. Folia Microbiol.. 2018;63:23-30.
- [Google Scholar]
- Subtractive protein profiling of Salmonella typhimurium biofilm treated with DMSO. Protein J.. 2017;36:286-298.
- [Google Scholar]
- In silico analysis of essential tricarboxylic acid cycle enzymes from biofilm-forming bacteria. Trends Bioinf.. 2014;7:19-26.
- [Google Scholar]
- Proteomic analysis of Pseudomonas aeruginosa treated with Chromolaena odorata extracts. Malaysia J. Microb.. 2020;16(2):124-133.
- [Google Scholar]


