

Translate this page into:
Big data analysis and optimization and platform components
-
Received: ,
Accepted: ,
This article was originally published by Elsevier and was migrated to Scientific Scholar after the change of Publisher.
Peer review under responsibility of King Saud University.
Abstract
Communication operators are paying more and more attention to the value of data and are demanding more and bigger data technologies. Many companies have started to take advantage of their resources to tap the value of data and develop their own core business. The use of a high-performance, secure, scalable and easy-to-manage big data management system will help companies avoid the tedious system operation and maintenance, especially in the communication business system, and help them focus on their own business development. In this paper, we first investigate existing data management systems and analyze their strengths and weaknesses. In response to the problems of not too light, insufficient timeliness of data migration, and not enough innovation in data analysis, we design a more efficient, convenient and easy-to-use big data management platform. Firstly, the big data management system is designed. According to the process of big data processing, six modules of interface acquisition, program scheduling, data aggregation, platform alerting, marketing analysis and visualization are designed based on the communication big data platform architecture. The management system mainly focuses on data access and data mining analysis, so the main modules of this paper are program scheduling, data aggregation and marketing analysis modules, while other modules are based on the original big data management system of the enterprise with a small amount of improvement. In order to realize the needs of dynamically creating data testing environment and isolating production and experimental environments under the communication application scenario, a mechanism of the big data system for production and the virtualized system for experiments acting together is proposed. Then the corresponding scheduling module architecture process is designed and built, the corresponding scheduling rules and related scheduling information field tables are designed, and the data aggregation storage is improved. The program scheduling module was designed to be more lightweight and easy to use, and the data migration module increased the timeliness of data migration.
Keywords
Big data platform
Cloud computing technology
Platform construction
Network database

1 Introduction
With the rapid development of Internet technology this year, the amount of data in enterprises has grown explosively, especially in the communications industry (Alic et al., 2019). In the context of the gradual maturity of big data-related technologies and the proliferation of business data in the communications industry, the traditional BI (business analysis) system has encountered a bottleneck, and the new big data business analysis system has gradually come online. The interface layer of the data warehouse of the big data platform will access a large amount of data every day, which needs to be saved and used to make decision analysis with the real-time generated data together with the previously stored business data. For different business scenarios, the way of data analysis varies (Bergamini et al., 2018). Problems related to data collection, storage and analysis queries are also currently addressed by corresponding software. Many components, many nodes and high complexity are the basic features of the big data platform. For the communication industry big data platform, there are many components and nodes, and also some business data as well as indicators (Cai et al., 2019). The above need to be effectively managed, especially in the cloud computing technology is increasingly mature, the utilization of the system and computing resources is increasingly high today, a highly efficient and lightweight management system of the big data platform is particularly necessary. Network Database (Network Database, hereinafter referred to as ND), is a virtual database built and run through the Internet and cloud system across basic data carriers such as computers, servers, etc (Chen et al., 2019). The relationship between data in ND concept is one-to-one and one-to-many. With the increase of Internet popularity, the data storage pressure brought by the use of network database for video, image and various other types of data preservation has increased rapidly. With the popularity of big data platform applications, some corresponding platform management systems have been designed. Apache Ambari, Cloudera Manager and Huawei FI (FusionInsight) are the more commonly used at home and abroad, because Huawei FI big data platform management system is mainly for Huawei version of hadoop application scenarios for platform management, there are great limitations.
Based on the cloud platform, the network database in the big data application system is optimized to realize the data priority access function in ND system by integrating cloud computing; the storage capacity, concurrency and utilization rate of ND system are greatly improved by cloud computing and virtual technology (Chi et al., 2018). CloudDB, i.e. cloud computing + network database, is a network database optimized or deployed to virtual cloud environment, which can realize on-demand payment, on-demand expansion and storage consolidation according to users' own individual requirements. It can greatly enhance the storage capacity and utilization rate of traditional database. At the same time, the emergence of CloudDB technology optimizes many back-end functions of traditional databases, with the advantages of high personalization, scalability, and support for effective distribution of resources (Esposte et al., 2019). So this side is mainly for the first two to introduce. The former is an Apache open source project that allows users to automate deployment, configuration and component installation for the entire cluster (Flanagan and Ogata, 2018). In the Web interface, you can select the components and services to be installed and the number of nodes you need, as well as provide recommended configurations. Ambari is open source and supports user-driven development. The daily volume of the communication industry is huge, and the daily access to the data warehouse of the communication big data platform is also huge. How to process the accessed data regularly and quantitatively, and access it to the data warehouse of the big data platform completely and accurately, is the problem we have to solve. Many subsequent business processing and related components of the data sources are based on the data warehouse of the big data platform. Because the communication big data platform has many components and nodes, each component and node occupies different resources, including memory, hard disk and network (Gröger, 2018). How to ensure normal access to data warehouse data and normal operation, how to ensure the normal operation of the components and nodes of the communication big data platform, and operations and maintenance management work is the most important to solve these problems (Kim and Il, 2020). Traditional human operation and maintenance management has been time-consuming and may not achieve the desired results, so it is necessary to design a lightweight management system for the communication big data platform. However, how to design this platform to be able to make this platform can really solve the actual problems in the production of the communication industry is also the purpose of designing this communication data management system (Kochovski et al., 2019).
In this paper, we designed and implemented six modules: interface acquisition, program scheduling, data aggregation, platform alarm, marketing analysis, and visualization. We mainly worked on the modules of program scheduling, data aggregation, and marketing analysis, and also designed the testing environment of big data through the pass technology of cloud computing. Because the number of components and nodes managed by operation and maintenance managers is large, it is impossible to grasp the situation of each node. The system should scan and monitor each component and node in real time, find abnormal conditions to send alarms to the operation and maintenance managers in time, and be able to locate the cause of some frequently occurring problem failures. The related scheduling function should also be available to enable the operation and maintenance managers to schedule the programs and scripts running on the big data platform. The functions of the whole system should not be too complicated and bulky, and the functions of each module should be clear and each of them should have its own responsibilities, and the operators should be simple and efficient to operate. The business competition in the communication industry is strong, and the innovative requirements for the big data platform are getting higher and higher. How to do a good job of analyzing the data and digging out the value from the huge amount of customer data is the problem we need to solve in this platform.
2 Related work
Cloudera Manager can also automate the deployment of big data platform, operate each component service and real-time monitoring. Apache Ambari and Cloudera Manager can meet the management needs of big data platforms in general application scenarios. But for the communications industry, they do not meet some important requirements well. For example, they do not support the dynamic creation and management of data testing environments, but data testing environments are an important requirement for communication applications, which require virtualization-related technologies (Li et al., 2020). Communication industry application scenarios, tasks or applications running in the experimental environment can take up resources and affect the production environment. Ambari and Cloudera have a single platform and use two clusters to build different platforms, and also need to develop different data migration functions (Makkie et al., 2019).
With fewer operations and maintenance staff and more R&D staff, there is a need for lightweight management of big data platforms to reduce management difficulties and costs. Data warehouse is a subject-oriented (Subject Oriented), integrated (Integrate), relatively stable (Non-Volatile), reflecting historical changes (Time Variant) data collection, used to support management decisions (Peng et al., 2018). Data warehouse is developed along with enterprise informatization, in the process of enterprise informatization, with the upgrade of information technology tools and the application of new tools, the volume of data becomes larger and larger, more and more data formats, more and more demanding decision-making requirements, data warehouse technology is constantly evolving (Ferraro Petrillo et al., 2021). Data warehouse is mainly divided into two aspects of data warehouse construction and data warehouse construction, the early data warehouse construction mainly refers to the enterprise's business database such as ERP, CRM, SCM and other data in accordance with the requirements of decision analysis modeling and aggregation into the data warehouse engine, its application to report-based, the purpose is to support management and business personnel decision-making (medium and long-term strategic decision-making) (Qi et al., 2021).
With the development of business and environment, both aspects are undergoing drastic changes. As IT technology goes Internet and mobile, data sources become more and more abundant, and unstructured data, such as website log, IoT device data, APP buried data, etc., appear on the basis of the original business database, which are several orders of magnitude larger than the previous structured data and put forward higher requirements for ETL process and storage (Sun and Zhang, 2020). The online nature of the Internet also pushes business needs to real-time, and it is becoming more and more common to adjust strategies based on current customer behavior, such as inventory management and operation management during promotions (i.e., both medium- and long-term strategies and short-term operations) (Wang et al., 2019). At the same time, the company's business after the Internet has led to a sharp increase in the number of customers served at the same time, and some situations are difficult to fully handle manually, which requires automatic machine decision-making. For example, fraud detection and user auditing (Woo et al., 2018).
To address the growing demand for real-time data processing, some companies are converting parts of their big data infrastructure to a streaming processing model (Wu et al., 2019). Streaming data-based infrastructures not only better address latency-sensitive data processing business needs, but also provide more in-depth business insights. In addition, the streaming data processing platform makes traditional data warehouse construction simpler and more flexible. The key part of the streaming infrastructure is the streaming computing engine (Yao et al., 2019). A good streaming computing engine allows the business to provide low latency, high throughput, and strong consistency even with stateful computing. In the field of streaming computing, it is actually very difficult for the same system to be both fault-tolerant and high-performance. In traditional batch processing, when a job fails, the failed part of the job can simply be rerun to fix the data loss due to the previous failure (Zhao et al., 2021). This is perfectly feasible for batch processing because batch data is static and can be replayed from start to finish. In a continuous stream processing model, this processing idea is not at all feasible.
3 Platform management based on big data technology
3.1 Platform management requirements
In order to reduce the difficulty of system management and effectively manage the big data platform, the large management system needs to provide lightweight management functions to help operators' operation and maintenance personnel master the overall operation status of the platform, the operation status of the infrastructure, the operation status of components and services, analyze the platform operation log in real time, and notify the operation and maintenance personnel of abnormal information alarms. The management requirements of the platform can be realized based on big data technology. From the perspective of system design and implementation, the management requirements of the platform based on big data technology include five requirements such as collection, aggregation and storage, analysis, query, alarm and visualization, as shown in Fig. 1.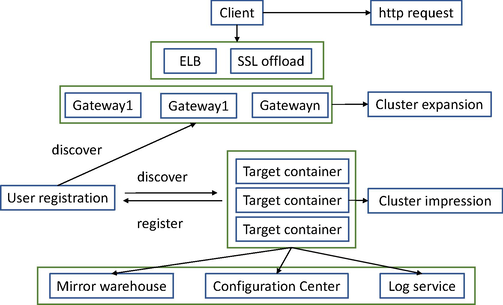
Management system requirements.
As the data collection process has not only the requirement of real-time, but also the requirement of accuracy. There are many data interfaces, classified as incremental interfaces and full interfaces according to different business systems, and different data sources use different collection methods. In order to ensure the timeliness of the evaluation, it is therefore necessary to ensure that the data collection, aggregation and upload storage are highly concurrent. Considering that the nodes are in decentralized collection mode, these data have to be collected, aggregated and classified first, and different queues arrange different data for the use of subsequent modules. The buffering role of the queue can guarantee the stability of the system, and the consumer side can read the data in bulk. The collected data needs to be persistently stored, incremental data storage is also supported by the big data platform, and the dynamic expansion function must be available by the data persistence module. To achieve the purpose of state analysis and alarming the operational data of the big data platform platform, nodes, components and services, according to the real-time requirements and different calculation scales, you can choose real-time calculation or offline calculation. The real-time calculation can directly read the data in the queue of the data aggregation module for analysis, or read the data in the data persistence storage module for offline calculation and analysis. For different operation status evaluation schemes, this paper needs to propose different operation status evaluation models to show the operation status of platform nodes, components and services by calculating different evaluation indexes. Among them, different models are suitable for different components or services, and it is necessary to mention the special characteristics of each different component or service.
Business people and developers extracting usage data are able to operate only after persistent storage, because the platform stores a large amount of data, and sometimes it is necessary to fetch the exact data for a specific time period and a specific log type. It may be complicated to provide the calculated or analyzed data directly to the users, but if the visualization method is used to present the overall index situation of the platform, it gives the platform users a very intuitive feeling. For the purpose of providing stable services to users, there are certain standards for system performance in the communications industry. The overall performance depends on the state of the local system, and the state of the local modules integrally assesses the whole. In order to guarantee that the performance can meet the business requirements, we need to focus on the modules that may have performance bottlenecks. From the related requirement analysis, the requirements of the system are mainly based on the test environment management requirements of docker cloud technology and the platform management requirements based on big data technology, so the optimization of system performance should be proposed for the problems in the two requirements where performance bottlenecks may exist. The main issues include the creation time of test environment containers, which is generally within 10–20 min for a node. The collection of interfaces, which should be kept from generating crush. The rate of data migration between components, because the migration is generally offline, so the speed is generally maintained at an average of 3 Mb/s. The query time of the system frontend business data is generally kept below 8 s.
3.2 Big data platform architecture
The big data platform contains the whole set of processes for big data processing, and the overall architecture of the platform is shown in Fig. 2. It can be seen that the platform is divided into three layers, physical, platform and application. First, the platform layer, because the platform layer involves more components and modules, so we mainly introduce the more important parts of it. Since our management system is mainly designed for the communication big data platform, the following is a specific introduction to the big data platform.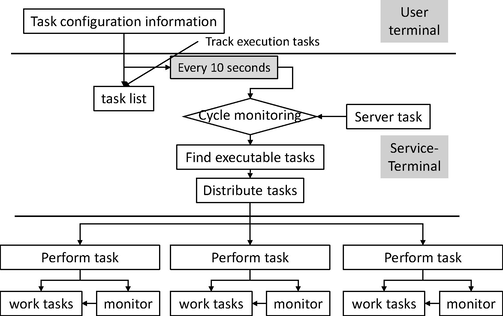
Big Data platform overall architecture.
First of all, the data comes from the data warehouse architecture, specifically the db2 local data interface; after that, the data is collected and extracted through sqoop and flume components, which can be aggregated and divided according to the dimensions; after uploading to hdfs, relevant etl operations are performed again, such as code value conversion, merge, etc. There are more than two main components for caching massive data, namely, HBase and kafka data storage components in the platform layer. Zookeeper is a communication service and failover mechanism; kafka meets the needs of log processing and high throughput; Zookeeper is used to allocate cluster resources and is also responsible for communication between components. The scheduling module facilitates the management of etl programs and shell scripts in the data warehouse, and enables people to understand the running status of the programs. Finally, there is the algorithm analysis module, including the traditional machine learning module and the deep learning module. In this paper, we mainly discuss the application of deep learning model on big data platform and how to interact with big data management system module. Next is the physical layer, which mainly covers servers, switches, disk arrays, etc., to provide services for the applications above. Because the platform layer is divided into production and test environments, thus the physical layer equipment is also divided into two types for production and test for production big data systems and experimental systems. The physical devices are classified in order to isolate the two different usage scenarios of production and experiments on the bottom layer, so that the relevant computing and storage resources dedicated to production services and production applications will not be occupied by the experimental environment, which also has its own resources, thus achieving performance isolation. The production application, data experiment application, and test application are used in the application layer, and the support of the big data system is mainly provided by the production application, and the data experiment application and test application are mainly served by virtualization.
The test environment container is the virtual node for development and analysis, which mainly relies on virtualization. Users are able to use the Big Data Management System to flexibly create the management of experimental containers so that users do not have to build the environment on the cluster that can be used for big data analysis and development and create it through the management system; the experimental containers that have been created are managed through the management system. The containers can be used independently for data experiments and related business tests. As shown in Fig. 3 below, A, B and C represent three original docker nodes, three docker image nodes are generated from the original nodes, and finally three sets of clone nodes are cloned from the images.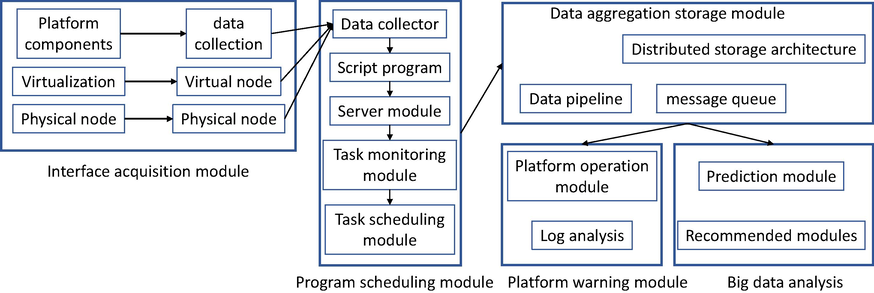
Diagram of the creation process of the test environment experiment container.
The operation and maintenance engineers effectively manage the big data platform with the help of the management system. The collection interface module aggregates the data of each component and cluster node of the platform and stores and analyzes them, and the current operation status of the big data platform as a whole, including the operation status of each component, service and node, is also visually represented through charts. Interface acquisition module, data aggregation storage module, program scheduling module, big data platform and log analysis alarm module and visualization module are the components of the platform management system. The acquisition module in the management subsystem completes the acquisition of data from the operating time periods of big data platform components and services, virtualized systems and physical nodes, while formatting the acquired data and transferring them to the data aggregation and storage module, which performs data aggregation and data storage in a highly concurrent manner, and the first action stores the data persistently, and the other data is distributed to the data analysis module The other data is distributed to the data analysis module. The marketing analytics module uses streaming computing techniques and related deep learning prediction algorithms to analyze the gender and age of users and product usage, and to make targeted product recommendations for different customer genders and ages. The last query visualization module reads the historical data from the storage module and stores the real-time data from the analysis module to provide data queries and visualization of relevant data information for subsequent business analysis by users.
3.3 Interface acquisition module design
Considering that there are many kinds of components and services as well as different collection methods and data meanings are the characteristics of big data platform, we have to develop collection modules for different components or services separately. After the source collects the data, the user can receive the data through the part of the interface, and the data obtained in this way is rich and complete. The collection method is a Java process on the node, which will periodically start a timed task to access the interface provided by the component or service, filter and extract the collected data, then format the data and send it to the data aggregation storage module. Components and services that do not provide data interfaces can collect data by parsing the logs, for example, after the sqoop extraction task is completed, the log file will record data related to the task execution. First, the relevant interface is developed to get the script, then the script is deployed to the appropriate node, then the script is matched and parsed, then the data is extracted and formatted, and finally sent to the data aggregation storage module. The virtualization system is an operating environment created using virtualization technology, and thus the underlying layer is the virtual node. The operational data of the virtual nodes is supported by the open interfaces provided by the virtualization system. A Java process is started on a node to launch components and services and send the formatted data to the aggregation and storage module for persistent storage. For data collection from the physical datanode, a script needs to be developed for deployment to the physical node. The script will get the CPU, memory, hard disk, network and other usage data of the physical node by calling Linux commands and then return the results of the Linux commands. Matching, parsing strings and extracting important fields, formatting them and sending them to the aggregation and storage module. Data in different format structures are uniformly formatted for storage and analysis. Due to the stage of building and implementing data management systems in various business systems, technical and other economic and human factors, companies accumulate a large amount of business data during development using different storage methods (including the data management system used), as shown in Fig. 4. From simple file databases to complex network databases, this is the source of heterogeneous data for the enterprise.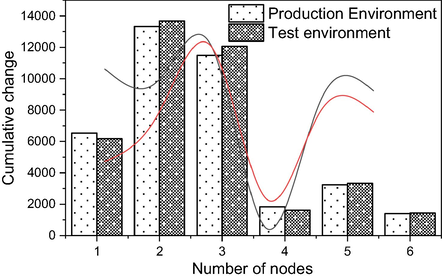
Cumulative change in interface data.
After data collection, ETL (Extraction, Loading, Transformation) and other related processes are required for data processing, which are mainly carried out through corresponding scripting programs, and thus different data processing programs are available for different business systems. Through the program interface, the completion status of the program is monitored in real time and stored in the mysql database. For the failed programs, we can analyze the reasons for the programs that run too long and get stuck, and restart them automatically, etc. The previous scheduler is defective in this respect, as the status monitoring of the program is not comprehensive enough, and the control of the program and the configuration of the automation script are not comprehensive enough, so this module is designed to make up for these defects. This module mainly consists of two functional parts, ETL and related script deployment folder. The overall operation interface and execution method of the big data scheduling platform is the same as that of the existing warehouse scheduling system. The main added function point is that the scheduling platform can execute tasks in a distributed manner in the big data cluster mode. It uses SSH protocol, which is common in Linux systems, for communication. The advantage of using this model is that it is possible to distribute tasks running different types of tasks to different servers for execution, instead of putting the task scripts on one server for execution. And it can be modified accordingly according to the task type characteristics. Increase the multi-task distribution execution among different cluster systems. Increase the coupling between programs and reduce the burden of scheduling server resources.
4 Testing of data management system related module functions
The test environment of communication data management system is mainly divided into production environment and test environment, and the test environment, which is also known as virtualized environment, is mainly built by virtualization technology for the platform. This chapter mainly combines the main line of the previous system establishment and each component of the platform for testing, and carries out the testing work of each function of the system, and the following is the environment configuration for this test. The software environment refers to the system, JDK file, big data components and corresponding services of the production big data platform, as well as the system, JDK file and web server software of the virtual node in the test environment container, etc. We can apply for user accounts in the background and assign corresponding permissions to the users. Fig. 5 below shows the allocation of the relevant permissions.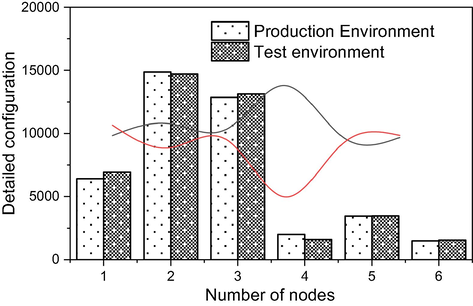
Detailed test configuration of platform software.
Redhat, as an underlying platform operating tool that coexists with desktop and server versions, has the performance advantages of simplicity, conciseness, and stability when applied to cloud database systems, as well as strong system scalability, which can help cloud database systems achieve massive data processing. The operating system has the ability to visualize various types of information, which can expand the physical storage space of the system to a certain extent, and improve the efficiency of big data processing and communication broadband utilization, Fig. 6 shows the operational latency when choosing to use Redhat to set up the platform operating system. MapReduce has the advantages of simple development, high scalability, and fault tolerance, and can automatically arrange the fault-free system nodes to operate in case of node failure during operation, which can optimize the Hadoop cluster operation to a certain extent and realize the distributed computing of large amount of data. A topic can be divided into multiple partitions, each of which is an ordered queue. Each message in a partition will be assigned an ordered ID (offset).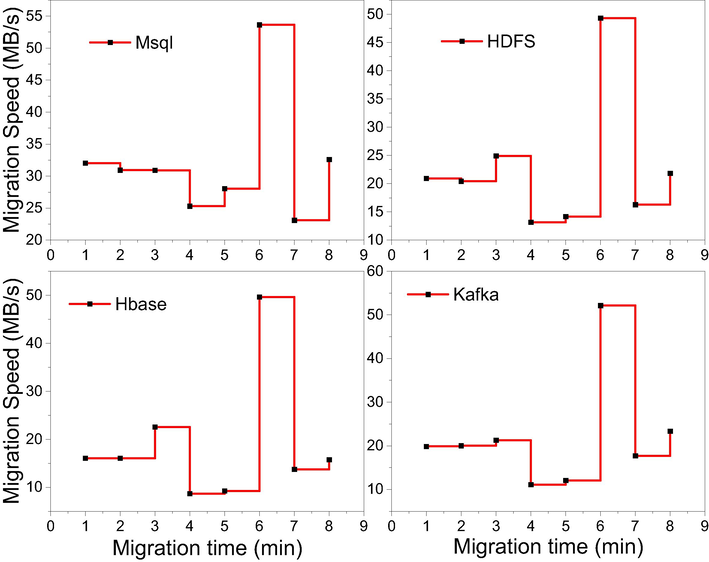
Operation Latency Test.
Based on the variety of communication services, and the corresponding confidentiality mechanism reasons. We design this module mainly for business analysis, and precision marketing. The experimental dataset used in this module comes from TalkingData's Chinese cell phone user dataset. TalkingData is a data ecosystem centered on developer service platform, data service platform, and data commercialization platform, which covers more than 2 billion independent smart devices and serves 100,000 mobile applications and more than 80,000 application developers. TalkingData is exploring the use of behavioral data from over 70% of the 500 million mobile devices active in China every day. The data comes from the TalkingData SDK, which is integrated into mobile apps, and TalkingData serves as a service term between TalkingData and mobile app developers. This data adoption has been fully approved and consented to by the users of the application and has been anonymized to protect privacy. Due to confidentiality, we do not provide detailed information on how we obtained the gender and age data. Please consider them as accurate underlying facts for predictions.
There are many types of resources that can be stored in the cloud database, such as file logs and video data for individual users, as well as relational data and object data for enterprise users. The types of data stored in the cloud database include data of different nature such as structured and unstructured. The system is built to integrate the structured and unstructured data in the cloud database so that users can use the cloud database service bus to pre-process, transfer, and visualize the data. The cloud database is built using HiveSQL tool as the main tool for data integration and pre-processing, which further enhances the system control of large-scale data. The cloud database needs to store huge amount of data of various types of resources. Due to the huge amount of data, if the data is not filtered for the data, database users will often face disorderly, messy, and complex data application scenarios when they perform operations. In this paper, we use data mining and analysis techniques to optimize the timeliness of data utilization in the cloud database (Fig. 7), which significantly reduces the time for operators to process data addition, deletion, and checking. The partitions of the logs are distributed among the servers in the Kafka cluster, and each server processes the data and requests shared partition resources. Each partition is replicated by a configurable number of servers for fault tolerance. Each partition has one server as the leader and zero or more servers as the follower. Leader handles all read and write requests to the partition, while follower passively replicates the leader. Each server acts as a leader for some partitions and as a follower for others to achieve load balancing. Like queues, user groups allow you to handle a series of processes separately, and Kafka allows you to broadcast messages to multiple consumer groups. A message queue has a message partition, just like publish and subscribe. A message partition is a partition where a topic will be divided into many partitions. Topics are grouped in a physical way. The platform performs real-time analysis and aggregates the results, and the information with abnormal conditions will be notified to the operation and maintenance staff in the form of alarms. This section introduces the overall architecture design, interface acquisition module, data aggregation and storage module, program scheduling module, big data platform alarm module and visualization module, etc.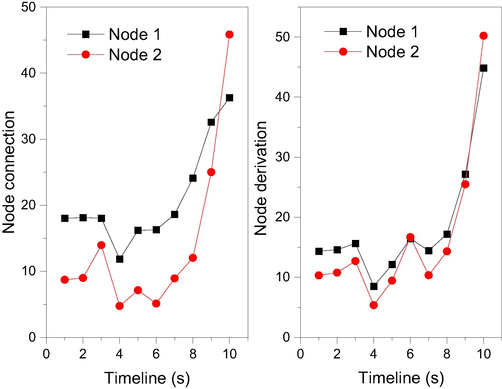
Cluster optimization for cloud database.
Redis is a high-performance storage component based on in-memory persistent logging and key-value databases, and provides APIs in multiple languages. It uses a distributed implementation of consistent hashing of keys for key distribution against Redis nodes. The hash value calculation supports both MD5 and MurmurHash to achieve consistent hashing, and MurmurHash for efficient hashing is generally the default method. jedis is modified mainly by the partitioning module, which supports partitioning with It also modifies the underlying structure of JedisPool so that it is connected to the pool. Depending on the ShardInfos, different jedis connection clients are created to achieve the partitioning effect and to be invoked by the provisioning layer. The whole distributed framework uses hornetq to remove abnormal Redis nodes, and adding new nodes can also be added by overloading methods. The above implementation of the distributed architecture can meet the needs of the project, as shown in Fig. 8. In addition, certain cached data for certain important purposes can be set separately from certain Redis nodes, setting a specific priority for them to be used.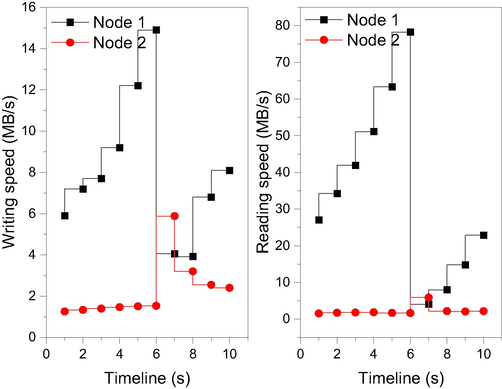
Node information write changes.
The data collected by various data collectors will be aggregated into the message queue Kafka, and different data will be written to different topics. Real-time abnormal state analysis. The abnormal state analysis and alerting is done by Storm streaming computing framework, and KafkaSpout consumes the operational data of each node and component from Kafka. The data is then distributed to RuleBolt for analysis using pre-defined alerting rules to determine whether the alerting rules are met. AlertBoult sends an alert email to notify the administrator. The collected raw operation data is consumed from kafka and written to Hbase for persistent storage, and then the three Java scheduled tasks (platform overall operation status analysis task), component and service operation status analysis task, and infrastructure operation status analysis task) periodically read the collected raw data from Hbase for analysis.
5 Conclusion
The core technology of big data ecology is more perfect, the infrastructure, data collection, data storage, data analysis and other aspects of big data application scenarios provide a complete solution, and for different segmentation scenarios, there are different technical solutions and it matches, which greatly reduces the cost and difficulty of large-scale data processing for enterprises. In particular, the cloud computing architecture system is becoming more and more mature today, big data is also more dependent on the cloud computing-related technologies, and the two are complementary to each other. In the communication application scenario, big data application innovation has become an important demand. In order to meet the innovation of big data applications, communication operators need an independent data testing environment for business data analysis and related application development.
The use of cloud computing containers also makes the creation of test environments more convenient and enables better data experimental analysis and testing. In order to support the dynamic creation of data test environments, the support of virtualization systems is required. In order to easily use the business data in production at any time in the data testing environment, it is also necessary to be able to implement data migration from the production environment to the data testing environment. Considering the factors that the number of application developers and data developers is large and the number of big data platform operation and maintenance personnel is small, we put forward new functional requirements for the platform management system, which is to have the management system help the operation and maintenance personnel to manage the big data platform effectively, help the operation and maintenance personnel to master the overall status of the platform, infrastructure, components and services, and other aspects of operation, and be able to send the real-time analysis results of the operation logs.
In particular, abnormal information can be fed back to O&M staff in a timely manner. In response to the special business scenarios and needs of the communication industry, this paper conducts research and does some work related to the design and implementation of the communication data management system. In order to realize the needs of dynamically creating data testing environment and isolating production and experimental environments under the communication application scenario, a mechanism of the big data system for production and the virtualized system for experiments acting together is proposed. Among them, the production big data system is directly built on a cluster composed of multiple physical machines to provide services to the applications in the production environment; the experimental virtualization system is built and developed based on the virtualization system, which is built on a cluster composed of another set of physical machines. In the future, for the design of the cache interface, the basic interface and some special logical interfaces that need to be implemented should be considered.
Acknowledgement
The authors are thankful to the higher authorities for the facilities provided.
Funding
This research did not receive any specific grant from funding agencies in the public, commercial, or not-for-profit sectors.
Declaration of Competing Interest
The authors declare that they have no known competing financial interests or personal relationships that could have appeared to influence the work reported in this paper.
References
- BIGSEA: A Big Data analytics platform for public transportation information. Future Gener. Comput. Syst.. 2019;96:243-269.
- [Google Scholar]
- LocalFocus: A Big Data Service Platform for Local Communities and Smarter Cities. IEEE Commun. Mag.. 2018;56(7):116-123.
- [Google Scholar]
- mrMoulder: A recommendation-based adaptive parameter tuning approach for big data processing platform. Future Gener. Comput. Syst.. 2019;93:570-582.
- [Google Scholar]
- Development and Application of Big Data Platform for Garlic Industry Chain. Comput. Mater. Contin.. 2019;58(1):229-248.
- [Google Scholar]
- Mobile Application Curation Service based on Big Data Platform. Int. J. Grid Distrib. Comput.. 2018;11(3):99-108.
- [Google Scholar]
- Design and evaluation of a scalable smart city software platform with large-scale simulations. Future Gener. Comput. Syst.. 2019;93:427-441.
- [Google Scholar]
- Learning analytics platform in higher education in Japan. Knowl. Manag. E-Learn.. 2018;10(4):469-484.
- [Google Scholar]
- Clustering of Smart Meter Big Data Based on KNIME Analytic Platform. J. Inst. Webcast. Internet Telecommun.. 2020;20(2):13-20.
- [Google Scholar]
- Trust management in a blockchain based fog computing platform with trustless smart oracles. Future Gener. Comput. Syst.. 2019;101:747-759.
- [Google Scholar]
- Statistical analysis of tourist flow in tourist spots based on big data platform and DA-HKRVM algorithms. Pers. Ubiquitous Comput.. 2020;24(1):87-101.
- [Google Scholar]
- A Distributed Computing Platform for fMRI Big Data Analytics. IEEE Trans. Big Data. 2019;5(2):109-119.
- [Google Scholar]
- Optimizing the induction chemotherapy regimen for patients with locoregionally advanced nasopharyngeal carcinoma: A big-data intelligence platform-based analysis. Oral Oncol.. 2018;79:40-46.
- [Google Scholar]
- Alignment-free Genomic Analysis via a Big Data Spark Platform. Bioinformatics. 2021;37(12):1658-1665.
- [Google Scholar]
- Privacy-Aware Cross-Platform Service Recommendation Based on Enhanced Locality-Sensitive Hashing. IEEE Trans. Netw. Sci. Eng.. 2021;8(2):1145-1153.
- [Google Scholar]
- Research on the application of block chain big data platform in the construction of new smart city for low carbon emission and green environment. Comput. Commun.. 2020;149:332-342.
- [Google Scholar]
- An integrated GIS platform architecture for spatiotemporal big data. Future Gener. Comput. Syst.. 2019;94:160-172.
- [Google Scholar]
- Developing a big data analytics platform for manufacturing systems: architecture, method, and implementation. Int. J. Adv. Manuf. Syst.. 2018;99(9):2193-2217.
- [Google Scholar]
- A dynamic information platform for underground coal mine safety based on internet of things. Saf. Sci.. 2019;113:9-18.
- [Google Scholar]
- Clinical features and survival outcomes between ascending and descending types of nasopharyngeal carcinoma in the intensity-modulated radiotherapy era: A big -data intelligence platform-based analysis. Radiother. Oncol.. 2019;137:137-144.
- [Google Scholar]


