

Translate this page into:
Bactericidal activities and biochemical analysis of skin mucus of Cyprinid fish
⁎Corresponding authors at: Department of Microbiology, Kohat University of Science and Technology Kohat, 26000 (F.U. Dawar). mnasir@sharjah.ac.ae (Muhammad Nasir Khan Khattak), farmandawar@kust.edu.pk (Farman Ullah Dawar)
-
Received: ,
Accepted: ,
This article was originally published by Elsevier and was migrated to Scientific Scholar after the change of Publisher.
Peer review under responsibility of King Saud University.
Abstract
This study reports the bactericidal activity of mucus extracts and biochemical characterization of skin mucus from five Cyprinids, including Labeo rohita, Ctenopharyngodon Idella, Gibelion catla, Hypophthalmichthys molitrix and Cirrhinus mrigala against ten different bacteria extracted from naturally infected fish. The bactericidal activity was measured based on the zone of inhibition (ZOI) and compared against Fosfomycin. Importantly, acidic mucus extracts from five fish species exhibited higher bactericidal activity than organic and aqueous extracts. The acidic skin mucus extracts of C. idella, L. rohita, and G. catla showed higher ZOI against Staphylococcus aureus, Aeromonas hydrophila, and Pseudomonas aeruginosa. The minimum inhibitory concentration (MIC) of acidic mucus extracts from C. Idella, L. rohita, and G. catla was 16 µg/mL against A. hydrophila, P. aeruginosa, and S. aureus.
Further, biochemical characterization of mucus extracts showed that protein concentration was high in the acidic mucus extracts from L. rohita, C. idella, and G. catla compared to H. molitrix and C. mirigala followed by carbohydrate and lipid content. These findings suggest that skin mucus from cyprinids could be a potent source of innovative bactericidal components for fish and human-related treatments.
Keywords
Antimicrobial components
Bactericidal activity
Bacterial pathogens
Biochemical characterization
Cyprinids
Skin mucus

1 Introduction
Fish are in direct contact with water and are highly vulnerable to bacterial infections (Sudheesh et al., 2012). Several pathogenic bacteria have been observed in various fish species, with subsequent loss in their major tissues (Hamed et al., 2018). The bacterial diseases in fish include dropsy, epizootic ulcerative syndrome (EUS), swim bladder disease, scale loss, and tail and fin rot disease (Sudheesh et al., 2012). Contrarily, fish are equipped with skin mucus that provides defense against exogenous bacteria (Balasubramanian et al., 2012) with the help of immune-relevant components produced by goblet cells (Brinchmann, 2016). The skin mucus of fish serves as a protective layer between fish and the surrounding aquatic environment. It possesses essential biological and ecological functions(Reverter et al., 2018), such as osmoregulation and protection against abrasion, environmental toxins, heavy metals, and pathogens (Salinas, 2015). The skin mucus of fish is a dense fluid that changes composition as it moves over the surface and varies among fish species (Al-Arifa et al., 2013). The antibacterial factors present in fish skin mucus (Hedmon, 2018), can change against various physiological conditions in response to bacterial exposure (Reverter et al., 2018; Sridhar et al., 2021). Skin mucus from C. mrigala (Nigam et al., 2017), C. catla, H. molitrix, C. idella, and L. rohita showed inhibitory activity against pathogenic bacteria of fish (Balasubramanian et al., 2012). Hence skin mucus of fish act as a bactericidal; therefore, it needs detailed studies to be proved.
In Pakistan, freshwater fish are widely cultured on an industrial level in inland water (Shah et al., 2012). Fish face an outbreak of pathogenic bacteria in different culture systems (Mansoor et al., 2019), which renders their population and causes high economic loss. The pathogenic bacteria from infected fish may cause an increased risk of developing infections in humans after utilizing diseased fish (Kanwal et al., 2021). The bacterial affluence, antibacterial activity, and biochemical characterization of few fish skin mucus have been established (Nigam et al., 2017). Fish is a novel source these days for identifying and isolating novel bioactive compounds from its mucus, ethnic concerns about fish eating or its products apart from antibacterial, such as a good source of nutraceuticals and novel probiotic cultures (Ashraf et al., 2020). However, there is no information on fish skin mucus living in various climatic conditions in Pakistan. Thus, there is a probability of getting a diverse immune response and associated bactericidal factors which benefit them to live in unfavorable conditions. In order to characterize the bacteria from diseased fish, the current study reported bactericidal activity and biochemical characterization of skin mucus from C. idella, L. rohita, H. molitrix, G. catla, and C. mrigala.
2 Materials and methods
Ethical approval
All methods used in this experiment were concented by the Research Ethical Committee of KUST1447, Kohat.
2.2 Isolation and characterization of bacteria
We collected fish from various fish farms in Khyber Pakhtunkhwa, Pakistan. We used the infected parts of the diseased fish for bacterial isolation, performed under aseptic conditions by serial dilution method. We determined the morphology and shape of bacterial colonies on the nutrient agar plates. Selective media such as MacConkey agar (MA) (Difco™, Becton, Dickinson and Company, NJ, USA), tryptic soy agar (TSA), eosin methylene blue (EMB), mannitol salt agar (MSA), and cetrimide agar were used for identification of bacterial species. Biochemical tests such as triple sugar iron (TSI), catalase, oxidase, motility indole urea (MIU), and sulfur indole motility (SIM) were also performed for the identification of bacteria as described earlier (Tonguthai et al., 1999). Luria Bertani (LB) broth was used to grown the pure culture of potential bacteria which were preserved in glycerol stock at −80 °C for further analysis.
Furthermore, DNA was extracted from purified bacterial samples, and universal primers (5′-ACGCGCGTGTGTAC-3′ Forward and 5′-CAGCCGCGGTMTA--3′ Reverse) were used for the amplification of bacterial DNA. PCR products were verified using 2% agarose gel electrophoresis in TBE buffer. Sequences acquired for gene 16sRNA were modified with Bio edit (created in MEGA X) and were submitted to GenBank. Sequences obtained were put in BLAST for searching the nearest neighbor species.
2.3 Skin mucus collection
Healthful alive fish (C. idella, L. rohita, G. catla, C. mrigala and H. molitrix) were kept in glass aquaria in the Laboratory of Fisheries and Aquaculture, Department of Zoology, Kohat University of Science and Technology (KUST), Kohat. Fish were kept starved for 24 h after seven days of acclimatization to maximize mucus secretion and avoid defecation during the mucus collection process. Fish was put on a sterile tray, washed with phosphate buffer saline, and gently scraped with a sterile slide from lateral sides. Skin mucus was collected from each 20 representative species and mixed. The collected mucus was put into falcon tubes (15 mL) and lyophilized using Labconco’s Freeze dryer and stored at −20 °C for Analysis of bactericidal activity (Nigam et al., 2017; Subramanian et al., 2008).
2.4 Preparations of skin mucus extracts
The extracted mucus from five fish was then partitioned into 3-portions, and isolated individually with acidic, aqueous, and organic (ethanol and methanol) solvents. The acidic mucus extracts were made with little modifications in Subramanian et al. (2008) protocols. Extracted mucus (15 mL) was homogenized with 80 mL of 5% (v/v) acetic acid and put in the water bath for 5 min. The acidic mucus was centrifuged at 18,000 rpm for 35 min at 4 °C after being properly vortexed and cooled to 4 °C. A reverse-phase Sep-Pak Vac 5 g C18 cartridge (125, 55–105 m; Waters Corporation, Milford, MA, USA) was used to collect and partially purify the supernatant. Before adding the supernatant, the cartridge was first activated with 15 mL of methanol and then equilibrated with 5 mL of 10% (v/v) acetic acid. Supernatant was placed into the cartridge, which was then washed once with 20 mL of an acetonitrile, water, and TFA mixture, persuaded by 5 mL of 0.1% (v/v) trifluoroacetic acid (TFA), before being eluted. The mucus samples were kept at −20 °C, then submerged in distilled water and used for bactericidal activity.
Organic extracts (ethanol and methanol) were used to activate skin mucus. The extracted mucus (15 mL) from all fish was immediately lyophilized and kept at −20 °C. Absolute ethanol was added to the dried mucus, then centrifuged at 11,000 rpm for thirty minutes at 4 °C. Ethanolic extract was vortex thoroughly and was kept under liquid nitrogen for 24 h. Then, the ethanolic extract was re-suspended in 15 mL distilled water, followed by adding 5% (v/v) DMSO (dimethyl sulphoxide), thus finally used to evaluate the bactericidal activity. Methanol was added to dried mucus and centrifuged at 11,000 rpm for thirty minutes at 4 °C. The methanolic extracts were mixed well and evaporated under liquid nitrogen for 24 h. To resuspend the dry pellet, 15 mL of distal water was added and extracted two more times with 50 mL of DCM (dichloromethane) then the mucus was analyzed for bactericidal activity. For aqueous extracts, 15 mL of the extracted mucus was re-suspended in 50 mM (w/v) ammonium bicarbonate under cold conditions and centrifuged at 10,000 rpm for ten minutes at 4 °C. The upper layer was amassed, immediately freeze-dried, and stored for further Analysis (Hellio et al., 2002).
2.5 Determination of the bactericidal activity of mucus
Bacterial species of 108 CFU/mL were cultured on petri plates containing 25 mL muller hinton agar (MHA). Different extracts of skin mucus were prepared with four concentrations (1–4 mg/mL). Each MHA petri plate was bored with three distinct wells and named AQ) aqueous, A) acidic, and O) organic with the positive control (Fosfomycin). Then, wells were punched aseptically with a sterile blue tip with a diameter of 6–8 mm, and 100 µL of each mucus extract per well was added. Alongside each mucus concentration, positive controls (Fosfomycin) and ethanol, methanol, acetic acid, and ammonium bicarbonate were used as negative control during bactericidal activity. Bactericidal activity was evaluated by quantifying the diameter of the ZOI produced across the well in a millimeter (mm) after 24 h.
2.6 Determination of minimum inhibitory concentration (MIC) for mucus extracts
The MIC is the least concentration of an analyzed bactericidal component that prevents the apparent growth of bacteria examined after 24 h incubation. Microdilution procedures was used to determine the MIC of acidic mucus extract using Muller Hinton Broth (MHB) in accordance with the Clinical and Laboratory Standards Institute (CLSI) (Wang et al., 2014) with minor changes. The acidic mucus extracts were 2-fold diluted, ranged in concentration from 256 to 2 µg/mL (100 µL mucus/per well). Evaluation of bacterial growth control (MHB + bacteria + mucus extract) was carried out immediately with one column each for negative control (MHB) and for the positive control (MHB + bacteria) used (Silveira et al., 2009). Microtiter plates were then incubated at 37 °C for 24 h. Each well absorbance was calculated by using a biometra microplate spectrophotometer reader at 630 nm.
2.7 Minimum bactericidal concentration (MBC)
MBC was performed according to (Pillai Jr, 2005)) with slight modification. MBC was performed after the MIC test by dispersing 5 µL of mucus sample from the microtiter plates on MHA plates that showed no apparent growth. MBC was recorded after 18–24 h incubation at the least concentration that produced 3–4 colonies, i.e., 99.9% of bacteria was inhibited.
2.8 Biochemical characterization of fish skin mucus
Skin mucus extracts were prepared from the preserved mucus, thawed, and centrifuged at 5000 rpm for 5 min. For identification of biochemical constituents, 3 g of copper sulfate (CuSO4·5H2O), dissolve in 500 mL of 0.2 mol/liter sodium hydroxide, then 9 g of sodium potassium tartrate and 5 g of potassium iodide were added. Further, 1 mL of mucus of each species was procured in a distinct test tube, and added 1 mL of distilled water to a separate test tube that served as the blank. Furthermore, 3 mL of the biuret reagent was added to all the test tubes, involving the blank tube. The biuret reagent was mixed with mucus and warmed at 37 °C for 10 min, and the absorbance was recorded through spectrophotometry at 595 nm against blank tubes. The standard curve was drawn, with the concentration of proteins along the X-axis and the absorbance along the Y-axis, to determine the protein concentration in each sample. The same process was adopted for protein analysis in the mucus of each species in triplicate.
The anthrone test estimated carbohydrate content. Briefly, 0.2 g of anthrone was dispelled in 100 mL of diluted chilled sulfuric acid. 3 mL of anthrone reagent and 1 mL of mucus extract were incorporated in a test tube, and the mixture was then cooled in iced water. The reaction mixture was measured at 630 nm.
Lipid analysis was executed by a free fatty acid test. 5 g of mucus sample in a conical flask was mixed with 50 mL of ethanol. The burette was filled with a standardized solution of 0.1% NaOH, and a 2 mL phenolphthalein indicator was added. The solution was heated up to 40 °C, and the alkali solution (NaOH) was added to the mixture and gently shacked till a pale pink colour appeared that was shown the end point of titration, and absorbance was recorded.
2.9 Statistical analysis
The bactericidal activities of each fish skin mucus were analyzed in triplicate. Data were shown as mean ± SE from 3 replicate experiments. Significance was established using a one-way analysis of variance (ANOVA) where P < 0.05 were considered significant.
3 Results
3.1 Identification and characterization of isolated bacteria
This study observed the morphological and biochemical characteristics of different bacteria (Table S1) isolated from diseased fish (G. catla, C. mrigala, and C. Idella) (Fig. S1A). Standard reference organisms were used to identified bacteria based on their cultural, morphological, and biochemical characteristics. Each bacterium produced round, rod-shaped, smooth, colorless, dew drop-like colonies on the petri dishes of nutrient agar and showed specific colour on respective media after incubation of 24 h (Table S2) (Fig. S1B). The isolated bacteria were identified as Edwardsiella spp, Aeromonas spp, Serratia spp, Enterobacter spp, Pseudomonas spp, Salmonella spp, Staphylococcus aureus, Escherichia coli, Klebsiella spp, and Bacillus spp.
The ten identified bacterial species belonged to three families Enterobacteriaceae (Staphylococcus aureus (ON915526), Salmonella enterica (ON920836), Enterobacter cloacae (ON920869), Escherichia coli (ON935728), Klebsiella pneumonia (ON935750), Bacillus wiedmannii (ON920835), Edwardsiella tarda (ON935051), and Serratia marcescens (ON920834), Pseudomonadaceae (Pseudomonas aeruginosa, ON935772) and Aeromonadaceae (Aeromonas hydrophila, ON920871). Amplified PCR product of genomic DNA of ten species using 16S rRNA bacterial universal primers generated 714–1251 bp amplicons (Fig. 1). The 16S rRNA gene sequencing results of all isolated bacterial DNA revealed 96–99% similarity with reference reported sequences. The relationship among sequences of 16S rRNA gene was clustered to each other in the phylogenetic tree (Fig. 2). These clusters were also intensely upheld by their high bootstrap values.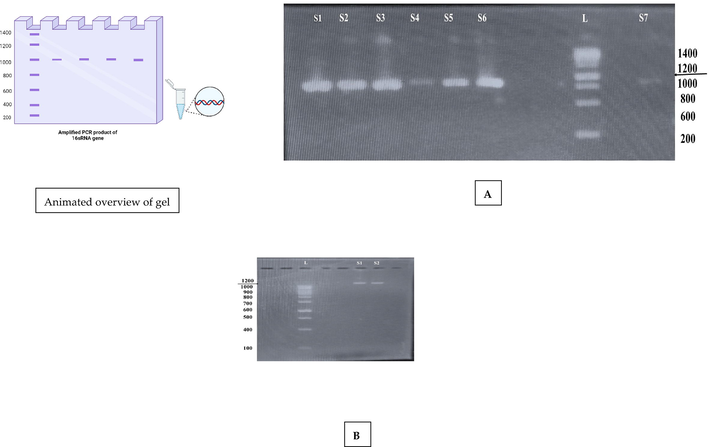
Amplified PCR product of 16 s RNA gene. A) S1, S2, S3, S4, S5, S6, and S7 are the bacterial DNA positive samples (∼850 bp) relative to L (1500 bp) ladder. B) S1 and S2 are the bacterial DNA positive samples (∼1251 bp) relative to L (1000 bp) ladder.
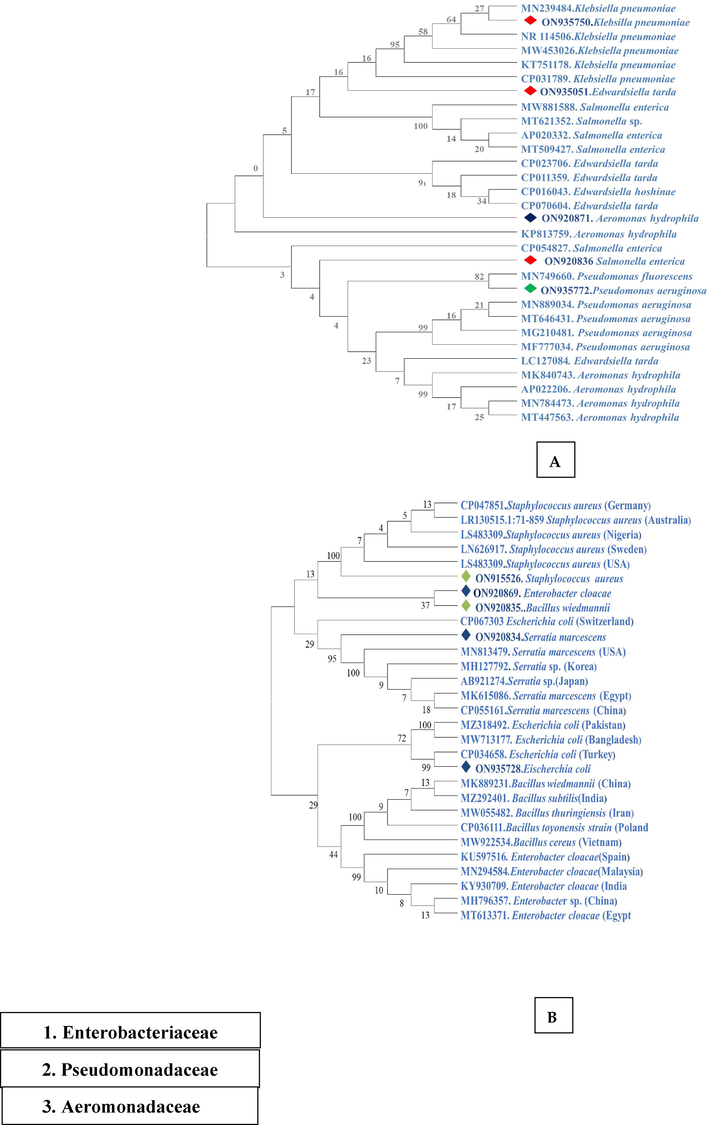
Phylogenetic tree based on 16S rRNA gene. The study identified 10 different bacteria belonging to three families. (A) Family Enterobacteriaceae (red colour shows gram (-ve) bacteria, the green colour shows the family Pseudomonadaceae while the dark blue colour is for the family Aeromonadaceae. (B) The light green colour shows the gram (+ve) and the dark blue colour shows the gram (-ve) bacteria. All the stains were compared with closely related species reported from other countries. Percentage bootstrap values (1000 replicates) are shown at each branch point.
3.2 Mucus secretion
Secretion of skin mucus was different in quantity and appearance among each species. Secreted mucus of H. molitrix showed less viscosity and soon became watery. While the mucus of C. idella and L. rohita was more viscous and secrete mucus in equal quantity in both winter and summer whereas G. catla secreted pale-yellow mucus with suffocating odor, and C. mrigala secreted less mucus as compared to the other species. Moreover, the secretion of skin mucus in all the species was more in winter than in the summer. Furthermore, the average length (cm) and weight (g) of all five selected fish were recorded as (C. idella 38 ± 1.15 cm; 949 ± 1 g, L. rohita 37 ± 0.577 cm; 799.6 ± 0.577 g, G. catla 34 ± 0.57 cm; 701 ± 0.577 g, C. mirigala 28.66 ± 0.577 cm; 499 ± 1 g, H. molitrix 30 ± 1 cm; 501 ± 0.577 g.
3.3 Bactericidal activity of mucus extracts
Among the four different extracts (aqueous, acidic, ethanol, and methanol), the acidic extracts have shown strong bactericidal activity than aqueous and organic mucus extracts (Table 1–5). All four concentrations (1–4 mg/mL) of fish species showed significant activity against identified bacterial species, which was comparable to the standard antibiotics. The activity of skin mucus extracts was increased with the increase in concentration, and high activity was recorded against A. hydrophila, S. aureus and P. aeruginosa at all concentrations. Variations in mean ± SE values of the ZOI of various mucus extracts used against identified bacteria were observed to be significantly (P > 0.05) higher against Fosfomycin. The acidic skin mucus extract from L. rohita, C. idella, and G. catla showed higher ZOI against A. hydrophila (44 ± 1; 44 ± 1; 42.3 ± 2.51 mm respectively), S. aureus (45.33 ± 1.15; 40.33 ± 1; 40.6 ± 1.52 mm respectively) and P. aeruginosa (44 ± 1; 40.6 ± 0.57; 44 ± 1 mm respectively) (Table 1–3). While C. mrigala and H. molitrix acidic extracts exhibited the least ZOI against A. hydrophila (29 ± 2;35 ± 1 mm respectively), S. aureus (31.6 ± 1.52;32.66 ± 0.577 mm respectively) and P. aeruginosa (39.6 ± 1.52; 33.66 ± 0.577 mm respectively) at 4 mg/mL concentration for each shown in (Table 4–5). Although aqueous and organic mucus extracts also showed potent bactericidal activity against identified bacteria, but the ZOI was not remarkably as high as in acidic mucus extract (Table 1–5). In the case of organic (ethanol) extracts of L. rohita, C. idella and G. catla skin mucus exhibited higher bactericidal activity against A. hydrophila (32 ± 1; 34 ± 1; 32 ± 1 mm respectively), S. aureus (38 ± 1; 38.66 ± 1.52; 37 ± 1 mm respectively) and P. aeruginosa (37 ± 1; 25 ± 1; 38 ± 1 mm respectively) which were significantly (P > 0.05) higher among all the identified bacterial strains compared with Fosfomycin (15.33 ± 3.21; 14.66 ± 1.15 mm) as well (Table 1–3). The aqueous extract of L. rohita, C. idella and G. catla also showed maximum inhibitory effect at 4 mg/mL against A. hydrophila (31 ± 1; 32 ± 1; 31 ± 1 mm respectively) S. aureus (26 ± 1; 32.33 ± 2.08; 25 ± 1 mm respectively) and P. aeruginosa (26 ± 1; 32.6 ± 1.52; 26 ± 1 mm respectively) among all identified pathogenic bacteria (Table 1–3). Further, the aqueous extract of C. mrigala showed no remarkably bactericidal activity on initial concentration while with the increase of concentration it showed more activity (Table 5). However, skin mucus of L. rohita and C. idella was observed to be less active against S. marcescens and K. pneumoniae. and same is shown in Table 1–2 and Fig. 3, for G. catla, the acidic and ethanolic mucus extracts for both K. pneumonia (29 ± 1 mm; 21.33 ± 3.21 mm) and S. marcescens (39 ± 1 mm: 26.33 ± 0.57 mm) showed a maximum bactericidal effect. Photographic images of ZOIs of acidic, aqueous, and organic skin mucus extracts and one antibiotic against identified bacterial strains have been shown in Figs. 3–4, respectively. Values are mean ± SE of mean. Statistical significance between different skin mucus extracts was determined using one way ANOVA (* P < 0.05). Values are mean ± SE of mean. Statistical significance between different skin mucus extracts was determined using one ANOVA (* P < 0.05). Values are mean ± SE of mean. Statistical significance between different skin mucus extracts was determined using one ANOVA (* p < 0.05). Values are mean ± SE of mean. Statistical significance between different skin mucus extracts was determined using one ANOVA (* P < 0.05). Values are mean ± SE of mean. Statistical significance between different skin mucus extracts was determined using one ANOVA (* P < 0.05.
Concentration
(mg/mL)
Mucus extract
Bacterial Strains
A. hydrophila
E. tarda
S. aureus
E. coli
K. pneumonia
P. aeruginosa
B. wiedmannii
S. enterica
E. cloacae
S. marcescens
P-Value
1 mg/mL
Aqueous
13.33 ± 1.52
9.66 ± 0.577
14 ± 1
10.3 ± 1.52
8.66 ± 0.577
15.66 ± 0.577
11 ± 1
10.33 ± 0.577
9 ± 1
9.33 ± 0.577
0.01
Acidic
24.33 ± 1.52
18 ± 0.577
19 ± 1
9 ± 1
9.66 ± 0.577
23.66 ± 0.577
18.66 ± 1.52
13.33 ± 1.52
20 ± 1
18.33 ± 1.52
0.01
Ethanol
15 ± 1
10.3 ± 1.52
17.66 ± 1.5
10.66 ± 1.52
10.33 ± 1.15
16.66 ± 1.52
9 ± 1
14 ± 2
14.33 ± 2.08
14.33 ± 2.08
0.05
Methanol
14 ± 1
11.3 ± 1.15
14 ± 1
13 ± 2.64
12.66 ± 2.51
8.6 ± 2.64
9 ± 1
8.66 ± 1.52
9 ± 1
8.66 ± 1.52
0.05
2 mg/mL
Aqueous
18.33 ± 1.52
14 ± 1
18.33 ± 1.52
15 ± 1
13 ± 1
17 ± 1
10 ± 5
14 ± 1
15.33 ± 1.52
9 ± 1
0.01
Acidic
32.33 ± 1.52
30.3 ± 2.51
42.3 ± 2.51
16.66 ± 2.88
22.33 ± 2.51
28.33 ± 1.52
12.33 ± 2.51
16.66 ± 2.88
16 ± 1
12.33 ± 2.51
0.001
Ethanol
30 ± 1
21 ± 1
25 ± 1
14 ± 1
21 ± 1
26 ± 1
20.33 ± 1.52
23.66 ± 1.52
22 ± 1
23 ± 1
0.01
Methanol
11.66 ± 1.52
29 ± 1
23 ± 1
7.66 ± 1.52
15 ± 1
16 ± 1.73
19 ± 1
24 ± 1
18.66 ± 1.52
14 ± 1
0.01
3 mg/mL
Aqueous
24 ± 1
19 ± 1
23.6 ± 0.57
20 ± 2
22.33 ± 1.52
23 ± 1
22.66 ± 1.52
19 ± 1
21.33 ± 1
20 ± 1
0.01
Acidic
34 ± 1
29 ± 1
43.33 ± 1.52
26.66 ± 1.52
30.33 ± 1.52
35 ± 0.5
19.66 ± 1.52
27 ± 1
33.66 ± 0.57
33 ± 1
0.001
Ethanol
34 ± 1
26 ± 1
27.33 ± 1.52
19 ± 1
25.66 ± 0.57
34.66 ± 0.577
23.66 ± 1.52
23.33 ± 1.52
21.33 ± 0.57
20.33 ± 1.52
0.01
Methanol
28 ± 1
20.66 ± 1.15
27 ± 1
11.66 ± 1.52
11.66 ± 1.52
29 ± 1
19 ± 1
27 ± 1
26 ± 1
18 ± 1
0.01
4 mg/mL
Aqueous
31 ± 1
19 ± 1
26 ± 1
21 ± 1
18.66 ± 1.15
26 ± 1
17.33 ± 1.52
25 ± 1
25 ± 1
19 ± 1
0.01
Acidic
44 ± 1
33 ± 1
45.33 ± 1.15
34.33 ± 1.52
33 ± 1
44 ± 1
33 ± 1
28 ± 1
31 ± 1
39 ± 1
0.0001
Ethanol
32 ± 1
21.33 ± 1.52
38 ± 1
24.66 ± 0.577
24 ± 1
37 ± 1
31.66 ± 0.57
31 ± 1
19 ± 1
26.33 ± 0.57
0.0001
Methanol
31 ± 1
31 ± 1
35 ± 1
19 ± 1
14.66 ± 1.52
28.66 ± 1.52
22 ± 1
19 ± 1
18 ± 1
19 ± 1
0.0001
200 µg
Fosfomycin
14.66 ± 1.52
13 ± 1
13 ± 1
12 ± 1
12.33 ± 0.577
14.66 ± 1.15
13.66 ± 1.52
12.66 ± 2.51
14.66 ± 0.57
14.6 ± 0.577
0.0002
Concentration
(mg/mL)
Mucus extract
Bacterial Strains
A. hydrophila
E. tarda
S. aureus
E. coli
K. pneumonia
P. aeruginosa
B. wiedmannii
S. enterica
E. cloacae
S. marcescens
P-Value
1 mg/mL
Aqueous
14.66 ± 0.577
9 ± 1
17.33 ± 1.52
12.33 ± 1.52
4 ± 1
15 ± 1
4.66 ± 0.577
11.66 ± 1.52
8 ± 1
5 ± 1
0.01
Acidic
19 ± 1
9.66 ± 0.577
16.88 ± 2.88
8.66 ± 1.52
9.33 ± 1.52
15 ± 1
8 ± 1
13.66 ± 1.24
11 ± 1
9 ± 1
0.01
Ethanol
10 ± 1
6 ± 1
14 ± 2
7.33 ± 2.08
9 ± 1
13 ± 1
3.33 ± 0.577
9 ± 1
12 ± 1
11.33 ± 1.52
0.05
Methanol
9 ± 1
4 ± 1
8.66 ± 1.52
5 ± 1
5 ± 1
15 ± 1
6.66 ± 1.52
4.33 ± 0.577
12 ± 1
15.66 ± 1
0.01
2 mg/mL
Aqueous
15 ± 1
12.66 ± 2
14 ± 1
12 ± 2.08
13 ± 1
16 ± 1
12 ± 1
14 ± 1
11 ± 1
14 ± 1
0.01
Acidic
16 ± 1
18.33 ± 1.52
18 ± 1
16 ± 1.52
19 ± 1
21.66 ± 2.08
16 ± 1
18.66 ± 1.52
22 ± 1
21 ± 1
0.005
Ethanol
12.33 ± 1.52
11 ± 1
18.66 ± 1.52
11.66 ± 0.577
10 ± 1
14 ± 1.73
11 ± 1
11 ± 1
10 ± 1
12 ± 1
0.05
Methanol
15.66 ± 2.51
14 ± 1
21.33 ± 0.577
13.33 ± 1.5
13.33 ± 0.577
17.33 ± 1.52
10.33 ± 4.6
12 ± 2
16 ± 1
15 ± 1
0.05
3 mg/mL
Aqueous
17 ± 1
21 ± 1
22.66 ± 1.52
19 ± 1
22.6 ± 1.52
18.3 ± 1.52
16 ± 1
24 ± 1
19 ± 1
15 ± 1
0.01
Acidic
24 ± 1
25 ± 1
28 ± 2
23 ± 1
17.33 ± 2.08
24 ± 1
27.66 ± 1.15
24.3 ± 1.52
20 ± 1
16.33 ± 0.577
0.01
Ethanol
25.66 ± 1.52
18.6 ± 1.52
24.6 ± 0.57
20 ± 1
19.33 ± 0.577
14 ± 1
21 ± 1
21 ± 1
25.6 ± 1.52
29 ± 1
0.05
Methanol
28 ± 1
15.3 ± 1.52
22.6 ± 3.78
18 ± 1
15 ± 1
17 ± 1
15.6 ± 1.52
11.6 ± 1.52
8 ± 1
8 ± 2.64
0.01
4 mg/mL
Aqueous
32 ± 1
31 ± 1
32.33 ± 2.08
30 ± 2.64
8.33 ± 0.577
32.6 ± 1.52
13 ± 2
9.33 ± 0.577
9 ± 1
16 ± 1
0.0001
Acidic
42.3 ± 2.51
38 ± 1
40.6 ± 1.52
37.3 ± 1.52
13.33 ± 1.52
40.6 ± 0.57
17 ± 1.73
29.33 ± 2.08
28.33 ± 1.52
13 ± 1
0.0001
Ethanol
34 ± 1
29 ± 1
38.66 ± 1.52
24.6 ± 1.52
18 ± 1
25 ± 1
12.66 ± 1.5
18 ± 2.64
19 ± 1
13 ± 1
0.0001
Methanol
30.3 ± 1.52
23.3 ± 2.08
30 ± 1
28.3 ± 2.08
12 ± 1
28 ± 1.52
13.3 ± 2.08
18 ± 1
15 ± 1
17.6 ± 1.52
0.0001
200 µg
Fosfomycin
14.66 ± 2.88
14 ± 1
12.6 ± 0.577
14 ± 1
13.6 ± 2.08
12.66 ± 1.15
12.33 ± 0.57
13.3 ± 0.577
14.6 ± 0.577
13 ± 2.64
0.02
Concentration
(mg/mL)
Mucus extract
Bacterial Strains
A. hydrophila
E. tarda
S. aureus
E. coli
K. pneumonia
P. aeruginosa
B. wiedmannii
S. enterica
E. cloacae
S. marcescens
P-Value
1 mg/mL
Aqueous
13 ± 1
7.66 ± 1.52
15 ± 1
10.3 ± 1.52
8.66 ± 0.577
18 ± 1
11 ± 1
9 ± 1
7.66 ± 1.52
8 ± 1
0.01
Acidic
19 ± 1
15.3 ± 1.52
19.3 ± 2.08
12 ± 2
9.66 ± 0.577
16 ± 1
15.66 ± 0.577
12.33 ± 1.52
14.33 ± 1.52
14 ± 1
0.01
Ethanol
15.33 ± 1.52
10.33 ± 1.52
16.66 ± 1.52
10.6 ± 2.08
12.33 ± 2.51
17 ± 2
8.66 ± 1.52
13 ± 1
13 ± 1
13 ± 1
0.05
Methanol
15 ± 1
9 ± 1
14 ± 1
13.6 ± 2.08
12.33 ± 2.08
16.33 ± 2.08
9 ± 1
7.66 ± 1.52
8 ± 1
8 ± 1
0.05
2 mg/mL
Aqueous
16.66 ± 1.52
11 ± 1
14.33 ± 1.52
13.33 ± 1.52
11.66 ± 0.577
14.66 ± 0.577
13 ± 1
12 ± 1
13 ± 1
11 ± 1
0.01
Acidic
17 ± 1
13 ± 1
23.66 ± 1.52
15.3 ± 0.577
14.66 ± 0.577
19.66 ± 1.52
18 ± 1
14.66 ± 0.57
18.66 ± 0.577
18 ± 1
0.01
Ethanol
14 ± 1
13.66 ± 1.52
15 ± 1
12 ± 1
13.66 ± 0.577
16.33 ± 1.15
12.33 ± 1.52
13.66 ± 1.52
12 ± 1
11.66 ± 0.577
0.05
Methanol
17 ± 1
14 ± 1
18 ± 1
15 ± 1
15 ± 1
16 ± 1
9 ± 1
10.66 ± 1.52
10 ± 1
10.66 ± 1.52
0.01
3 mg/mL
Aqueous
15.33 ± 0.577
15 ± 1
17.66 ± 0.57
20 ± 1
15.33 ± 1.52
13 ± 1
16 ± 1
19 ± 1
16.66 ± 0.577
14 ± 1
0.01
Acidic
18 ± 1
24 ± 1
26.33 ± 1.52
17.33 ± 1.52
16.66 ± 0.57
19.66 ± 0.577
21.6 ± 0.577
18 ± 1
21.33 ± 1.52
22.66 ± 0.577
0.01
Ethanol
14.33 ± 1.52
18.33 ± 1.52
17.66 ± 0.577
20.66 ± 0.577
18.33 ± 0.577
14.66 ± 0.577
23.66 ± 1.52
23.33 ± 1.52
21 ± 2
21 ± 1
0.05
Methanol
15 ± 1
20.66 ± 1.15
27 ± 1
11.66 ± 1.52
11.66 ± 1.52
19 ± 1
19 ± 1
27 ± 1
26 ± 1
18 ± 1
0.01
4 mg/mL
Aqueous
31 ± 1
19 ± 1
25 ± 1
23 ± 1
18.66 ± 1.15
26 ± 1
17.33 ± 1.52
17 ± 1
24 ± 1
16.33 ± 3.21
0.0001
Acidic
44 ± 1
33 ± 1
40.33 ± 1.15
34.33 ± 1.52
29 ± 1
44 ± 1
29 ± 1
28 ± 1
31 ± 1
39 ± 1
0.0001
Ethanol
32 ± 1
19.66 ± 4.16
37 ± 1
24.66 ± 0.577
21.33 ± 3.21
38 ± 1
31.66 ± 0.57
31 ± 1
19 ± 1
26.33 ± 0.57
0.01
Methanol
31 ± 1
25 ± 1
35 ± 1
16.33 ± 3.21
14.66 ± 1.52
28.66 ± 1.52
22 ± 1
17 ± 2.64
18 ± 1
19 ± 1
0.01
200 µg
Fosfomycin
15.33 ± 3.21
12 ± 1
14 ± 1
13 ± 2
14.33 ± 0.577
14.66 ± 1.15
12.66 ± 1.52
14 ± 1
14.66 ± 0.577
12.66 ± 0.577
0.02
Concentration
(mg/mL)
Mucus extract
Bacterial Strains
A. hydrophila
E. tarda
S. aureus
E. coli
K. pneumonia
P. aeruginosa
B. wiedmannii
S. enterica
E. cloacae
S. marcescens
P-Value
1 mg/mL
Aqueous
13.6 ± 1.52
11 ± 1
15.6 ± 1.52
14.6 ± 1.52
8 ± 1
18 ± 1
7 ± 2
5 ± 1
13 ± 1
10 ± 1
0.05
Acidic
22.6 ± 2.51
19 ± 2
23.3 ± 2.08
21 ± 1
15 ± 2
25.33 ± 2.08
13.3 ± 2.08
20 ± 1
17 ± 2
14 ± 1
0.01
Ethanol
18.6 ± 1.52
13 ± 1
18.6 ± 1.52
13.6 ± 1.54
11 ± 1
18 ± 1
9 ± 1
16.6 ± 1.52
14 ± 1
10.3 ± 1.52
0.05
Methanol
17.33 ± 2.51
11 ± 1
14 ± 1
11 ± 1
7 ± 2
17 ± 1
7.3 ± 2.51
15 ± 1
12 ± 1
9 ± 1
0.01
2 mg/mL
Aqueous
18 ± 1
14 ± 1
19 ± 1
18.6 ± 1.52
11 ± 1
18.3 ± 1.52
11.6 ± 1.52
11 ± 1
16 ± 1
13 ± 1
0.02
Acidic
28 ± 1
27 ± 1
28.6 ± 1.52
16.5 ± 1
19.3 ± 1.52
30.3 ± 1.52
15.3 ± 1.52
27 ± 1
21 ± 1
16 ± 1
0.01
Ethanol
19.3 ± 1.52
16 ± 1
22 ± 1
17.6 ± 1.52
14 ± 1
22 ± 1
12 ± 1
18.3 ± 1.52
17.6 ± 1.52
14 ± 1
0.005
Methanol
19 ± 1
14 ± 1
22.3 ± 1.52
18.6 ± 1.52
11 ± 1
20 ± 1
12.6 ± 1.52
18.6 ± 1.52
14.3 ± 1.52
12.6 ± 1.52
0.05
3 mg/mL
Aqueous
20.33 ± 1.15
15.33 ± 0.577
20.66 ± 0.577
19.66 ± 0.577
14.33 ± 1.15
22.66 ± 0.577
14.66 ± 0.577
19 ± 1
18.66 ± 0.577
14.66 ± 0.577
0.05
Acidic
31.33 ± 1.52
28.66 ± 0.577
31 ± 1
30.66 ± 0.577
23 ± 1
32.66 ± 0.577
18.66 ± 0.577
29.66 ± 0.577
24.33 ± 1.15
19 ± 1
0.01
Ethanol
22.66 ± 1.52
18.66 ± 0.577
24.66 ± 0.577
20.66 ± 0.577
15.66 ± 0.577
25 ± 1
14 ± 1
24.66 ± 0.577
21 ± 1
16.66 ± 0.577
0.01
Methanol
11.66 ± 1.52
14 ± 1
24.33 ± 0.577
19.66 ± 0.577
13.66 ± 0.577
10.66 ± 0.577
15.66 ± 0.577
21 ± 1
17.66 ± 0.577
15.66 ± 0.577
0.05
4 mg/mL
Aqueous
24 ± 1
17.66 ± 0.577
22.66 ± 0.577
24.66 ± 0.577
16.66 ± 0.577
25 ± 1
17.33 ± 1.52
21.66 ± 0.577
20.66 ± 0.577
16.66 ± 0.577
0.005
Acidic
35 ± 1
30.66 ± 0.577
32.66 ± 0.577
31.33 ± 0.577
25.33 ± 0.577
33.66 ± 0.577
20.66 ± 0.577
31.66 ± 0.577
26.66 ± 0.577
22.33 ± 1.15
0.001
Ethanol
25.66 ± 0.577
20.66 ± 0.577
25.66 ± 0.577
22.66 ± 0.577
17.66 ± 0.577
25.66 ± 0.577
16.66 ± 0.577
24.66 ± 0.577
23.66 ± 0.577
17.66 ± 0.577
0.001
Methanol
22.66 ± 1.15
16 ± 1
25.66 ± 0.577
21.66 ± 0.577
15.66 ± 0.577
22.66 ± 0.577
18 ± 1
22.66 ± 0.577
19.66 ± 0.577
16.66 ± 0.577
0.005
200 µg
Fosfomycin
14.33 ± 0.577
13.66 ± 0.577
13.66 ± 0.577
14 ± 1
13.66 ± 0.577
12 ± 1
13.33 ± 1.15
12.33 ± 0.577
14.33 ± 0.577
12.33 ± 0.577
0.05
Concentration
(mg/mL)
Mucus extract
Bacterial Strains
A. hydrophila
E. tarda
S. aureus
E. coli
K. pneumonia
P. aeruginosa
B. wiedmannii
S. enterica
E. cloacae
S. marcescens
P-Value
1 mg/mL
Acidic
13.66 ± 1.52
11.6 ± 2.08
18.6 ± 1.52
11 ± 2.64
12.33 ± 1.52
14.66 ± 0.577
17 ± 2
11 ± 1
12.3 ± 2.08
12.6 ± 1.52
0.01
Ethanol
21.33 ± 1.52
5.33 ± 1.52
20 ± 1
19 ± 1
11.6 ± 1.52
20 ± 2
11.6 ± 1.52
18 ± 2.64
15.3 ± 2.51
9 ± 1
0.05
Methanol
15.33 ± 1.52
5.33 ± 1.52
15.66 ± 1.52
13.3 ± 1.52
9.33 ± 2.08
17 ± 2
8 ± 1
14.3 ± 2.08
5 ± 1
7.3 ± 1.52
0.05
2 mg/mL
Acidic
18.33 ± 1.52
17.6 ± 1.52
26.3 ± 1.52
16 ± 1
17.3 ± 1.52
24 ± 2
17 ± 2
16 ± 1
16.3 ± 1.52
17.6 ± 1.52
0.005
Ethanol
19 ± 2
16 ± 1
18.3 ± 1.52
12.6 ± 1.52
17 ± 2
21 ± 1
16.6 ± 1.52
17.6 ± 1.52
16 ± 1
14 ± 1
0.01
Methanol
20.66 ± 1.52
14.3 ± 1.52
21.33 ± 1.52
13.6 ± 3.21
9 ± 1
19.3 ± 2.51
12 ± 2
16 ± 1
9 ± 1
11 ± 1
0.05
3 mg/mL
Aqueous
19 ± 1
13.66 ± 1.52
17 ± 1
16.66 ± 1.52
16.3 ± 1.52
20.6 ± 1.52
15.6 ± 1.52
16.6 ± 1.52
12.6 ± 2.51
16.6 ± 1.52
0.02
Acidic
29 ± 1
24.3 ± 1.52
28 ± 1
25 ± 1
27 ± 1
30.6 ± 1.52
26.3 ± 2.51
27.6 ± 1.52
24.6 ± 2.51
24.3 ± 2.51
0.01
Ethanol
22.66 ± 1.52
18.6 ± 1.52
24 ± 2
21 ± 1
20 ± 1
27.3 ± 1.52
20 ± 1
20 ± 1
21.6 ± 1.52
18.3 ± 2.08
0.01
Methanol
23.66 ± 1.15
13 ± 1
21 ± 1
11.33 ± 1.52
13.3 ± 1.52
22 ± 1
10.3 ± 2.08
21.3 ± 1.52
18.6 ± 1.52
15 ± 1
0.01
4 mg/mL
Aqueous
26 ± 1
16.3 ± 1.52
24.6 ± 1.52
20.3 ± 1.52
18.3 ± 2.08
28.3 ± 1.52
18.3 ± 2.51
20 ± 2
18.3 ± 2.08
23.3 ± 1.52
0.001
Acidic
29 ± 2
26.6 ± 1.52
31.6 ± 1.52
25 ± 1
26 ± 1
39.6 ± 1.52
27.3 ± 2.51
25.6 ± 1.52
24 ± 2
28.6 ± 2.08
0.0001
Ethanol
23.66 ± 1.52
22.6 ± 1.52
27.3 ± 1.52
21 ± 2
17.3 ± 1.52
28 ± 1
13.6 ± 1.52
25.3 ± 1.52
23.6 ± 1.52
18.6 ± 1.52
0.005
Methanol
23.33 ± 2.52
17 ± 1
20 ± 1
24.6 ± 1.52
17.3 ± 1.52
24 ± 2
21.3 ± 1.52
22.3 ± 1.52
21.3 ± 1.52
17.6 ± 1.52
0.001
200 µg
Fosfomycin
14.66 ± 1.52
13.6 ± 0.57
15 ± 2
14 ± 1
14.6 ± 2.08
13 ± 1
12.6 ± 1.52
12 ± 2.64
14 ± 1
14.6 ± 1.52
0.05
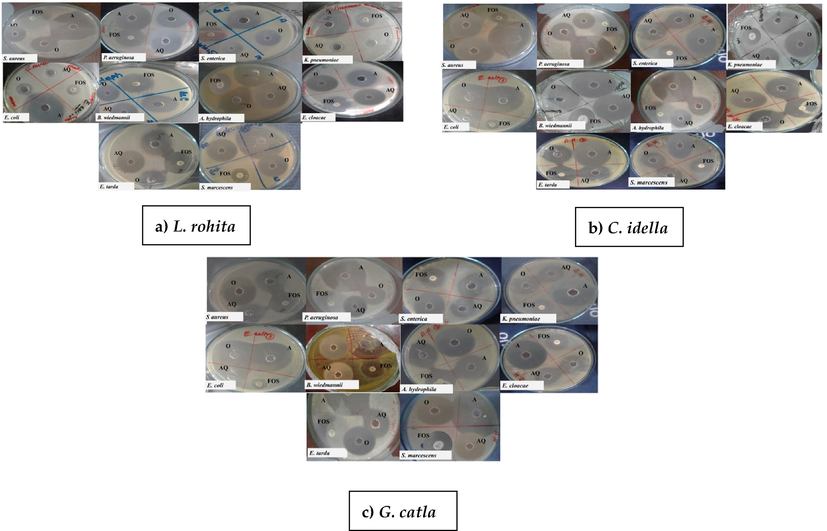
Bactericidal activity of skin mucus of a) L. rohita, b) C. idella and c) G. catla against different identified bacteria. Each MHA Petri plate was punched with three different wells and named A) Acidic, AQ) Aqueous, and O) Organic with the positive control (Fosfomycin). The figures clearly showed that the acidic skin mucus extract of all three species has high bactericidal activity at 4 mg/mL concentration against identified bacteria.
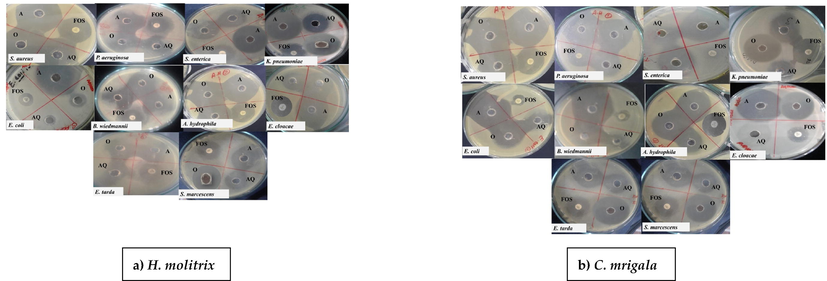
Bactericidal activity of skin mucus of a) H. molitrix and b) C. mrigala against different identified bacteria. Each MHA Petri plate was punched with three different wells and named A) Acidic AQ) Aqueous, O) Organic, and with the positive control (Fosfomycin). The figures clearly showed that acidic skin mucus extract of both species has high bactericidal activity at 4 mg/mL concentration against identified bacteria.
3.4 MIC of potent acidic mucus extracts
The acidic extracts of five selected species were further explored for MIC activities against all identified pathogenic bacteria. The inhibitory concentration of acidic skin mucus extract was observed to differ for diverse tested bacterial species. MIC results were found to be different for acidic mucus extracts on different bacterial pathogens. A. hydrophila, P. aeruginosa, and S. aureus were found to be the most susceptible bacteria against acidic extracts of L. rohita, G. catla, and C. Idella at a concentration of 16 µg/mL. The same bacteria as S. aureus and P. aeruginosa were observed to be the most susceptible against skin mucus of H. molitrix and C. mrigala fish at the 32 µg/mL concentration. Among the skin mucus from five Cyprinid species, L. rohita, C. Idella, and G. catla have the highest inhibitory activity as they inhibited 3 bacterial species at a concentration of 16 µg/mL compared to the activity of H. molitrix and C. mrigala (Table S3). The acidic mucus extract of C. Idella, L. rohita, and G. catla exhibited the ability to kill the bacteria even at a lower concentration (Fig. S2).
3.5 Biochemical characterization of mucus extracts
The change in colour from blue to purple or violet of different mucus extracts (acidic, organic, aqueous) showed the presence of proteins. Due to the presence of peptide bonds, the copper ions in the reagent undergo a charge reduction from + 2 to + 1, changing the colour from purple to blue. Among all the species, the acidic extract of L. rohita, C. idella, and G. catla has the highest protein content (303.6 ± 1.52, 250 ± 1.53, 240 ± 1.53 µg/mL, respectively) compared to C. mrigala and H. molitrix (90 ± 1.52: 100.79 ± 1 µg/mL respectively). Similarly, in the case of carbohydrates content, the colour change in the skin mucus sample from pale yellow to blue dark green showed the presence of carbohydrates, where carbohydrate gets dehydrated when reacting with concentrated H2SO4 and forming a mixture. This mixture reacts with anthrone reagents to give a bluish-green colored complex. L. rohita, C. idella, and G. catla have shown the highest concentration of carbohydrates (100 ± 1.52, 80 ± 1.32, 67 ± 1 µg/mL respectively) compared to C. mrigala and H. molitrix (50 ± 1.52; 40.5 ± 1.52 µg/mL respectively). Furthermore, the presence of lipids was confirmed by changing colour from dark pink to pale pink by adding a standardized alkali solution. The free fatty acids test showed that all the species have the least quantity of lipids compared to proteins and carbohydrates. The lipids content in L. rohita, C. idella, and G. catla (4.07 ± 0.05, 3.1 ± 1.52, 2.52 ± 1 g/mL, respectively) were found more compared to C. mrigala and H. molitrix (1.57 ± 1.53; 0.5 ± 1 g/mL respectively) (Table 6).
Fish Names
Mucus Extract
Protein conc. (µg/mL)
Carbohydrates conc. (µg/mL)
Lipids conc. (g/mL)
L. rohita
Acidic
303.6 ± 1.52
100 ± 1.52
4.07 ± 0.05
Ethanol
190.5 ± 1.53
60.5 ± 0.5
2.05 ± 0.07
Methanol
150 ± 2.5
50.5 ± 1.5
2.7 ± 1.5
Aqueous
100 ± 1.5
30.2 ± 1.5
1.2 ± 1.5
C. idella
Acidic
250 ± 1.53
80 ± 1.32
3.1 ± 1.52
Ethanol
150 ± 0.5
60.2 ± 2.5
2.0 ± 0.5
Methanol
140 ± 1.5
40.5 ± 0.5
1.5 ± 0.5
Aqueous
100 ± 1.5
30.2 ± 1.5
1.2 ± 1.5
G. catla
Acidic
240 ± 1.53
67 ± 1
2.52 ± 1
Ethanol
154 ± 1.52
40.5 ± 1.2
1 ± 0.5
Methanol
130 ± 0.5
25 ± 1.5
1 ± 0.5
Aqueous
100 ± 0.5
20.2 ± 1.5
0.5 ± 1.5
H. molitrix
Acidic
100.79 ± 1
50 ± 1.52
1.57 ± 1.53
Ethanol
40.2 ± 1.5
20.5 ± 1.52
0.007 ± 1.52
Methanol
40.2 ± 1.5
20.5 ± 1.52
0.005 ± 1.5
Aqueous
20.5 ± 1.5
10 ± 0.52
0.002 ± 1.5
C. mrigala
Acidic
90 ± 1.52
40.5 ± 1.52
0.5 ± 1
Ethanol
50.3 ± 0.5
30.2 ± 0.5
0.002 ± 0.5
Methanol
40.5 ± 1.5
25.2 ± 1.5
0.002 ± 0.5
Aqueous
20.5 ± 1.5
10 ± 0.52
0.002 ± 0.5
4 Discussion
Due to increased knowledge of fish as a crucial source of protein for a growing population, there is a rising demand for seafood on a global scale. Wild fisheries are presently in a state of decrease because of over-fishing, changes in climate, pollution, and other influences. Though fish are cultivated on an industrial scale (Muddassir et al., 2019), which are facing a significant epidemic of bacterial infections with consequent economic losses (Ali et al., 2016; Shah et al., 2012). However, information regarding the pathogenic bacterial flora from fish in Pakistan is rare, and the fish industry is even in its early development (Ullah et al., 2022). Therefore, the current study aimed to study bacteria in naturally infected farmed fish. The bacterial species reported by this study from the freshwater fish of Pakistan were interesting addition to the previously reported bacterial species from the diseased fish of the surrounding world (Joseph et al., 2013).
Skin mucus of fish serves as a biological barricade between the fish body and the surrounding bacterial pathogens in the aquatic environment. Studies determined the defending functions of skin mucus and its components in different fish species (Dash et al., 2018; Leng et al., 2022; Subramanian et al., 2007; Zou & Secombes, 2011). This research study evaluated the bactericidal activity of fish skin mucus isolated with different solvents as aqueous, acidic, and organic (ethanolic and methanolic), and reported significantly varied results. Among all the 4 different extracts of skin mucus, acidic extracts revealed strong bactericidal activity against A. hydrophila, S. marcescens, E. tarda, B. wiedmannii, K. pneumonia, E. coli, S. aureus, S. typhi and E. cloacae (Table 1-3). Although aqueous and organic mucus extracts also showed bactericidal activity against various bacteria, the ZOI was not as high as in acidic mucus extract. Such significant bactericidal activity of acidic mucus extract was reported earlier (Hellio et al., 2002). These findings collectively show that the components in acidic extracts present in the fish skin mucus have imperative functions in host immunity in the aquatic environment against bacteria (Shapo et al., 2007). Organic extract of the skin mucus from all the fish species in this study exhibited bactericidal activity, however, less than acidic extract, which probably shows that the bactericidal components could either be less in number or not be much activity in the skin mucus isolated with organic and aqueous solvent compared to acidic extracts, which need further investigation. The efficacy of skin mucus extracted with acidic solvent against pathogenic bacteria was due to the high solubility of mucus proteins in acetic acid than organic solvents (Hancock & Sahl, 2006). The bactericidal activity of fish skin mucus isolated with an organic solvent may hint that fish skin mucus could be used against bacteria with an alternative solvent as such extracts are rich in several secondary metabolites. The positively charged protein components in the skin mucus are thought to counteract the negatively charged bacterial membrane and create holes in the membrane by accumulating bactericidal components (Subramanian et al., 2008). Further studies could better underpin the precise number and nature of immune factors in the fish skin mucus extracted with different solvents that undergo bactericidal activity.
In the current study, the bactericidal activity of aqueous extract of skin mucus was highly varied in terms of effectiveness among species and compared to antibiotics. This result was parallel with the previous studies, which reported the bactericidal activity of aqueous extract of various fish skin mucus (Gobinath & Ravichandran, 2011; Subramanian et al., 2007). The observed variations in bactericidal activity are thought to be due to the different compositions of skin mucus secreted by different Cyprinid species. The cells produced by the skin epidermal and epithelial vary among fish species and thus influence the composition of fish skin mucus (Subramanian et al., 2008). Our study indicates that bactericidal potency is present in the aqueous extract of skin mucus from different fish. Notably, the species-specific varied skin mucus may minimize the chance of bacterial resistance invading the fish.
The MIC of skin mucus extract of a few fish species against various pathogenic bacteria has been observed (Rao et al., 2015). In our results, MIC of the acidic mucus extract of L. rohita, G. catla, and C. idella was 16 µg/mL against A. hydrophila, S. aureus, P. aeruginosa, whereas those of H. molitrix and C. mrigala showed 32 µg/mL. Previously, the MIC of acidic extracts of Tinca tinca skin mucus was 60 µg/mL against A. hydrophila. In comparison, Oncorhynchus mykiss and Cyprinus carpio showed MIC against S. aureus at 50 µg/mL (Ebran et al., 1999). (Hellio et al., 2002) reported the MIC value in the range of 25–48 µg/mL of skin mucus of different fish species against various pathogenic bacteria. Generally, our results are according to the previous reports; however, the difference in the MIC value of skin mucus may be varied with fish species and bacterial diversity (Hancock & Sahl, 2006). The higher bactericidal activity (in terms of MIC) is due to the cationic peptides with greater isoelectric points are more soluble in acidic environments (Hancock & Lehrer, 1998; Ming et al., 2007). The skin mucus of fish varies greatly with physiological and ecological conditions, and the skin mucus-generating cells located in the skin epithelial layer also vary among the fish species (Kumari et al., 2019; Nigam et al., 2012). Even though fish skin secretes more mucus with different factors in the winter than in summer (Jung et al., 2012). Taken together, ecological factors such as dissolved oxygen, pH, temperature, and invading bacteria considerably affect the secretion of skin mucus in fish (Subramanian et al., 2008). Therefore, the MIC we determined, could be helpful in strategies of making skin mucus alternative to antibiotics and drugs against fish and human pathogenic bacteria.
It is recognized that the mucus of the skin acts as a mechanical shield at the border and adjacent pathogenic bacteria (Reverter et al., 2018). Fish skin mucus is the reservoir of antibacterial components that slough and trap bacteria due to their role in innate immunity (Holm et al., 2015). The skin mucus from various fish such as Channa striatus, Arius maculates, and Anguilla japonica is proteinaceous (Manivasagan et al., 2009). The mucus of acidic extracts from different fish species was rich in proteins varying from 100.79 ± 0.03 to 305.00 ± 1.64 mg/mL when compared with other extracts of fish skin mucus (Kumari et al., 2019). The protein content in acidic extracts of skin mucus in our study varies from (90 ± 1.52 to 303.6 ± 1.52 µg/mL) of all the fish species. The relatively less content of proteins observed in our study could be due to the varied fish and climatic factors such as the pH of water, water quality, and the incidence of impurities. Although protein was a major component in the acidic extracts of skin mucus in all the fish of our study followed by carbohydrates and lipids. The findings of the current study are consistent with preceding work (Manivasagan et al., 2009) that found high protein content in the skin mucus of Aulostomus maculates and Hypophthalmichthys nobilis followed by carbohydrates and lipids. Further transcriptomic and proteomics-based studies could better establish the composition of fish skin mucus and the function of its potential immune components.
5 Conclusions
This pioneer report isolated and characterized the pathogenic bacteria from naturally infected farmed fish of Pakistan. The bactericidal activity of skin mucus from five fish species was established and the protein, carbohydrates, and lipid contents in the skin mucus from each species were measured. The information regarding the pathogenic bacteria will pave the way for the prevention of their possible transmission between the cultivable fish species in the studied region. The high bactericidal activity of the acidic skin mucus extracts of G. catla, L. rohita, and C. idella indicates the important bactericidal factors that can be used as resistant elements against bacteria. It may also hint that skin mucus can be used as an antibiotic with a lower challenge of antibiotic resistance and can be established as a cost-effective product.
Author contributions
S.A, F.U.D, and W.U designed the research study; S.A and S.Z conducted the experimental work; S.A, F.U.D, and M.R analyzed the data; S. A., F.U.D, and M.N.K.K drafted and finalized the Manuscript. All authors have read and proofed the Manuscript.
Declaration of Competing Interest
The authors declare that they have no known competing financial interests or personal relationships that could have appeared to influence the work reported in this paper.
References
- Effects of alkaline pH on protein and fatty acid profiles of epidermal mucus from Labeo rohita. J. Anim. Plant Sci.. 2013;23(4):1045-1051.
- [Google Scholar]
- Identification, characterization and antibiotic sensitivity of aeromonas hydrophila, a causative agent of epizootic ulcerative syndrome in wild and farmed fish from potohar, Pakistan. Pakistan J. Zool.. 2016;48(3):899-901.
- [Google Scholar]
- Fish-based bioactives as potent nutraceuticals: exploring the therapeutic perspective of sustainable food from the sea. Mar. Drugs. 2020;18(5):265.
- [Google Scholar]
- Antimicrobial properties of skin mucus from four freshwater cultivable fishes (Catla catla, Hypophthalmichthys molitrix, Labeo rohita and Ctenopharyngodon idella) Afr. J. Microbiol. Res.. 2012;6(24):5110-5120.
- [Google Scholar]
- Immune relevant molecules identified in the skin mucus of fish using-omics technologies. Mol. BioSyst.. 2016;12(7):2056-2063.
- [Google Scholar]
- Epidermal mucus, a major determinant in fish health: a review. Iranian J. Vet. Res.. 2018;19(2):72.
- [Google Scholar]
- Pore-forming properties and antibacterial activity of proteins extracted from epidermal mucus of fish. Comp. Biochem. Physiol. A Mol. Integr. Physiol.. 1999;122(2):181-189.
- [Google Scholar]
- Antimicrobial peptide from the epidermal mucus of some estuarine cat fishes. World App. Sci. J. 2011;12:256-260.
- [Google Scholar]
- Fish pathogen bacteria: Adhesion, parameters influencing virulence and interaction with host cells. Fish Shellfish Immunol.. 2018;80:550-562.
- [Google Scholar]
- Cationic peptides: a new source of antibiotics. Trends Biotechnol.. 1998;16(2):82-88.
- [Google Scholar]
- Antimicrobial and host-defense peptides as new anti-infective therapeutic strategies. Nat. Biotechnol.. 2006;24(12):1551-1557.
- [Google Scholar]
- Fish mucus: a neglected reservoir for antimicrobial peptides. Asian J. Pharm. Res. Dev.. 2018;6(4):6-11.
- [Google Scholar]
- Antibacterial, antifungal and cytotoxic activities of extracts from fish epidermis and epidermal mucus. Int. J. Antimicrob. Agents. 2002;20(3):214-219.
- [Google Scholar]
- Difference in skin immune responses to infection with salmon louse (Lepeophtheirus salmonis) in Atlantic salmon (Salmo salar L.) of families selected for resistance and susceptibility. Fish & Shellfish Immunol.. 2015;42(2):384-394.
- [Google Scholar]
- Occurrence of potential pathogenic Aeromonas species in tropical seafood, aquafarms and mangroves off Cochin coast in South India. Veterinary World. 2013;6(6)
- [Google Scholar]
- Seasonal variation and comparative analysis of non-specific humoral immune substances in the skin mucus of olive flounder (Paralichthys olivaceus) Dev. Comp. Immunol.. 2012;38(2):295-301.
- [Google Scholar]
- Description of isolated bacterial pathogens from diseased Cirrhinus mrigala. Aquac. Res.. 2021;52(5):2130-2137.
- [Google Scholar]
- Evaluation of the antibacterial activity of skin mucus of three carp species. Int. Aquat. Res,. 2019;11(3):225-239.
- [Google Scholar]
- Study on antibacterial properties of mucus extract of snakehead (Channa argus) against Escherichia coli and its application in chilled fish fillets preservation. LWT. 2022;167:113840
- [Google Scholar]
- Studies on the proteinaceous gel secretion from the skin of the catfish, Arius maculatus (Thunberg, 1792) Afr. J. Biotechnol.. 2009;8(24)
- [Google Scholar]
- 62. Frequency and antibiotic sensitivity of gram negative bacteria isolated from raw fish sold in Karachi, Pakistan. Pure Appl. Biol. (PAB). 2019;8(2):1631-1640.
- [Google Scholar]
- Purification of antimicrobial factors from human cervical mucus. Hum. Reprod.. 2007;22(7):1810-1815.
- [Google Scholar]
- Awareness and adoption level of fish farmers regarding recommended fish farming practices in Hafizabad, Pakistan. J. Saudi Soc. Agric. Sci.. 2019;18(1):41-48.
- [Google Scholar]
- Comparative analysis of innate immune parameters of the skin mucous secretions from certain freshwater teleosts, inhabiting different ecological niches. Fish Physiol. Biochem.. 2012;38(5):1245-1256.
- [Google Scholar]
- Evaluation of antibacterial activity and innate immune components in skin mucus of Indian major carp, Cirrhinus mrigala. Aquaculture Res.. 2017;48(2):407-418.
- [Google Scholar]
- RCM, Eliopoulos GM. Antimicrobial Combinations. Antibiotics in laboratory medicine (fifth ed.). Philadelphia, PA, USA: Lippincott Williams & Wilkins; 2005. p. :366-442.
- Defense properties in the epidermal mucus of different freshwater fish species. Aquaculture, Aquarium, Conservation & Legislation. 2015;8(2):184-194.
- [Google Scholar]
- Biological and ecological roles of external fish mucus: a reviewFishes. 2018;3(4):41.
- Prevalence of antibiotic resistance genes in the bacterial flora of integrated fish farming environments of Pakistan and Tanzania. Environ. Sci. Tech.. 2012;46(16):8672-8679.
- [Google Scholar]
- Antimicrobial activity in the common seawhip, Leptogorgia virgulata (Cnidaria: Gorgonaceae) Comp. Biochem. Physiol. B Biochem. Mol. Biol.. 2007;148(1):65-73.
- [Google Scholar]
- MICs and minimum fungicidal concentrations of amphotericin B, itraconazole, posaconazole and terbinafine in Sporothrix schenckii. J. Med. Microbiol.. 2009;58(12):1607-1610.
- [Google Scholar]
- Correlation between three freshwater fish skin mucus antiproliferative effect and its elemental composition role in bacterial growth. Turkish J. Fisheries Aquatic Sci.. 2021;21(5):233-244.
- [Google Scholar]
- A comparative study on innate immune parameters in the epidermal mucus of various fish species. Comp. Biochem. Physiol. B Biochem. Mol. Biol.. 2007;148(3):256-263.
- [Google Scholar]
- Comparison of antimicrobial activity in the epidermal mucus extracts of fish. Comp. Biochem. Physiol. B Biochem. Mol. Biol.. 2008;150(1):85-92.
- [Google Scholar]
- Comparative pathogenomics of bacteria causing infectious diseases in fish. Int. J. Evolut. Biol. 2012
- [Google Scholar]
- Diagnostic Procedures for Fin Fish Diseases: Histological Procedure and Bacteriology. Bangkok, Thailand: Published by Aquatic Animal Health Research Institute; 1999.
- Biodegradação do petróleo por bactérias isoladas de peixes do oceano Índico. Braz. J. Biol. 2022:82.
- [Google Scholar]
- Antimicrobial susceptibilities of Proteus mirabilis: a longitudinal nationwide study from the Taiwan surveillance of antimicrobial resistance (TSAR) program. BMC Infect. Dis.. 2014;14(1):1-10.
- [Google Scholar]
- Teleost fish interferons and their role in immunity. Dev. Comp. Immunol.. 2011;35(12):1376-1387.
- [Google Scholar]
Appendix A
Supplementary material
Supplementary data to this article can be found online at https://doi.org/10.1016/j.jksus.2023.102731.
Appendix A
Supplementary material
The following are the Supplementary data to this article:


