

Translate this page into:
Attenuation of reactive oxygen species (ROS) generation in the cultured retinal cells under high glucose conditions
-
Received: ,
Accepted: ,
This article was originally published by Elsevier and was migrated to Scientific Scholar after the change of Publisher.
Peer review under responsibility of King Saud University.
Abstract
The excess reactive oxygen species (ROS) formation due to diabetes-induced hyperglycemia is believed to play a central role in the pathophysiology of diabetic complications including diabetic retinopathy. However, the mechanism of excess ROS generation due to hyperglycemia is still uncertain. In this study, we measured ROS levels under the influence of low and hyperglycaemic conditions in the cultured retinal Muller (TR-MUL) and bovine retinal endothelial cells (BRECs) to better elucidate the basis of oxidative stress. The most common fluorescent dye, CM-H2DCFDA was used to examine the ROS level in the cultured retinal cells after incubations with high (30 mM) and low glucose (5.5 mM), and treatments with metabolites (pyruvate, glutamate, and glutamine), oxidizing agents (diamide, CuSO4), and endotoxin, lipopolysaccharide (LPS). Our results showed high glucose did not increase ROS levels in both TR-MUL and BRECs cells; on the contrary, high glucose resulted in a significant decrease in ROS levels compared to low glucose (P < 0.05). Diamide and CuSO4 treatment induced a large increase in ROS levels in the TR-MUL cells at low glucose, while high glucose significantly reduced its levels (P < 0.05). Pyruvate and glutamate ameliorated, while glutamine augmented the ROS level in the TR-MUL cells. LPS induced ROS formation, while high glucose incubation significantly reduced its level (p < 0.05). The results of this study do not support the high glucose-induced increase in ROS levels in the cultured retinal cells; rather, high glucose appeared to have ameliorative effects on oxidative stress, induced due to low or euglycemic conditions.
Keywords
Muller cells
Endothelial cells
Hyperglycaemia
Oxidative stress
Retina

1 Introduction
Hyperglycemia, the hallmark of diabetes, is commonly regarded as a key risk factor and main activator of cellular damage, which leads to a variety of diabetic sequelae, including diabetic retinopathy, the leading cause of blindness globally (Ola et al., 2012; Yau et al., 2012; Zhu et al., 2019; Ola, 2021). The Diabetes Control and Complications Trial (DCCT) and the Epidemiology of Diabetes Interventions and Complications research (EDIC) revealed that strict glycemic control can delay the onset and severity of diabetic vascular complications in the long run **(The Diabetes Control and Complications Trial Research Group, 1993; Progression of retinopathy, 1995). However, these clinical trials, along with other investigations, found that intensive glycemic control and/or glycemic variability (alternation of hyperglycemic and hypoglycemic episodes) had a negative effect on the vasculature, leading to an initial worsening of diabetic retinopathy (DR) (Progression of retinopathy, 1995; Mizutani et al., 1996; UK Prospective Diabetes Study Group, 1998). In both Types I and II diabetes, multiple investigations have found that diabetic retinopathy often worsens several-fold despite stringent glycaemic control, particularly after extensive treatment with insulin or sulphonylureas (Dagogo-Jack, 2004; Heine et al., 2004; Kilpatrick et al., 2008). Aside from many findings on hyperglycemia-induced reactive oxygen species (ROS) formation in the retinas of diabetic animals and cultured retinal cells (Brownlee, 2001; Hammes et al., 2003; Devi et al., 2013), numerous studies have also shown that glycemic fluctuation or low glucose circumstances are effective inducers of oxidative stress (Ge et al., 2010; Sun et al., 2010; Ceriello et al., 2014; Klimontov et al., 2021). This is well supported by studies in rodents’ model of diabetes, where low glucose exposure due to intermittent treatment with insulin showed impairment in endothelial function (Horváth et al., 2009). In addition, several studies reported, that acute hypoglycemia is associated with increased ROS production, endoplasmic reticulum stress, apoptosis, and a rise in inflammatory cytokines, which may potentially cause retinal endothelial and pericytes damage that could lead to the development of vascular disease and retinal cell damage (Rego and Santos, 1999; Ikesugi et al., 2006).
Although the potential role of ROS in the pathophysiology of diabetes and its consequences has been extensively described, the mechanism of excess oxygen free radicals caused by hyperglycemia is still unknown. It is widely believed that high serum glucose levels, which are prevalent in diabetic humans and experimental animals with diabetes, might increase cellular glucose levels, causing an increase in glycolytic fluxes and oxidation, resulting in an increase in ROS build-up (Nishikawa et al., 2000; Xu et al., 2021). Hyperglycemia-induced increased oxidation in the mitochondria is thought to be a primary source of ROS in diabetes. However, our metabolic analyses in diabetic rat retinas, on the other hand, did not support mitochondria as a primary source of excessive ROS production under hyperglycemic circumstances (Ola, 2021; Ola et al., 2006). The level of ROS in diabetic retinas was high under normoglycemic conditions compared to hyperglycemic conditions, similar to the elevated ROS seen in glycemic fluctuation or low glucose conditions (Ola, 2021; Klimontov et al., 2021).
In the current study, we measured ROS levels in isolated retinal cells under the influence of normoglycemic and hyperglycemic conditions, particularly in the cultured retinal Muller and endothelial cells, to learn more about the precise cellular sources and mechanisms of excess ROS caused by glycaemic variability. These retinal cells are the first to be influenced by the systemic glycaemic variability as in the case of diabetes, due to their direct contact with the circulating level of glucose. They take up glucose from the bloodstream to maintain energy homeostasis and meet the high energy demands of neuronal activity, as well as to protect the neuronal retina from oxidative stress (Huster et al., 2000; Bringmann and Reichenbach, 2001). Overproduction of ROS by diabetes-induced significant spikes or falls in glucose within endothelium and Muller cells may damage these cells (Berkowitz et al., 1995). We analyzed the ROS generation in the cultured retinal cells, and a comparison was made among various incubation conditions, especially under low glucose conditions to elucidate the basis of oxidative stress, which can lead to cellular damage in diabetic retinopathy.
2 Methods
2.1 Chemicals
Low glucose Dulbecco's Modified Eagle's Medium (DMEM) and heat-inactivated fetal bovine serum (FBS) were purchased from Gibco-BRL life science products. 5-(and-6)-carboxy-2,7-dichlorodihydrofluorescein diacetate (CM-H2DCFDA) was purchased from Molecular Probes (Eugene, OR). Glutamine, glutamate, pyruvate, 6-diazo-5-oxo-L-norleucine (DON), and other chemicals were acquired from Sigma Chemical (St. Louis, MO). Tissue culture plasticware was from Falcon (BD Biosciences, Bedford, MA). All other chemicals used in this study were of analytical grade.
2.2 Muller and primary bovine retinal endothelial cells (BREC) culture
The conditionally immortalized rat retinal Müller cell line (TR-MUL) was generously supplied to us from the Laboratory of Dr. Ken-Ichi Hosoya, Japan (Tomi et al., 2003). TR-MUL cell is a unique cell model that expresses almost all the glial enzymes for glutamate metabolism to support neuronal activity (Ola et al., 2011). After obtaining the TR-MUL cells, which were developed and grown in high glucose media, were switched to culture the cells in the low glucose (5.5 mM) DMEM medium supplemented with 5% (v/v) FBS, 100 U/ml penicillin, and 100 µg/ml streptomycin and maintained at 33 °C in a humidified atmosphere of 5% CO2/95% air. Every other day, the media was replaced until the cells became confluent. Once confluent, approximately 2–3 × 10³ cells per well were seeded onto 96 well cell culture plates and grown in the culture media with 2% (v/v) FBS and maintained at 33 °C, in a humidified, 5% CO2 atmosphere for various experimental purposes. Primary bovine retinal endothelial cells (BRECs) were generously provided by Dr. Edward A. Felinski, from Drs. David Antonetti and Thomas Gardner laboratory at College of Medicine, Penn-State, Hershey, USA. BRECs were isolated and cultured routinely, as described previously in his laboratory (Antonetti and Wolpert, 2003; Harhaj et al., 2006). Briefly, bovine retinas were homogenized and applied to the filtration steps to isolate the endothelial cells. BRECs were cultured in MCDB-131 medium (Sigma) supplemented with 10% fetal bovine serum (Hyclone, Logan, UT), 10 ng/ml epidermal growth factor (Sigma), 0.2 mg/ml endothelial cell growth medium additive (EndoGro; Vec Technologies, Rensselaer, NY), 0.09 mg/ml heparin (Fisher Scientific), and 0.01 mg/ml antibiotic–antimycotic (Invitrogen). When the BRECs attained confluence, the medium was changed to MCDB-131 supplemented with 1% FBS, 0.01 mg/ml antibiotic–antimycotic, and 100 nM hydrocortisone, and the cells were incubated for another 24 h. In our study, we employed BREC cells in passages 4–6.
2.3 Measurement of ROS in the cultured cells
The generation of free radicals in the cultured cells was measured using the CM-H2DCFDA assay, which is a commonly used method for determining ROS levels (Ola, 2021). A fresh stock solution of CM-H2DCFDA was prepared (2.16 mM; 1 vial of CM-H2DCFDA (50 μg) + 10 μl DMSO + 30 μl PBS). This dye was diluted further in HEPES buffer, and a working concentration of 10 µM was employed to incubate cells and quantify ROS levels. The dye easily crosses cell membranes and is oxidized into a highly fluorescent molecule by free radicals. The culture media was removed, and the cells were washed and incubated in a new HEPES buffer for different time intervals at 33 °C containing 10 μM dye for determination of the cellular level of ROS. The dye-loaded cells were subjected to various treatments for varying amounts of time. The fluorescence was measured at a wavelength of 485 nm for excitation and 535 nm for emission using a fluorescence plate reader (SpectraMax Plus; Molecular Devices, Sunnyvale, CA). The fluorescence emitted is proportional to the amount of free radicals present.
2.4 Hyperglycaemic effects on TR-MUL cells and ROS determination
The generation of free radicals in the cultured cells was measured using the CM-H2DCFDA assay (Horváth et al., 2009). A fresh stock solution of CM-H2DCFDA was prepared (2.16 mM; 1 vial of CM-H2DCFDA (50 μg) + 10 μl DMSO + 30 μl PBS). This dye was diluted further in Hepes-bicarbonate buffer to 10 µM, which was employed to incubate cells to quantify ROS levels. Approximately 1–2 × 10³ cells were seeded in 96 well plates, and fresh media was changed every 24 h. Cells with 80–90 percent confluency were washed twice with Hepes buffer. Then, they were loaded with the dye (10 μM) in Hepes buffer containing either normal glucose or high glucose, and incubated for 30, 60, 120, and 240 min for ROS measurements. In addition, three separate 96 well plates were seeded for 1, 3, and 5 days’ treatments with high and normal glucose. At the end of treatments, they were washed and incubated with 200 µl Hepes buffer with either high or normal glucose containing 10 µM CM-H2DCFDA and incubated for 2 h. The fluorescence was measured at a wavelength of 485 nm for excitation and 535 nm for emission using a fluorescence plate reader (SpectraMax Plus; Molecular Devices, Sunnyvale, CA). The fluorescence emitted is proportional to the amount of free radicals.
2.5 Influence of hyperglycemia on ROS in TR-MUL cells treated with diamide and CuSO4
TR-MUL cells were cultured in 96 well plates in DMEM supplemented with 2% FBS in normal glucose (5.5 mM) and high glucose (30 mM). After rinsing the medium in each well with sterile PBS, the cells were incubated for 2 h in 200 μl Hepes-bicarbonate buffer with high and low glucose, 10 μM CM-H2DCFDA, in the presence of either 200 μM diamide or 20 μM CuSO4 for ROS measurement. Diamide and CuSO4 are well-known oxidizing agents that produce ROS and cause cell damage (Piccirillo et al., 2009; Kumar et al., 2016). In the presence of high and normal glucose, we utilized these oxidizing agents to treat TR-MUL cells.
2.6 ROS determination in the TR-MUL cells treated with pyruvate, glutamate, and glutamine
TR-MUL cells were cultured in 96 well plates with 5.5 mM glucose in DMEM supplemented with 2% FBS to determine ROS treated with pyruvate, glutamate, and glutamine. After 90 percent confluence, cells were washed with sterile PBS and treated for 2 h with 10 μM CM-H2DCFDA in Hepes-bicarbonate buffer containing 5.5 mM, 30 mM glucose, 5.5 mM glucose plus 5 mM pyruvate, and 5.5 mM glucose plus 5 or 10 mM glutamine. After treatments, ROS was quantitated. In addition, an analysis of the effect of 6-diazo-5-oxo-L-norleucine (DON) on free radical production following treatment of cultured TR-MUL cells with glutamine was carried out. TR-MUL cells were grown in 96 well plates with 5.5 mM glucose in DMEM media with 2% FBS. They were washed and treated with DON (1 mM) in Hepes-bicarbonate buffer for 30 min before treatments with 5 and 10 mM glutamine and 10 μM CM-H2DCFDA, and incubated for 2 h. The ROS generated in each well was quantified using a fluorescence plate reader after incubations.
2.7 ROS measurement in the Muller cells treated with IL-1β, TNF-α, and LPS
Cytokines (IL-1β, TNF-α) and endotoxin, lipopolysaccharide (LPS) were kindly provided by Dr. Steve Abcouver, College of Medicine, Penn-state University, USA. TR-MUL cells were cultured for 5 days in 96 well plates in DMEM supplemented with 2% FBS in normal glucose (5.5 mM). The cells were washed with fresh PBS and then incubated for 2 h in 200 μl Hepes-bicarbonate buffer with high and normal glucose with 10 μM CM-H2DCFDA in the presence or absence of cytokines (10–80 ng/ml; IL-1β and TNF-α) and 20 ng/ml LPS. LPS is a well-known endotoxin that has been frequently employed as an inflammagen to induce oxidative stress and inflammation. The amount of ROS produced after treatments were quantified using a fluorescence plate reader.
2.8 Bovine retinal endothelial cells (BRECs) culture, treatments, and ROS level
BREC cells were grown and used in experiments at cell passages 4–6. Confluent cells were split, and 4–5 × 10³ cells were seeded per well in the 96 well plates coated with fibronectin (1 μg/ml). Every 24 h, the cell culture media was changed with fresh media. When the cells were 80–90 percent confluent on the fifth day, the medium was replaced and the cells were washed twice with HEPES-Bicarb buffer containing normal glucose (5.5 mM). The cells were then treated for 1–8 h with CM-H2DCFDA dye (10 μM) in Hepes-Bicarb buffer with normal glucose, high glucose, normal glucose plus 5 mM pyruvate, and high glucose plus 5 mM pyruvate. Another flask of BREC cells was split and seeded in three separate 96 well plates for 1, 3, and 5 days’ treatments with high and normal glucose. The next day after cell seeding, the media was replaced with the fresh media containing 1% FBS, and the first 96 well plate was treated with high or normal glucose for 5 days (5-days treatment). The fresh treatment media with high and normal glucose were replaced every 24 h. The other two plates of cells were grown normally under normal glucose conditions. Two days after seeding, the second 96 well plate was treated with normal and high glucose conditions for three days (3-days treatments). Finally, the third 96 well plates, after 4 days of culture with normal glucose conditions, were treated with high and normal glucose for 24 h (1-day treatment). At the end of 1, 3, and 5 days of normal and high glucose treatments, media was aspirated and washed with sterile PBS. Cells were incubated with 200 µl Hepes-bicarbonate buffer with either high or normal glucose, normal glucose plus 5 mM pyruvate, or normal glucose plus 5 mM glutamine treatment conditions containing 10 µM CM-H2DCFDA and incubated for 2 h. The amount of ROS produced was quantified using a fluorescence plate reader.
2.9 Statistical analysis
The data are expressed as the mean ± standard error of mean SEM). The student’s t-test was used for comparisons between two groups. One-way ANOVA tests were performed to compare multiple groups followed by Tukey’s post hoc test. The p-value is presented as *,#,$,++p < 0.05, considered significant in all experiments.
3 Results
3.1 High glucose exposure decreased ROS generation in the TR-MUL cells
The widely used fluorescent dye, CM-H2DCFDA was employed to examine the effect of glycemic variability on reactive oxygen species production in cultured Muller cells. Normal and high glucose concentrations were tested on Muller cells grown in 96-well plates. First, we optimized the CM-H2DCFDA concentration for ROS detection and discovered that 10 μM of the dye produced a linear range of ROS generation when incubated with cultured Muller cells as shown in the insert of Fig. 1A. A significant decrease (19%; p < 0.05) in ROS level was found with high glucose (30 mM) compared to normal glucose (5.5 mM) as soon as after 30 min of treatment in the first set of time-course experiments (Fig. 1A). From one to four hours of incubation with high glucose, the ROS level dropped significantly to around 25% as compared to normal glucose. Furthermore, a significant decrease in ROS level was detected at all the time points in the second set of long-term incubations (1, 3, and 5 days) with high glucose treatments as compared with normal glucose (p < 0.05) (Fig. 1B). The extent of decrease in ROS levels between high and normal glucose appeared to be unaffected by the duration of incubation time. No significant reduction was observed between 1, 3, and 5 days’ treatments with high glucose. Thus, hyperglycemia did not result in an increase in ROS levels in the TR-MUL cells; on the contrary, high glucose resulted in a decrease in ROS levels.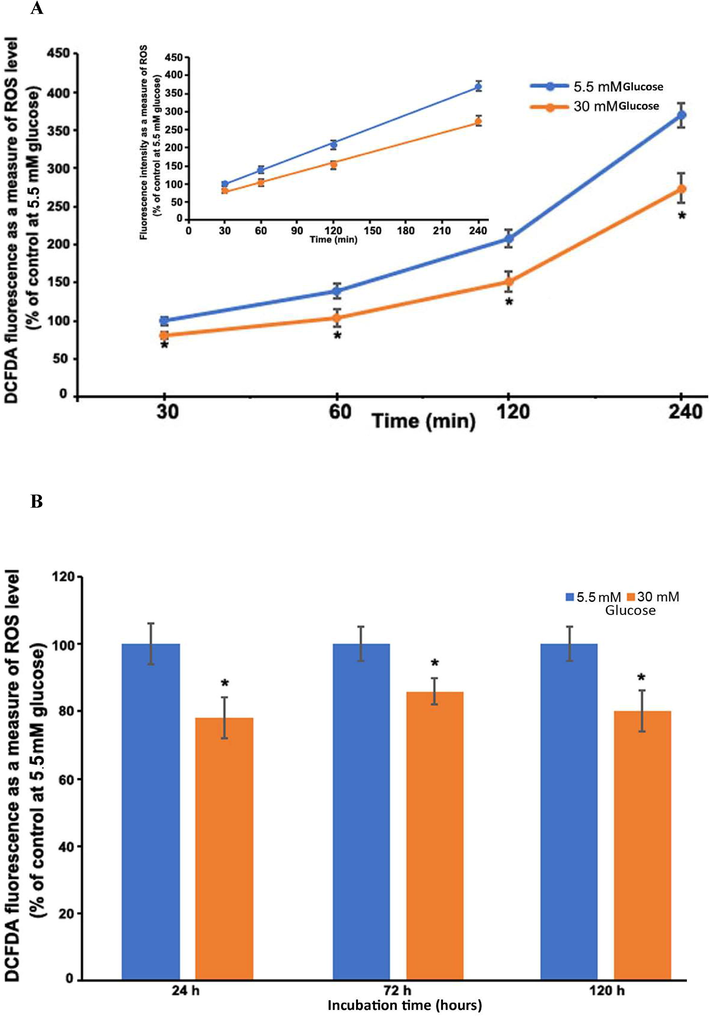
Time-course measurements of ROS production in TR-MUL cells with glucose treatments. The percent of fluorescence intensity is plotted as a percent of control at normal glucose treatment. (A) Short-term: ROS after 30 min to 4 h treatment with normal and high glucose. Insert 1A; indicates a linear increase in CM-H2DCFDA fluorescence. (B) Long-term (1, 3, and 5 days) treatments with normal and high glucose concentrations. Results of 3 independent experiments, each bar (means ± SEM), of 8–10 seedings. *P < 0.05 compared to 5.5 mM glucose.
3.2 Hyperglycaemia ameliorated the ROS level activated by diamide and CuSO4 in TR-MUL cells
Muller cells were cultured and exposed to oxidizing agents, diamide (200 μM), and CuSO4 (20 μM) with high and low glucose conditions. In comparison to normal glucose, high glucose induced a significant decrease in ROS levels. After two hours of CuSO4 and diamide treatments, a significant increase in ROS was observed (more than 2 folds) than in untreated cells. The diamide-induced increase in ROS in the cells at normal glucose was considerably reduced by high glucose (#p < 0.05) (Fig. 2). Also, CuSO4 treatment induced a large increase in ROS levels in cells at normal glucose, while high glucose dramatically reduced ROS levels (*P < 0.05).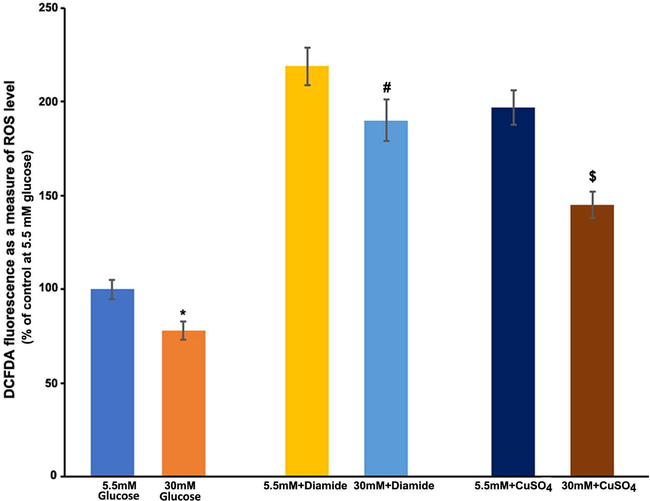
Measurements of free radical production after exposure of diamide and CuSO4 to cultured TR-MUL cells. TR-MUL cells were cultured for 5 days in 96 well plates in DMEM supplemented with 2% FBS in normal glucose. After rinsing the medium in each well with sterile PBS, the cells were incubated for 2 h in 200 μl Hepes-bicarbonate buffer containing high and low glucose, 10 μM CM-H2DCFDA, with either 200 μM diamide or 20 μM CuSO4. After treatments, fluorescent intensity was measured as a measure of ROS, and results are presented as means ± SEM of 2 independent experiments from 6 to 8 different seedings. *P < 0.01 and vs. 5 mM glucose; #p < 0.05 vs. 5.5 mM glucose + diamide, and $p < 0.05 vs. 5.5mMglucose + CuSO4.
3.3 Pyruvate and glutamate ameliorated, while glutamine augmented the ROS level in TR-MUL cells
In cultured Muller cells, we examined the effect of pyruvate, a glycolysis end product, and glutamate and glutamine as a TCA cycle intermediary, on ROS formation. Interestingly, when compared to 5.5 mM glucose alone, both 5 and 10 mM pyruvate reduced significantly the ROS levels within 2 h, which was equivalent to the level of ROS observed with high glucose (P < 0.05) (Fig. 3A). However, there was no discernible difference in ROS levels between the 5 and 10 mM pyruvate treatments. Furthermore, at normal glucose, glutamate treatments to the cells resulted in a significant reduction in ROS levels than untreated cells (P < 0.05) (Fig. 3B). The amount of ROS at both 5 and 10 mM glutamate treatments was reduced to a similar level as observed with 30 mM glucose treatment. However, glutamine treatments significantly elevated the ROS levels in a concentration-dependent manner. Within 2 h of treatment with 5 mM glutamine, the ROS level increased by almost 20%, while 10 mM glutamine further increased the level by 50% as compared to untreated cells without glutamine (Fig. 4). We employed DON, a glutamine analog and selective glutaminase enzyme inhibitor that may alter ROS levels by preventing ammonia formation in cells. However, unexpectedly, it appears that DON significantly increased the generation of ROS as compared to without DON treatments (P < 0.05).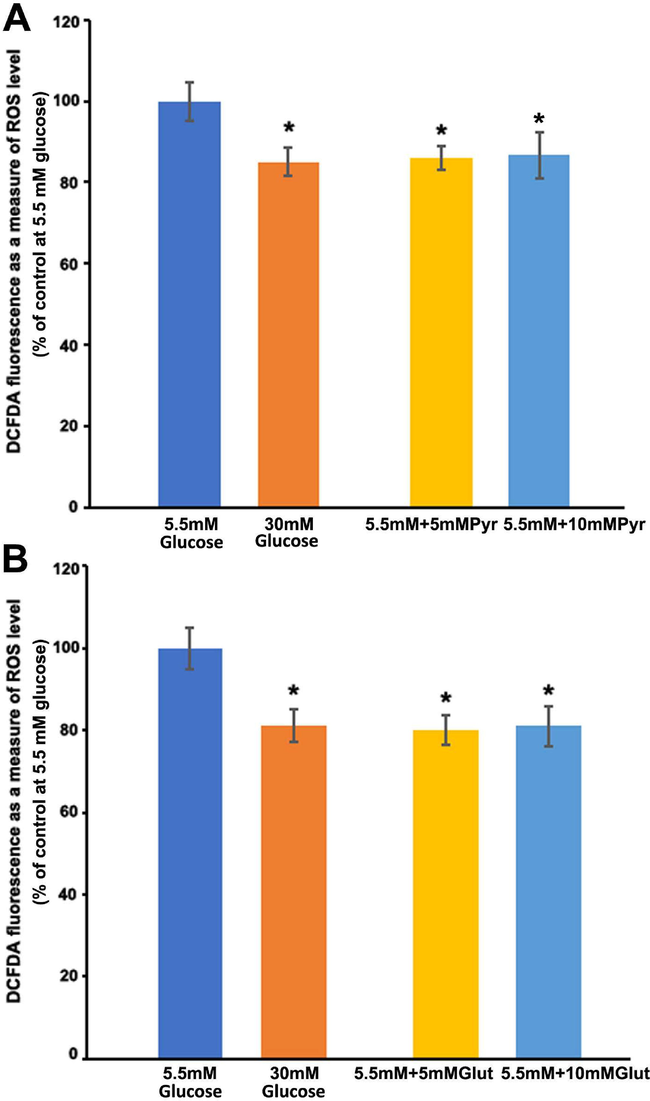
Measurements of free radical production after exposure of pyruvate and glutamate to cultured TR-MUL cells. TR-MUL cells were cultured in 96 well plates in DMEM supplemented with 2% FBS in normal glucose. After rinsing the medium in each well with sterile PBS, the cells were incubated for 2 h in 200 μl Hepes-bicarbonate buffer containing high and low glucose, 10 μM CM-H2DCFDA, with either pyruvate or glutamate. A. Cells were treated with high and normal glucose, and normal glucose plus 5 mM or 10 mM pyruvate. B. Cells were treated with high or normal glucose and normal glucose plus 5 or 10 mM glutamate. Each bar represents the means ± SEM, of 2 independent experiments from 6 to 8 different seedings. *P < 0.05 and vs. 5 mM glucose.
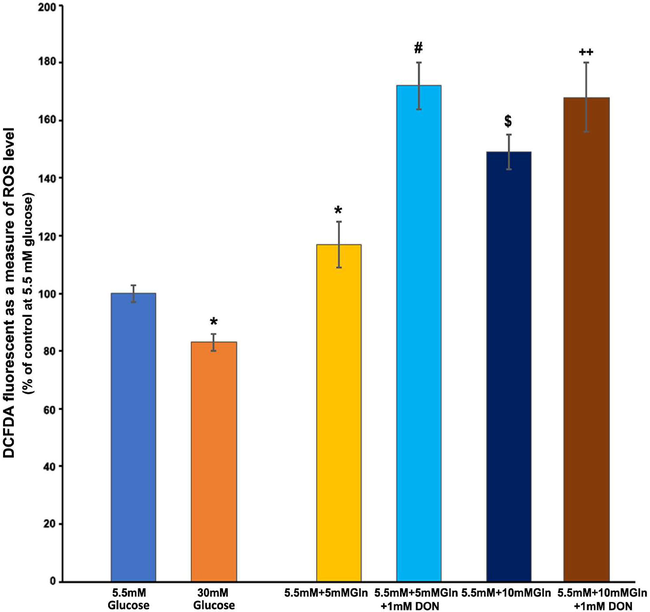
Effect of glutamine and 6-diazo-5-oxo-L-norleucine (DON, 30-min pretreatment) on free radical production. TR-MUL cells were cultured in 96 well plates in DMEM supplemented with 2% FBS in normal glucose (5.5 mM). After rinsing the medium in each well with sterile PBS, the cells were incubated for 2 h in 200 μl Hepes-bicarbonate buffer containing high and low glucose, 10 μM CM-H2DCFDA, with glutamine (5 and 10 mM) for 2 h. Additionally, Muller cells in the 96 well plate were pretreated with DON (1 mM) 30 min before glutamine treatments. After treatments, fluorescent intensity was measured as a measure of ROS, and results are presented as means ± SEM of 2 independent experiments from 8 to 10 different seedings. Asterisk, *P < 0.05 vs. 5 mM glucose; #P < 0.01 vs. 5 mM glucose, and 5 mM glutamine; $P < 0.05 vs. 5 mM + 5 mM glutamine (Gln); ++P < 0.05 vs. 5 mM + 10 Gln.
3.4 High glucose attenuated the ROS level activated by LPS in TR-MUL cells
Inflammatory cytokines generated in the retina or retinal cells as a result of diabetes and/or hyperglycemia may contribute to the advancement of DR by producing ROS in early diabetes. There was no significant change in the ROS level when Muller cells were exposed to IL-1β or TNF-α at concentrations ranging from 10 to 80 ng/ml for up to 2 h with either high or normal glucose (data not shown). However, when LPS was treated to Muller cells, even at low concentrations (20 ng/ml), a considerable rise in ROS was observed within 2 h (p < 0.05) (Fig. 5). Interestingly, high glucose significantly reduced the level of ROS induced by LPS ($p < 0.05).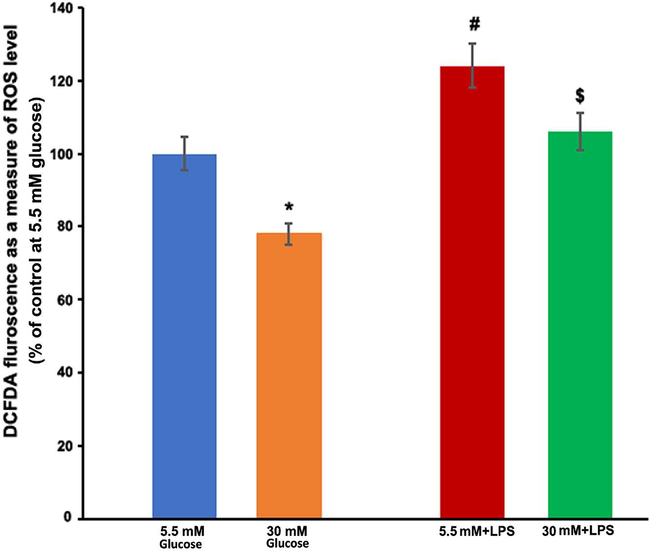
LPS induced activation of ROS in TR-MUL cells. TR-MUL cells were cultured in 96 well plates in DMEM supplemented with 2% FBS in normal glucose (5.5 mM). After rinsing the medium, TR-MUL cells were treated in the Hepes-bicarbonate buffer containing either normal glucose or high glucose, and with or without 20 ng/ml lipopolysaccharide (LPS) and incubated for 2 h. After treatments, fluorescent intensity was measured as a measure of ROS, and results are presented as means ± SEM of 2 independent experiments from 6 to 8 different seedings. *P < 0.05 vs. normal glucose; $P < 0.05 vs. 5 mM + LPS.
3.5 High glucose exposure did not induce ROS production in the bovine retinal endothelial cells (BRECs)
BREC cells were treated with high and normal glucose for 1, 2, 4, and 8 h in the first set of high glucose treatment studies, and ROS production was assessed. In these short-term treatment periods (1–8 h), there was no significant change in ROS levels between high and normal glucose (Fig. 6A). Pyruvate exposure seems not to increase ROS levels, rather a slight decrease in ROS level was observed compared to both high and normal glucose treatment conditions (Fig. 6A). Furthermore, in the second set of long-term exposure (24–120 h; 1, 3, and 5 days) with high glucose, a significant decrease in the ROS level was found as compared to normal glucose treatments (p < 0.05) (Fig. 6B). However, the magnitude of the reduced difference in ROS levels between high and normal glucose treatments remained consistent and was unaffected by the duration of incubation time. In addition, pyruvate administration to BREC cells for two hours did not affect ROS levels, which were similar to those observed after 1–5 days of normal glucose incubation. Intriguingly, cells treated with glutamine for two hours produced significantly more ROS than cells treated with either normal or high glucose (P < 0.01). Glutamine (5 mM) treatments boosted ROS levels by over 30–40% as compared to cells treated with 5 mM glucose alone. Thus, high glucose did not produce an increase in ROS levels in BREC cells, but rather a decrease in ROS levels observed, especially when cells were exposed to high glucose for long-term periods (1–5 days) (Fig. 6B).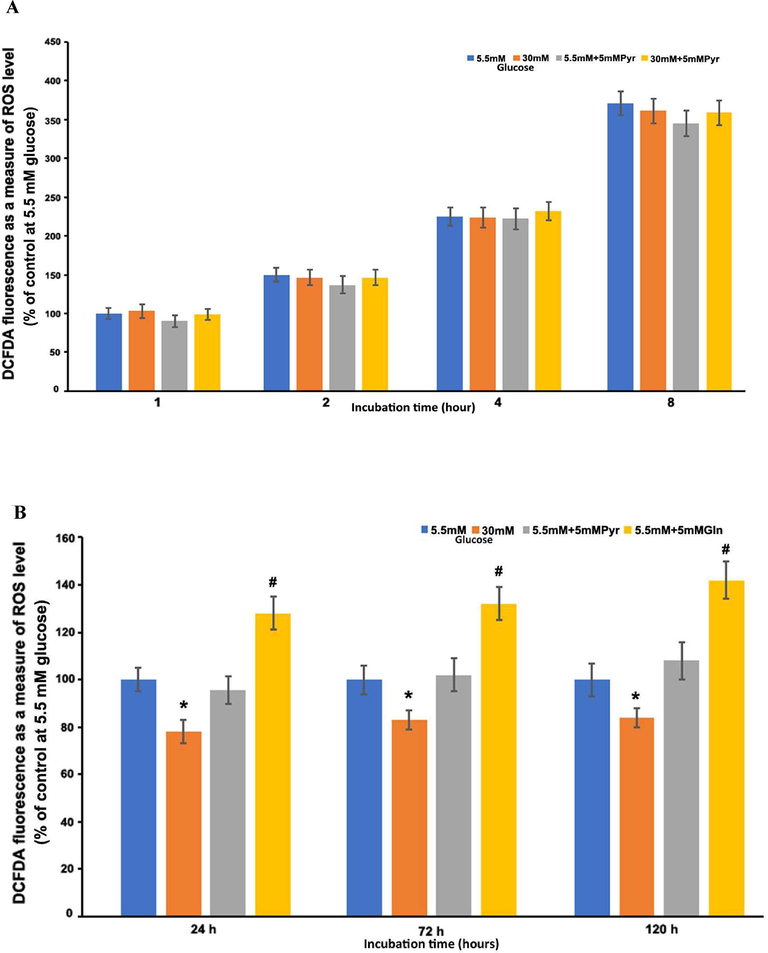
Time-course measurements of ROS production in BRECs with glucose treatments. BREC cells were cultured with normal glucose, high glucose, normal glucose plus 5 mM pyruvate, and high glucose plus 5 mM pyruvate, (A) Short-term incubation (1–8 h). (B) Long-term incubation (1–5 days). Results of 2–3 independent experiments and each point represent (means ± SEM) of 8–10 seeding. *P < 0.05 vs. 5.5 mM glucose; #P < 0.01 vs. 5.5 mM, 30 mM glucose, 5.5mMglucose + 5 mM pyruvate.
4 Discussion
The main goal of this study was to precisely evaluate ROS at the cellular level and the mechanism of ROS generation due to hyperglycemic or normoglycemic conditions in the isolated cultured retinal cells, particularly in the cultured retinal Muller and endothelial cells. We employed highly differentiated and well-characterized cultured Muller (TR-MUL) cells, as a glial cell model of the retina, which expresses markers and enzymes specific for glutamate metabolism to maintain energy needs and neurotransmission of the retina (Tomi et al., 2003; Ola et al., 2011; Magistretti et al., 1999; Ola et al., 2019; Ola and LaNoue, 2019). Furthermore, we employed well-characterized primary bovine retinal endothelial cells (BRECs), which are the principal vascular cells in the retina that maintain glucose homeostasis and metabolism for high energy demand. We used the fluorescent dye CM-H2DCFDA, which is a commonly used cell-permeant ROS marker. The extent of oxidation of the dye due to free radical production was used to determine the level of oxidative stress caused by the cells under normoglycemic and hyperglycemic circumstances.
ROS level was measured in the TR-MUL cells after short (30–240 min) and long-term (1–5 days) incubations with high glucose (30 mM), and normal glucose (5.5 mM). Surprisingly, compared to a normal level, high glucose treatments resulted in a significantly lower endogenous ROS level. When compared to high glucose treatments, cultured TR-MUL cells treated with normal glucose levels appeared to be under oxidative stress, as demonstrated by an elevated ROS level starting at 30 min to 5 days’ incubation periods. It might be possible that under in vitro culture conditions, the normal concentration of glucose might cause oxidative stress to these Muller cells similar to as reported with low glucose conditions in the retinal cells (Rego and Santos, 1999; Ikesugi et al., 2006). High glucose levels, on the other hand, ameliorated oxidative stress. Indeed, this appears to be relevant since these cells were isolated and maintained in the DMEM media at high glucose concentration for their normal cellular growth and function (Tomi et al., 2003). Moreover, this is consistent with another study that reported that cultured human Muller cells (HMCs) consume high glucose compared to human retinal endothelial cells under normal cell culture conditions (Busik et al., 2008). For these glucose exposure experiments, TR-MUL cells maintained with high glucose medium were switched to normal or low glucose (5.5 mM) medium for a few passages (3–4 passages), before they were treated with high and normal glucose conditions to evaluate its influence on ROS levels. This alteration in glucose levels from high to normal or presumably low levels could have resulted in oxidative stress, as observed in the case of glycaemic variability (Wang et al., 2012; Ge et al., 2010; Sun et al., 2010; Ceriello et al., 2014; Klimontov et al., 2021). Furthermore, these findings are in agreement with our prior studies that showed high glucose treatments lowered glycolytic fluxes and glucose oxidation in diabetic retinas, thereby hyperglycemia may not raise ROS levels (Ola, 2021; Ola et al., 2006).
Next, we investigated the effect of hyperglycemia on ROS generation caused by the well-known oxidizing agents, diamide and CuSO4 in Muller cells, which served as a positive control for oxidative stress (Piccirillo et al., 2009; Kumar et al., 2016). As expected, both diamide and CuSO4 treatments to Muller cells resulted in a significant increase in ROS levels within 2 h. High glucose, on the other hand, significantly inhibited the formation of ROS caused by diamide and CuSO4. Furthermore, treatment of cells with glycolytic and citric acid cycle intermediates; pyruvate, and glutamate respectively, attenuated the increased ROS level due to low glucose conditions, and the level was comparable to that observed with high glucose treatments. This is possible because pyruvate has been shown to act as an antioxidant (Hinoi et al., 2006), and it protects the retina from glucose-induced oxidative stress (Frenzel et al., 2005; Hegde and Varma, 2005; Lee et al., 2013). In the Muller cells, glutamate treatments were also found to protect against low glucose-induced ROS. Some studies imply that glutamate maintains energy metabolism and also produces glutathione in the defense against oxidative stress, such as when glucose levels are low **(Bringmann et al., 2013). However, glutamine treatment significantly increased ROS levels in Muller cells, similar to what has been observed in astrocytes and microglia, presumably due to ammonia toxicity (Jayakumar et al., 2004; Svoboda and Kerschbaum, 2009). Treatment of cells with DON, a glutaminase inhibitor, could not prevent ROS from being produced by glutamine, negating the ammonia toxicity. However, conversely, it caused an increase in ROS production. It's possible that glutamine might generate oxidative stress in Muller cells by causing a mitochondrial malfunction and that DON can cause oxidative stress in Muller cells on its own (Bringmann et al., ; Hiramoto et al., 1996; Mukherjee et al., 2019).
Muller cells are known to protect the retina against a variety of metabolic stressors. Hyperglycemia-induced glial cells may release inflammatory cytokines to generate ROS (Krady et al., 2005; Tu et al., 2020; Zong et al., 2010). However, in this study, cytokines (IL-1β or TNF-α) exposure to Muller cells had no effect on ROS generation, which could be owing to the cytokines' short-term treatments, whereas LPS, an endotoxin, caused a significant increase in ROS generation. Surprisingly, the presence of high glucose in the Muller cells significantly reduced the degree of ROS level induced by LPS.
Furthermore, we systematically carried out a time course of high glucose treatments on isolated endothelial cells in generating ROS using BRECs as a model. In comparison to normal glucose exposure, we found no increase in high glucose-induced radical generation by BRECs during short-term (1–8 h) treatments. While long-term exposure (1, 3, and 5 days) to high glucose, on the other hand, resulted in a significant reduction in ROS levels as compared to normal glucose. These results are in agreement with the study of Busik et al., 2008, who reported that high glucose conditions did not increase endogenous ROS generation by human retinal endothelial cells (HRECs). These results are consistent with our prior findings that high glucose exposure did not increase ROS generation in the retina (Ola, 2021; Ola et al., 2006). Even pyruvate and glutamate exposure did not increase the ROS level, negating the possibility of hyperglycemic induced fluxes through glycolysis or citric acid cycle may exert extra pressure on mitochondria to produce excess ROS. Thus, we determined that high glucose levels were surprisingly protective against BRECs toxicity caused by low glucose levels. However, others have found high glucose-induced ROS generation by endothelial cells, which could be due to different experimental conditions or technical errors, as we have indicated earlier (Ola et al., 2006).
Conclusions: It is quite evident from these studies that high glucose per se did not appear to cause an increase in ROS levels in the Muller and endothelial cells; rather, high glucose seemed to have a protective role, and these cultured cells appear to be under oxidative stress under normal glucose conditions, similar to as reported with low or hypoglycemic conditions (Wang et al., 2012; Ge et al., 2010; Sun et al., 2010; Ceriello et al., 2014; Klimontov et al., 2021). However, it cannot be ruled out that the maximum high glucose exposure time used in this study (5 days), might still be a short exposure period to influence oxidative stress in these cultured retinal cells. Therefore, further studies utilizing various diabetes-induced dysregulated metabolites, in addition to glycemic variability with much longer exposure time, are needed to better elucidate the mechanism of ROS generation and their cellular sources in the retinal cells and diabetic retina, reflecting years of various metabolic insults and glycemic fluctuations to cause retinal damage in diabetic patients.
Acknowledgement
The author would like to thank Prof. Kathryn F. LaNoue, at Penn-State University, the USA for her valuable support in this study. In addition, the author would like to thank the funding support from King Abdul Aziz City for Science and Technology (KACST-NPST), grant number 13 MED1374.
Declaration of Competing Interest
The authors declare that they have no known competing financial interests or personal relationships that could have appeared to influence the work reported in this paper.
References
- Isolation and characterization of retinal endothelial cells. Methods Mol. Med.. 2003;89:365-374.
- [Google Scholar]
- Nondestructive measurement of retinal glucose transport and consumption in vivo using NMR spectroscopy. J. Neurochem.. 1995;64(5):2325-2331.
- [CrossRef] [Google Scholar]
- Bringmann A, Grosche A, Pannicke T, Reichenbach A. GABA and glutamate uptake and metabolism in retinal glial (Müller) cells. Front Endocrinol (Lausanne). 2013 17;4:48. doi: 10.3389/fendo.2013.00048. eCollection 2013.
- Biochemistry and molecular cell biology of diabetic complications. Nature. 2001;414(6865):813-820.
- [Google Scholar]
- Hyperglycemia-induced reactive oxygen species toxicity to endothelial cells is dependent on paracrine mediators. Diabetes. 2008;57:1952-1965.
- [Google Scholar]
- Hyperglycemia following recovery from hypoglycemia worsens endothelial damage and thrombosis activation in type 1 diabetes and in healthy controls. Nutr. Metab. Cardiovasc. Dis.. 2014;24:116-123.
- [Google Scholar]
- Hypoglycemia in type 1 diabetes mellitus: pathophysiology and prevention. Treat Endocrinol.. 2004;3(2):91-103.
- [Google Scholar]
- Critical role of TXNIP in oxidative stress, DNA damage and retinal pericyte apoptosis under high glucose: implications for diabetic retinopathy. Exp. Cell Res.. 2013;319:1001-1012.
- [Google Scholar]
- Pyruvate protects glucose-deprived Müller cells from nitric oxide-induced oxidative stress by radical scavenging. Glia. 2005;52(4):276-288.
- [Google Scholar]
- Effects of intermittent high glucose on oxidative stress in endothelial cells. Acta Diabetol.. 2010;47(Suppl. S1):97-103.
- [Google Scholar]
- Benfotiamine blocks three major pathways of hyperglycemic damage and prevents experimental diabetic retinopathy. Nat. Med.. 2003;9(3):294-299.
- [Google Scholar]
- VEGF activation of protein kinase C stimulates occludin phosphorylation and contributes to endothelial permeability. Invest. Ophthalmol. Vis. Sci.. 2006;47(11):5106-5115.
- [Google Scholar]
- Prevention of cataract by pyruvate in experimentally diabetic mice. Mol. Cell Biochem.. 2005;269(1–2):115-120.
- [CrossRef] [Google Scholar]
- A molecular mechanism of pyruvate protection against cytotoxicity of reactive oxygen species in osteoblasts. Mol. Pharmacol.. 2006;70(3):925-935. Epub 2006 Jun 9
- [CrossRef] [Google Scholar]
- DNA strand cleavage by tumor-inhibiting antibiotic 6-diazo-5-oxo-L-norleucine. Mutat. Res.. 1996;360(2):95-100.
- [Google Scholar]
- Diabetologia. 2009;52:952-961.
- The glutathione content of retinal Müller (glial) cells: effect of pathological conditions. Neurochem. Int.. 2000;36(4–5):461-469.
- [CrossRef] [Google Scholar]
- Curr. Eye Res.. 2006;31:947-953.
- Glutamine-induced free radical production in cultured astrocytes. GLIA. 2004;46(3):296-301.
- [Google Scholar]
- A1c variability and the risk of microvascular complications in type 1 diabetes: data from the DCCT. Diabetes Care. 2008;31:2198-2202.
- [Google Scholar]
- Minocycline reduces pro-inflammatory cytokine expression, microglial activation and capase-3 activation in a rodent model of diabetic retinopathy. Diabetes. 2005;54:1559-1565.
- [Google Scholar]
- Relationship of antioxidant and oxidative stress markers in different organs following copper toxicity in a rat model. Toxicol. Appl. Pharmacol.. 2016;293:37-43.
- [Google Scholar]
- Ethyl pyruvate inhibits retinal pathogenic neovascularization by downregulating HMGB1 expression. J. Diabetes Res.. 2013;2013:245271 Epub 2013 Nov 25
- [CrossRef] [Google Scholar]
- Accelerated death of retinal microvascular cells in human and experimental diabetic retinopathy. J. Clin. Invest.. 1996;97(12):2883-2890.
- [Google Scholar]
- Therapeutic benefit of combining calorie-restricted ketogenic diet and glutamine targeting in late-stage experimental glioblastoma. Commun Biol. 2019;2(1)
- [Google Scholar]
- Normalizing mitochondrial superoxide production blocks three pathways of hyperglycaemic damage. Nature. 2000;404(6779):787-790.
- [Google Scholar]
- Does Hyperglycemia cause oxidative stress in the diabetic rat retina? Cells. 2021;10:794.
- [CrossRef] [Google Scholar]
- Regulation of glutamate metabolism by hydrocortisone and branched chain keto acids in cultured rat retinal Müller cells (TR-MUL) Neurochem. Int.. 2011;59(5):656-663.
- [Google Scholar]
- Analysis of glucose metabolism in diabetic rat retinas. Am. J. Physiol. Endocrinol. Metab.. 2006;290(6):E1057-E1067.
- [Google Scholar]
- Molecular basis for increased lactate formation in the Müller glial cells of retina. Brain Res. Bull.. 2019;144:158-163.
- [Google Scholar]
- Recent advances in understanding the biochemical and molecular mechanism of diabetic retinopathy. J. Diabetes Complicat.. 2012;26:56-64.
- [Google Scholar]
- Gabapentin attenuates oxidative stress and apoptosis in the diabetic rat retina. Neurotox. Res.. 2019;36:81-90.
- [Google Scholar]
- Redox mechanisms involved in the selective activation of Nrf2-mediated resistance versus p53-dependent apoptosis in adenocarcinoma cells. J. Biol. Chem.. 2009;284:27721-27733.
- [Google Scholar]
- Progression of retinopathy with intensive versus conventional treatment in the Diabetes Control and Complications Trial. Diabetes Control and Complications Trial Research Group Ophthalmology. 1995 Apr;102(4):647-61. doi: 10.1016/s0161-6420(95)30973-6.
- Free Radic. Biol. Med.. 1999;26(11/12):1405-1407.
- Intermittent high glucose enhances cell proliferation and VEGF expression in retinal endothelial cells: The role of mitochondrial reactive oxygen species. Mol. Cell. Biochem.. 2010;343:27-35.
- [Google Scholar]
- L-Glutamine-induced apoptosis in microglia is mediated by mitochondrial dysfunction. Eur. J. Neurosci.. 2009;30(2):196-206.
- [CrossRef] [Google Scholar]
- The effect of intensive treatment of diabetes on the development and progression of long-term complications in insulin-dependent diabetes mellitus. N. Engl. J. Med.. 1993;329:977-986.
- [Google Scholar]
- Expression and regulation of Lcystine transporter, system xc-, in the newly developed rat retinal Müller cell line (TR-MUL) Glia. 2003;43:208-217.
- [Google Scholar]
- Melatonin inhibits Müller cell activation and pro-inflammatory cytokine production via upregulating the MEG3/miR-204/Sirt1 axis in experimental diabetic retinopathy. J Cell Physiol.. 2020;235(11):8724-8735.
- [Google Scholar]
- Intensive blood glucose control with sulphonylureas or insulin compared with conventional treatment and risk of complications in patients with type 2 diabetes (UKPDS 33) Lancet. 1998;352:837-853.
- [Google Scholar]
- Acute exposure to low glucose rapidly induces endothelial dysfunction and mitochondrial oxidative stress: role for AMP kinase. Arterioscler. Thromb. Vasc. Biol.. 2012;32(3):712-720.
- [Google Scholar]
- Coumestrol mitigates retinal cell inflammation, apoptosis, and oxidative stress in a rat model of diabetic retinopathy via activation of SIRT1. Aging (Albany NY). 2021;13(4):5342-5357.
- [Google Scholar]
- Global prevalence and major risk factors of diabetic retinopathy. Diabetes Care. 2012;35:556-564.
- [Google Scholar]
- Plasma metabolomic profiling of proliferative diabetic retinopathy. Nutr. Metab.. 2019;16:1-11.
- [Google Scholar]
- Hyperglycaemia-induced pro-inflammatory responses by retinal Müller glia are regulated by the receptor for advanced glycation end-products (RAGE) Diabetologia. 2010;53(12):2656-2666.
- [CrossRef] [Google Scholar]


