

Translate this page into:
Attenuation characteristics of coda wave in southern Arabian Shield
⁎Corresponding authors. sqaysi@ksu.edu.sa (Saleh Qaysi), aabdelfattah@ksu.edu.sa (Ali K. Abdelfattah)
-
Received: ,
Accepted: ,
This article was originally published by Elsevier and was migrated to Scientific Scholar after the change of Publisher.
Peer review under responsibility of King Saud University.
Abstract
This study aims to estimate regional attenuation of coda wave in the southernmost part of the Arabian Shield. The decay rate of the time-domain coda envelope was analyzed and used for the estimation of coda wave quality factor (Qc) following the single isotropic-scattering model. The dataset comprises of a total number of 78 earthquakes of magnitude ranges from 1.5 to 4.5 recorded by 13 seismic stations within a hypocentral distance of 11 to 205 km and a lapse time between 10 and 40 s. Seismograms from vertical and two horizontal components have been analyzed at central frequencies of 3, 6, 9, 12, 18, 21, and 24 Hz, obtaining frequency-dependent attenuation relationships in the form of Qc=(36 ± 10)f(0.98±0.1), Qc=(53 ± 13)f(0.89±0.1), Qc=(63 ± 12)f(0.86±0.1), and Qc=(75 ± 13)f(0.81±0.14) at lapse time 10, 20, 30, and 40 s respectively. The regional frequency-dependent relationship is approximated by the power law of for the study area. For 10 sec lapse time, the average Qc ranges between 124 ± 41 at 3 Hz and 890 ± 193 at 24 Hz, while for 40 sec lapse time it varies from 200 ± 51 at 3 Hz to 1077 ± 130 at 24 Hz, implying a continuous increase in Qc with lapse time as a consequence of subsurface homogeneity with depth. The relationship between Qc and frequency shows that the coda quality factor is frequency dependent. The low attenuation characteristics can be attributed to the geodynamic process that causes a thin lithosphere beneath the study area due to active rifting in the Red Sea combined with magma flow and migration into the Arabian Shield.
Keywords
Coda wave attenuation
Lapse time
Frequency dependent
Red Sea
Arabian Shield

1 Introduction
The calibration of path propagation effects based on attenuation characteristics of seismic waves is a useful indicator for investigating the acting geodynamic processes in the region. Moreover, it is one of the most important factors that should be used as an input parameter for predicting earthquake ground motions (Graizer and Kalkanf, 2016), determining seismic hazards (Novelo-Casanova et al., 2020), and estimating earthquake source parameters (Hiramatsu et al., 2000). The spatio-temporal characteristics of Coda wave attenuation have been documented for several regions characterized by different geodynamic processes. The attenuation of seismic wave is the decay of the seismic energy due to its propagation through the earth interior. This phenomenon generally occurred due to several mechanisms; geometrical spreading of the propagated wave that relates to hypocentral distance, scattering effect that attributes to the heterogeneity of the earth interior, and the anelastic propagation, that is caused by the conversion of seismic energy to heat energy. The Attenuation characteristics are expressed quantitatively by the inverse of a dimensionless quantity - quality factor (Qc) (Knopoff, 1964), which demonstrate the decay of seismic energy with time as it passes through the heterogeneous layers of the lithosphere. Therefore, the heterogeneity of the lithosphere and its physical characteristics can be inferred from Qc measurement.
Two models have been proposed to characterize Coda wave attenuation based on the decay of coda amplitude with increasing lapse time, which are the single scattering model of Sato (1977) and the back-scattering model of Aki and Chouet (1975). However, single scattering model of Sato (1977) is more suitable for near-hypocentral distances (Jin and Aki, 1989). It has been established that Qc changes with lapse time and frequency. Also, it has been confirmed that tectonically active regions are characterized by lesser Q0 (Q0 = Qc at 1 Hz) < 200 and higher n value (frequency dependent exponent) > 1. For tectonically stable area, Q0 > 200 and n < 1. The variation in the Qc for different lapse time is due to both depth and wave scattering (Masahiro, 1992).
The Arabian plate is surrounded by many active plate boundaries. The western boundary of the plate (Arabian Shield) is receding away from the African plate, leading to seafloor spreading in the Red Sea and Gulf of Aden. The southern part of the shield is situated in the region of the active complex triple junction along the Red Sea, Gulf of Aden, and the East Africa rift zone. Small earthquakes are frequent in this part of the planet earth. However, strong earthquakes which sometimes reaches a surface wave magnitude of 7.0 and a focal depth in the upper 20 km of the crust have taken place in the past (Al-Amri and Rodgers, 2013). A typical example of past occurrence is the 1941 event of 6.25 magnitude which took place in the Asir region (El-Isa and Shanti, 1989). On December 13, 1982, another disastrous 6.0 magnitude earthquake took place in northern Yemen, which claimed 1,900 lives, 280 settlements and material losses amounted to £135 million (Langer et al., 1987). The 1983 Gulf of Aqaba earthquake swarm is another event that caused panic in the affected cities (El-Isa et al., 1984). Studies that would lead to more understanding of the seismic hazard of the study area is essential due to the rapid infrastructural development and population growth. This study aims to quantify seismic attenuation characteristics of the subsurface structure in the southernmost part of the Arabian Shield in order to better understand the impact of structural heterogeneities of seismogenic zones that may export potential earthquake hazards into the region. We calibrate the frequency-dependent relationship that characterizes the attenuation of coda wave using the single isotropic-scattering model of Sato (1977).
1.1 Importance of the study
Considering the positive correlation between seismic hazard, population density, and urbanization, the Government of Saudi Arabia, private sectors, and the academics have been encouraged to dedicate more seismic hazard related studies to the Arabian Shield region as a result of obvious increasing seismicity, population growth and rapid infrastructural development. Specifically, the major cities along the Red Sea coast have witness rapid development in the recent past and this call for more detailed evaluation of seismic hazard in this region. However, the deterministic ground motion simulation of this area which is an integral part of seismic hazard analysis is poorly studied. It is worth mentioning that the frequency-dependence attenuation characteristics (Qc) is crucial for ground motion modelling.
2 Geology and seismotectonic settings
Geologically, Saudi Arabia is majorly classified into two – Arabian Shield and Arabian shelf. The Arabian Shield which is situated in the western part is where the vast deposit of crystalline Precambrian basement complex is located and makes up almost 30 % of the country. The Arabian shelf on the other hand is in the eastern part and constitutes mostly of sedimentary rocks that occupies nearly 60 % of the country (Brown et al., 1989). The Arabian Shield Precambrian rocks are mostly igneous and metamorphic, but bordered by extensive belt of sedimentary rocks, covered by Cenozoic basaltic lava fields, and intruded by granite (Brown et al., 1989). The age of the Arabian Shield rocks ranges between Neoproterozoic and early Cambrian (about 570 Ma to 900 Ma) (Kellogg and Beckmann, 1982, Brown et al., 1989). The shield consists of three major lithological units - intrusive, stratified, and volcanic rocks. The intrusive unit vary with respect to the formation and mineral composition (basic, acidic, and intermediate). The basic/ultrabasic plutonic rocks are widely spread throughout the shield. There is a high concentration of acidic intrusive rocks (younger than 760 Ma) in the northeast region. The south and west part are rich in intermediate plutonic rocks of age range between 660 Ma and 900 Ma. The stratified rocks in the shield include all layered rocks including metamorphic, sedimentary, and volcanoclastic rocks. Within these stratified rocks are volcanic intrusions which originate from lava flows (Al-Shanti and Mitchell, 1976). The study area (Fig. 1) is generally made up of Precambrian undifferentiated rock bounded by sedimentary and volcanic rocks of the Red Sea basin in the western part.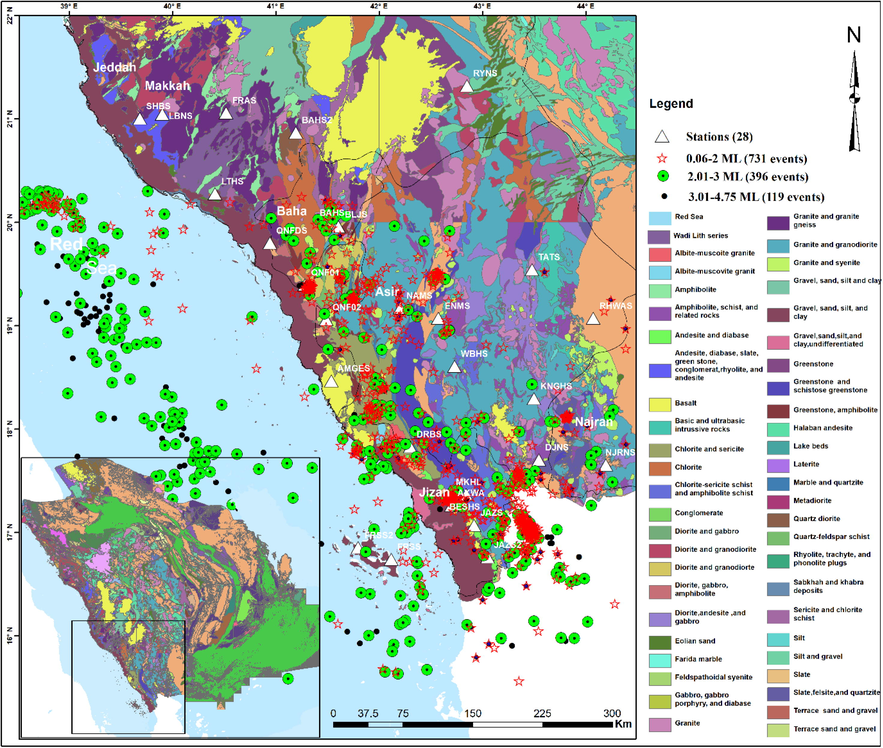
Geological map of the study area overlain by the seismic events between 2007 and 2014.
The Arabian plate is surrounded by many active plate boundaries which makes it active (Fig. 2). It is receding away from the African plate, leading to seafloor spreading in the Red Sea and Gulf of Aden, as well as the transform fault between the dead sea and the Gulf of Aqaba. The movement of the Arabian plate towards the Eurasian plate is responsible for the collision along the Bitlis and Zagros thrust system. Because of these active boundaries, earthquakes are frequent in this part of the planet earth which sometimes reaching a surface wave magnitude of 7.0 and a focal depth in the upper 20 km of the crust (Al-Amri and Rodgers, 2013). The study area (southernmost Arabia Shield) is located around the divergent plate boundary and have a contact with the Red Sea.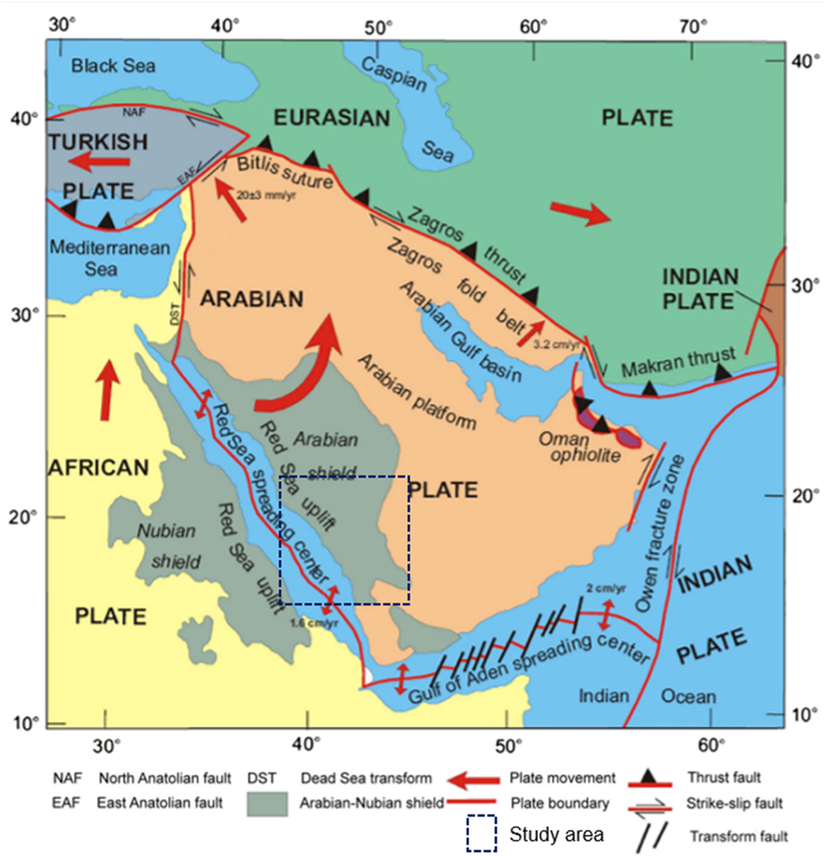
Tectonic map of the Arabian plate modified after Johnson (1998).
The rifting of the African craton, specifically, the breaking apart of the Mozambique belt probably led to the formation of the late Proterozoic basin in the north-eastern part of the African craton between 1200 and 950 Ma (Kazmin et al., 1978). The development of island arcs followed the rifting of the African craton in the geological history of the Arabian Shield. The 900 – 800 Ma well exposed sedimentary and magmatic rocks in the Hijaz, Asir and Midyan terranes have similar chemical and isotopic properties with the rocks of primitive Phanerozoic ensimatic island arcs suggesting products of oceanic accreation (Jackson and Ramsay, 1980). As the formation of the Arabian Shield progresses towards 640 Ma, five different terranes moved towards each other forming Arabian neocraton (Stoeser and Camp, 1985). About 715 Ma, there was a passive collision between Hijaz and Asir forming Umq suture. Another collision, which sutured Afif and Ar Rayn terranes, created northeast trending thrust faults and folds took place between 700 and 680 Ma (Shimron, 1984).
Collision related Intra-craton magmatism and tectonism that took place from 640 to 550 Ma is the fourth phase in the formation of the Arabian Shield. The period after collisional orogenesis was characterized by intra-plate tectonism for about 80 Ma, leading to the formation of ensialic volcanic rocks, deposition of molass, mafic to intermediate volcanic rock and formation of plutonic biotite granite and caldera in the northern half region of the shield (Calvez et al., 1982). <500 Ma ago, the neocraton shield experienced subsidence after undergone series of tectonic activities. Red Sea started rifting continuously since Tertiary, which makes the Arabian plate converging towards the Eurasian plate and diverging away from the African plate (Powers et al., 1966).
The seismicity of the study area (Fig. 1) is largely controlled by the tectonic configuration and activities at the plate boundaries such as the Red Sea rifting and other active boundaries surrounding the plate as well as volcanic activities. The Red Sea active rifting seems to be the most important tectonic feature at the western part of the plate regarding seismic activities. The high seismicity in the Red Sea shows the activeness of the rifting. The Red Sea started opening continuously since Tertiary, which initiated the convergence of the Arabian plate towards the Eurasian plate and its divergence away from the African plate (Powers et al., 1966).
3 Materials and methods
Coda Q was calculated from the analysis of decay rate of coda envelope following Sato (1977) single isotropic-scattering model:
Where Decay rate of coda envelope; r = source to receiver distance; f = frequency (Hz), t = lapse time from the origin time; A0(f) = source factor, a = t/ts (a > 1), and ts = arrival time of S-wave.
From equation (1),
From the logarithm of equation (1), we have:
Equation (3) represents the linear fit between the amplitude of the filtered enveloped seismogram and lapse time window. QC-1 at a particular central frequency can be calculated from the slope of the liner fit
as represented in equation (3), using this power function:
Where Q0 is the value of Qc at 1 Hz and n is the frequency-dependent variable, which is affected by media heterogeneities (Aki, 1981).
3.1 Data and analysis
The earthquake data used for the analysis in the present study was collected from Saudi Geological Survey (SGS) database. The data comprises of 252 events of smaller magnitude (1.5 < ML < 4.5) that was captured by 13 stations in the southern Arabian Shield which was reduced to 78 of 366 seismograms (supplementary data). Discarded events are those with poor signal/noise ratio, those whose tails are contaminated by multiple events, those with very high hypocentral distance and signals that are not consistent with the frequency bands of interest. The low-noise very broadband seismometer Trillium 120PA was used in all stations except two namely DJNS and NAMS, where broadband seismometer STS-2 was used. Station BESHS record the maximum high S/N events (52), while stations NJRN and DRBS record the least high S/N events (2). The hypocentral distance of the events ranges between 5.46 km and 205 km, focal depth from 2.47 to 20.47 km.
The seismograms were band pass filtered and enveloped at eight central frequencies 3 (2–4 Hz band), 6 (4–8 Hz band), 9 (6–12 Hz band), 12(8–16 Hz), 15 (10–20 Hz band), 18 (12–24 Hz band), 21 (14–28 Hz), 24 (16–32 Hz band) (Fig. 3 a-c). The linear fitting between the amplitude of the filtered enveloped seismogram and lapse time was carried out at four different lapse time windows (10, 20, 30, 40 s). The filtering and fitting process were done using a coda script which was ran in GSAC program (Herrmann et al., 2004). The coda windows used in this research is shown in Fig. 3a. The continuous increase in the frequency band was to cater for the ringing problem and the constant relative bandwidths is to ensure similar energy dissemination for each frequency band (Ottemöller et al., 2020). Similarly, continuous increment in the lapse time is to observe the changes in the Q with depth, since higher lapse time equate greater depth.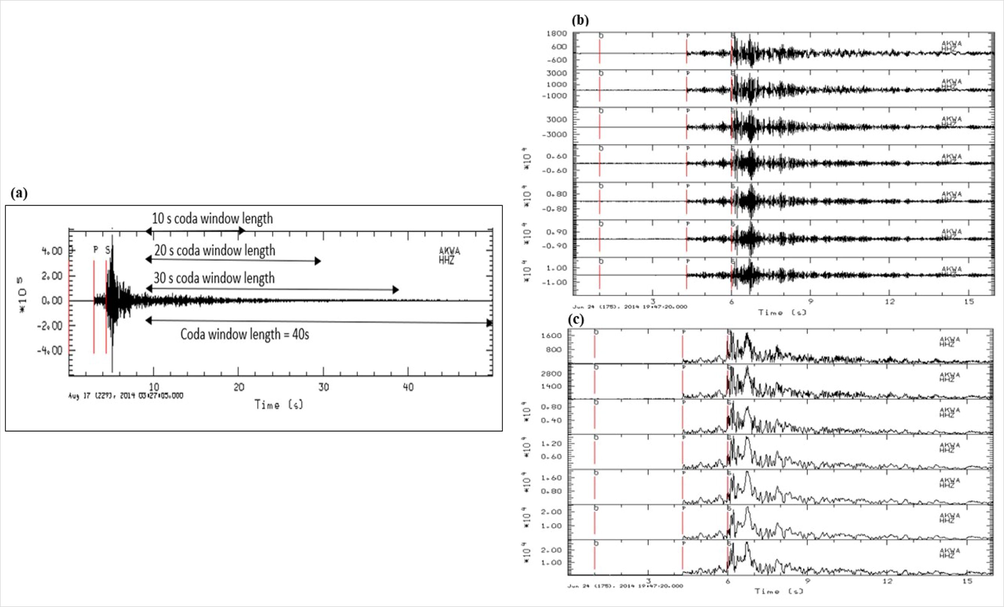
A sample (AKWA station) of seismogram showing (a) unfiltered seismogram and the coda window which span from 10 to 40 s at intervals of 10 s.(b) bandpass filtered and (c) enveloped bandpass filtered respectively at seven central frequencies.
4 Results and discussion
The coda attenuation characteristics of southern Arabian Shield has been investigated in the southernmost part of the Arabian Shield using a total number of 78 records from small-sized earthquakes of magnitudes ranges from 1.5 to 4.5 that recorded by 13 stations. The attenuation of Coda waves was computed following the single isotropic-scattering model of Sato (1977) for three component-seismograms (E-W, N—S, and Z). The analysis of seismograms was carried out using different constraints on lapse time and central frequency and depth. Moreover, the depth-dependent was also investigated.
The mean attenuation relationships for each analyzed seismic stations are presented in Table 1. Moreover, the mean attenuation relationships in the study area are
and
for lapse times of 10, 20, 30, and 40 s, respectively. The coincidence of increase (Qo) with decrease (n) may be attributed to the enhancement of depth-dependent homogeneity as a result of compaction increases, which reflects a good agreement with previous seismological findings that revealed different crustal features due to strengths and heterogeneities (Prada et al., 2021). Furthermore, the variation of Qc with lapse time may also be related to the variation of attenuation with depth indicating an increase of medium homogeneity with depth (Woodgold, 1994). In this study, the relationship between Qc and interval time and frequency reveals a direct proportionality, indicating a dependence on lapse time and frequency. For instance, at 10 sec lapse time, the average Qc ranges between 124 ± 41 at 3 Hz and 890 ± 193 at 24 Hz, while for 40 sec lapse time it varies from 200 ± 51 at 3 Hz to 1077 ± 130 at 24 Hz (Table 2). The variation of
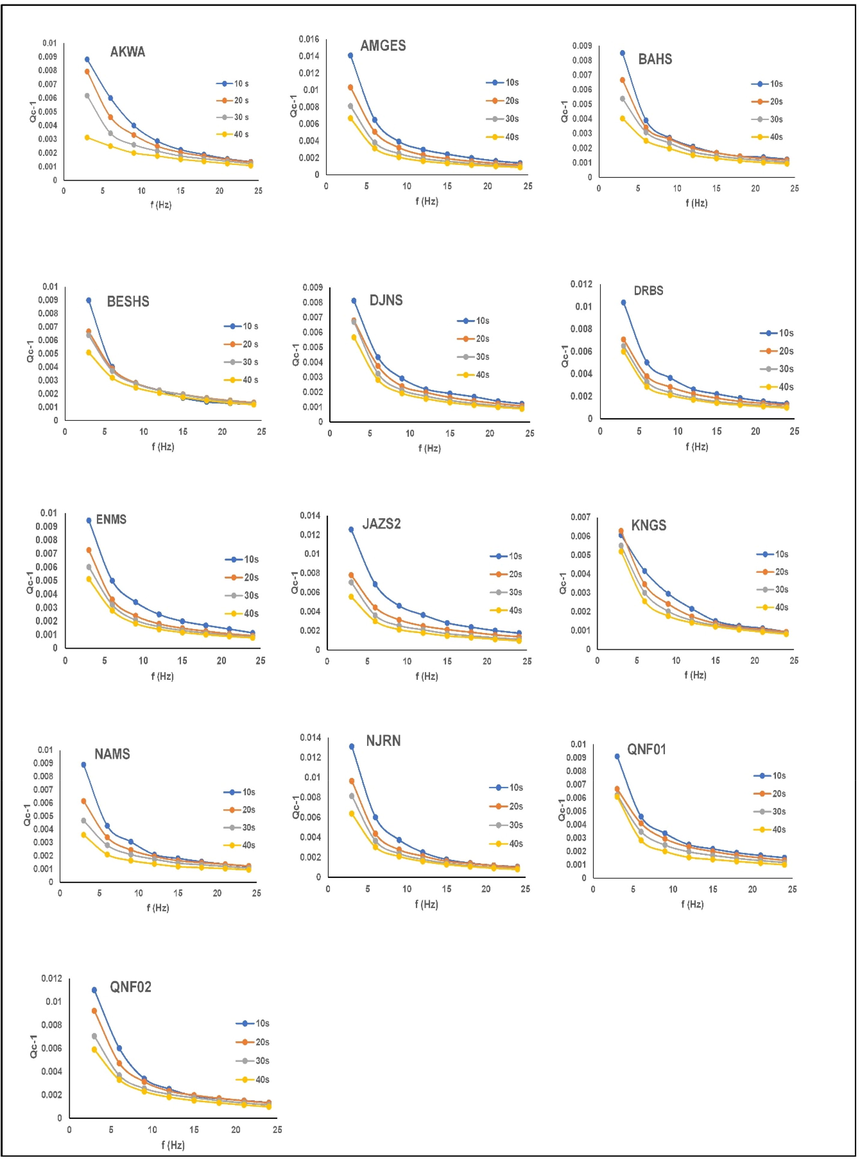
for various central frequencies with lapse time windows (10 s – 40 s) in each station is reported in Fig. 4, where the frequency dependency of Qc is again revealed, and the decrease in attenuation characteristics with increasing lapse time windows is clearly shown. The lapse time dependent is confirmed by the direct relationship between Qo and the lapsed time windows (Fig. 5). On the other hand, the inverse proportionality between the frequency coefficient (n) and the elapsed time windows was manifested (Fig. 5). Qo and n have opposite relationship with lapse time windows. While Qo increases with increasing lapse time, n decreases with increasing lapse time. This pattern between Qo, n and lapse time has been observed in different part of the world in the past studies. For example in Indian, (Singh et al., 2019), Turkey, (Sertcelik and Guleroglu, 2017), and Morocco, (Boulanouar et al., 2018).
Lapse time
10 s
20 s
30 s
40 s
stations
Qo
n
Qo
n
Qo
n
Qo
n
AKWA
36
0.9
47
0.9
71.94
0.76
85.11
0.51
AMGES
22
1.1
30.96
1.04
43.67
0.98
55.87
0.95
BAHS
46
0.9
62.89
0.83
77.52
0.80
92.38
0.71
BESHS
40.16
0.98
65.36
0.77
68.03
0.76
90.09
0.69
DJNS
46.51
0.90
56.50
0.88
57.80
0.92
71.43
0.88
DRBS
34.01
0.96
57.14
0.84
67.57
0.86
70.92
0.85
ENMS
33.67
1.00
47.39
0.98
58.82
0.95
71.43
0.91
JAZS2
27.32
0.95
51.81
0.82
56.50
0.87
74.63
0.82
KNGS
50.25
0.94
55.56
0.93
68.49
0.90
78.74
0.87
NAMS
40.49
0.96
72.99
0.77
80.50
0.70
95.77
0.63
NJRS
18.45
1.25
32.36
1.08
39.06
1.07
54.05
0.99
QNF01
45.66
0.85
62.89
0.77
68.49
0.80
72.99
0.84
QNF02
28.09
1.05
39.84
0.94
57.14
0.86
66.67
0.85
μ ± σ
36 ± 10
0.98 ± 0.1
53 ± 13
0.89 ± 0.1
63 ± 12
0.86 ± 0.1
75 ± 13
0.81 ± 0.14
Qc ± σ
f (Hz)
LTW = 10 s
LTW = 20 s
LTW = 30 s
LTW = 40 s
3
124 ± 41
136 ± 21
158 ± 25
200 ± 51
6
238 ± 72
251 ± 33
298 ± 28
360 ± 47
9
351 ± 101
362 ± 43
429 ± 43
500 ± 53
12
465 ± 113
468 ± 56
542 ± 63
621 ± 70
15
582 ± 133
568 ± 78
651 ± 81
736 ± 83
18
685 ± 151
660 ± 94
754 ± 97
842 ± 97
21
781 ± 169
755 ± 105
861 ± 115
956 ± 113
24
890 ± 193
856 ± 126
977 ± 133
1077 ± 130
Qc versus frequency bands at different lapse time for different stations.
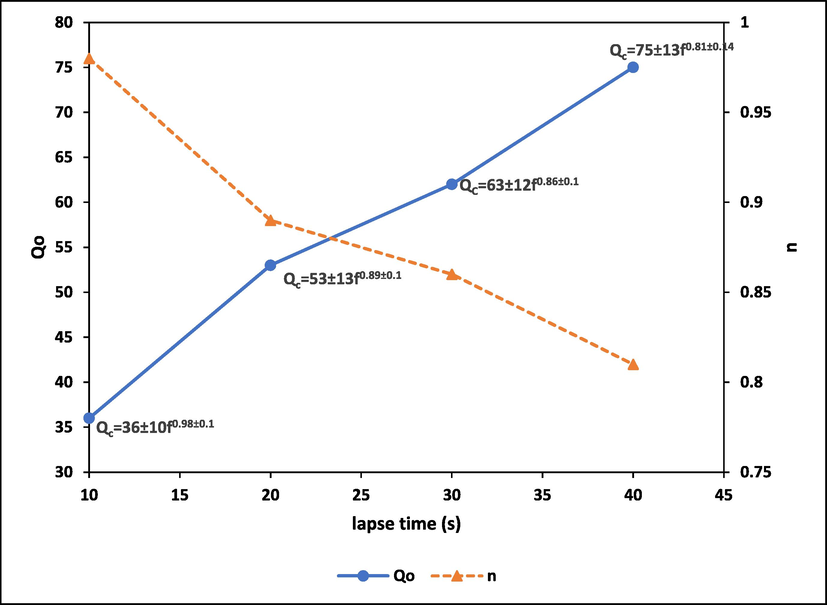
Relationship between Qo, n and lapse time windows in the study area.
The mechanism behind the Q, n and lapse time relationship could be due to the depth dependency of wave scattering, resulting in the decrease in frequency dependency of Q with depth, due to one of the Newtonian solids attenuation characteristics (n = 0) (Dasović et al., 2013). Another reason for this relationship is the improvement in the homogeneity of the earth interior with depth (Biswas and Singh, 2020), since density increases with depth, resulting in the low frequency and high amplitude which reduces apparent attenuation of the seismic wave (Dasović et al., 2013). The continuous increase in Qc with lapse time (Figs. 4 & 5, Table 1 and 2) indicates the improvement in the homogeneity of the earth interior with depth. The coda Q calculation using a single scattering model represents the average attenuation of the wave’s amplitude disseminated over the surface area of an ellipsoid whose foci are source and station. The ellipsoidal surface area can be estimated by the formula below (Sato, 1978, Pulli, 1984):
Where × and y are surface co-ordinates,
denote S-wave velocity which is ∼ 3.5 km/s for the study area (Rodgers et al., 1999), tc is the average lapse time which is equal to
(Havskov et al., 1989), tstart represent the inception time of the coda window which varies from station to station, tw is the coda window length which ranges from 10 to 40, and r is the hypocentral distance. The coda wave generated at a given lapse time (tc) reflects the depth (h) of the volume of ellipsoid which is expressed as:
where hav is the average focal depth. The ellipsoidal depth, Qo and n calculated for different stations at different lapse time windows are shown in Table 3. As expected, the depth varies directly proportional to Qo and lapse time, but inversely proportional to n, which signifies the improvement in the homogeneity of the earth interior with depth.
Stations
hav (Km)
tstart(s)
w (s)
tc (s)
R (Km)
(vtc/2)2 (Km/s2)
h (Km)
Qo
n
AKWA
7.77
9.21
10.00
14.21
13
618.54
31.83
35.46
0.93
20.00
19.21
1130.33
40.80
47.39
0.86
30.00
24.21
1795.25
49.67
71.94
0.76
40.00
29.21
2613.30
58.50
85.11
0.51
AMGES
27.15
46.93
10.00
51.93
150
8259.36
78.44
21.55
1.10
20.00
56.93
9926.34
92.71
30.96
1.04
30.00
61.93
11746.44
105.37
43.67
0.98
40.00
66.93
13719.67
117.10
55.87
0.95
BAHS
12.05
21.74
10.00
26.74
58
2189.77
48.75
46.30
0.93
20.00
31.74
3085.25
59.40
62.89
0.83
30.00
36.74
4133.85
69.42
77.52
0.80
40.00
41.74
5335.57
79.08
92.38
0.71
BESHS
8.07
11.46
10.00
16.46
20
829.22
35.06
40.16
0.98
20.00
21.46
1409.72
44.25
65.36
0.77
30.00
26.46
2143.34
53.26
68.03
0.76
40.00
31.46
3030.09
62.19
90.09
0.69
DJNS
7.92
25.11
10.00
30.11
69
2776.65
47.80
46.51
0.90
20.00
35.11
3775.36
58.81
56.50
0.88
30.00
40.11
4927.19
69.09
57.80
0.92
40.00
45.11
6232.15
78.96
71.43
0.88
DRBS
11.38
26.00
10.00
31.00
72
2943.06
51.89
34.01
0.96
20.00
36.00
3969.00
63.02
57.14
0.84
30.00
41.00
5148.06
73.40
67.57
0.83
40.00
46.00
6480.25
83.34
70.92
0.85
ENMS
9.40
44.60
10.00
49.60
139
7533.69
61.29
33.67
1.00
20.00
54.60
9129.19
74.88
47.39
0.98
30.00
59.60
10877.83
87.09
58.82
0.95
40.00
64.60
12779.58
98.50
71.43
0.91
JAZS2
10.18
27.27
10.00
32.27
76
3188.48
52.14
27.32
0.95
20.00
37.27
4253.21
63.34
51.81
0.82
30.00
42.27
5471.07
73.77
56.50
0.87
40.00
47.27
6842.05
83.76
74.63
0.82
KNGHS
12.30
38.72
10.00
43.72
120
5852.44
59.62
50.25
0.94
20.00
48.72
7267.78
72.75
55.56
0.93
30.00
53.72
8836.24
84.57
68.49
0.90
40.00
58.72
10557.82
95.63
78.74
0.87
NAMS
11.42
16.09
10.00
21.09
38
1361.65
43.19
40.49
0.96
20.00
26.09
2083.97
53.03
72.99
0.77
30.00
31.09
2959.41
62.48
80.50
0.70
40.00
36.09
3987.99
71.72
95.77
0.63
NJRNS
8.38
50.32
10.00
55.32
173
9372.18
51.39
18.45
1.25
20.00
60.32
11142.91
68.55
32.36
1.08
30.00
65.32
13066.78
82.84
39.06
1.07
40.00
70.32
15143.76
95.68
54.05
0.99
QNF01
12.57
14.57
10.00
19.57
33
1172.59
42.66
45.66
0.85
20.00
24.57
1848.41
52.33
62.89
0.77
30.00
29.57
2677.35
61.66
68.49
0.80
40.00
34.57
3659.42
70.81
72.99
0.84
QNF02
11.10
18.66
10.00
23.66
44
1714.37
46.27
28.09
1.05
20.00
28.66
2515.52
56.24
39.84
0.94
30.00
33.66
3469.80
65.80
57.14
0.86
40.00
38.66
4577.20
75.13
66.67
0.85
The coda attenuation estimated for the study area is generally low. This low value is associated with the tectonic configuration of this region, surrounded by plate boundaries and bordered by the active Red Sea, which keeps expanding. Another important contributing factor is the active Harrat volcanism. However, stations (BAHS, BESHS, NAMS, KNGS, QNF01) that are situated on the Precambrian undifferentiated basement complex rock have relatively high Qc, which may be due to relative stability and homogeneity of the hard rock terrain. On the other hand, relative lower Qc was recorded from the remaining stations. A significant lower Qc was obtained from AMGES which may be due to its closeness to the Harrat volcanic activities.
This study has shown the estimation of Qc at certain frequency and lapse time range. Likewise, other similar studies exist around the world. Generally, the value of Qc is influenced by several factors such as frequency range, lapse time range and coda starting point, event depth, event distance, method of coda Q calculation (modelling type) and type of wave considered (body or surface). Fig. 6 shows the values of some estimated coda Qc around the world from areas of varying geologic, seismic, and tectonic characteristics. The current study area with
is tectonically similar (active) to Abu Dabbab Egypt, the eastern Anatolia and northern Morocco. (Abdel-Fattah et al., 2008) Estimated
for Abu Dabbab in the eastern Egypt; Sertçelik (2012) and Aydın et al., (2020) got
and
respectively for the eastern Anatolia using single back-scattering model. Boulanouar et al., (2018) estimated
for the northern Morocco adopting single back-scattering model. However, the study of the eastern Indian shield by Singh et al. (2019) revealed that the region is tectonically moderate with
. Also, three tectonically stable regions were included in the comparison table. The study of Pulli (1984) which found
for the New England shows that the studied region is stable. Other stable areas included in the comparison table are Eastern USA and Indian shield with
by Singh et al., (2004).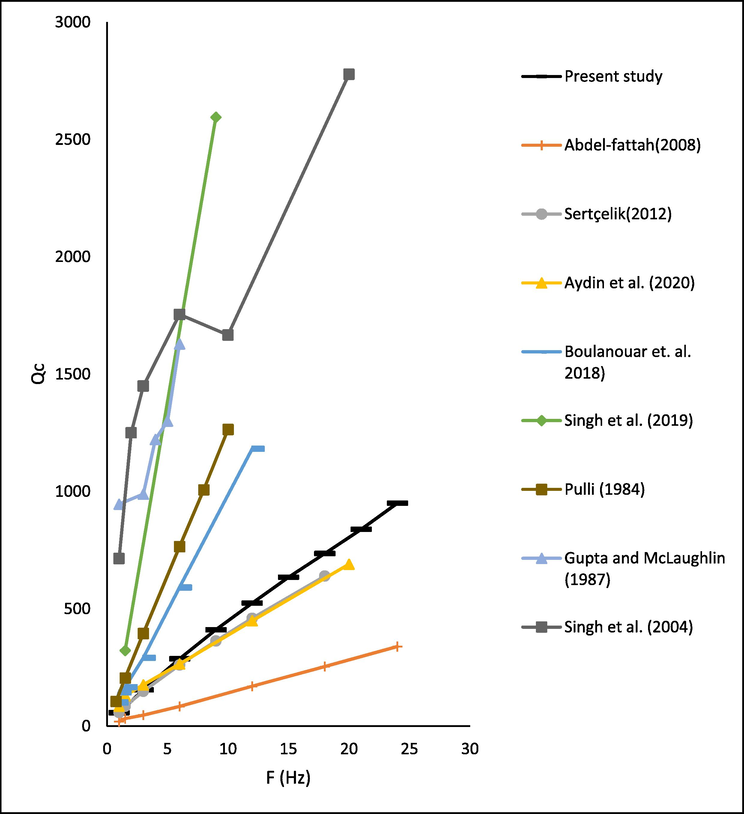
Coda Q vs frequency of this study in comparison to other selected regions of the world.
5 Conclusion
The Qc values for the southern Arabian Shield has been estimated using 78 local earthquakes, following single isotropic-scattering model. Lapse time and frequency dependencies were investigated for four lapse times (10, 20, 30, and 40 sec) and seven central frequencies (3, 6, 9, 12, 18, 21, and 24 Hz). The calculated average coda Q values of , , and were obtained at lapse times 10, 20, 30, and 40 sec respectively, while is the average for the study area, indicating a seismo-tectonically active zone. A direct proportional relationship was found between Qc and both frequency and lapse time, implying frequency and lapse time dependencies. The increase in Qo and decrease in the value of frequency-dependent variable ‘n’ with increasing lapse time windows shows improvement in the homogeneity of the earth interior with depth, associated with depth-dependency of coda wave attenuation. The findings in this study reveal that the medium has a low attenuation mechanism, which reflects the geodynamic process in the region due to active rifting in the Red Sea associated with magma flow and migration into the Arabian Shield causing a thin layer of lithosphere in the study area.
Acknowledgement
This work was supported by the Deanship of Scientific Research at King Saud University [grant number RG-1441-320].
Declaration of Competing Interest
The authors declare that they have no known competing financial interests or personal relationships that could have appeared to influence the work reported in this paper.
References
- Intrinsic and scattering attenuation in the crust of the Abu Dabbab area in the eastern desert of Egypt. Phys. Earth Planet. Inter.. 2008;168:103-112.
- [Google Scholar]
- Source and scattering effects on the spectra of small local earthquakes. Bull. Seismol. Soc. Am.. 1981;71:1687-1700.
- [Google Scholar]
- Origin of coda waves: source, attenuation, and scattering effects. J. Geophys. Res.. 1975;80:3322-3342.
- [Google Scholar]
- Improvement of seismicity parameters in the Arabian Shield and Platform using earthquake location and magnitude calibration. In: Lithosphere Dynamics and Sedimentary Basins: The Arabian Plate and Analogues. Berlin, Heidelberg: Springer; 2013. p. :281-293.
- [Google Scholar]
- Late Precambrian subduction and collision in the Al Amar—Idsas region, Arabian Shield, Kingdom of Saudi Arabia. Tectonophysics. 1976;30:T41-T47.
- [Google Scholar]
- Upper crustal Poisson’s ratio and coda-wave attenuation beneath Eastern Anatolia. Earthquake Eng. Eng. Vib.. 2020;19:335-347.
- [Google Scholar]
- An investigation of regional variations of coda wave attenuation in western Tibet. J. Seismol.. 2020;24:1235-1254.
- [Google Scholar]
- Estimation of coda wave attenuation in northern Morocco. Pure Appl. Geophys.. 2018;175:883-897.
- [Google Scholar]
- Brown, G.F., Schmidt, D.L., Huffman Jr, A.C., 1989. Geology of the Arabian Peninsula; shield area of western Saudi Arabia (No. 560–A). US Geological Survey.
- Geological evolution of western, central and eastern parts of the northern Precambrian Shield, Kingdom of Saudi Arabia. Precambrian Res.. 1982;16:A48-A.
- [Google Scholar]
- Coda-Q and its lapse time dependence analysis in the interaction zone of the Dinarides, the Alps and the Pannonian basin. Phys. Chem. Earth. Parts A/B/C. 2013;63:47-54.
- [Google Scholar]
- The Gulf of Aqaba earthquake swarm of 1983 January–April. Geophys. J. Int.. 1984;78:711-722.
- [Google Scholar]
- Seismicity and tectonics of the Red Sea and western Arabia. Geophys. J. Int.. 1989;97:449-457.
- [Google Scholar]
- Summary of the GK15 ground-motion prediction equation for horizontal PGA and 5% damped PSA from shallow crustal continental earthquakes. Bull. Seismol. Soc. Am.. 2016;106:687-707.
- [Google Scholar]
- GSAC-generic seismic application computing. In: AGU Fall Meeting Abstracts. 2004. p. :S21A-S.
- [Google Scholar]
- Temporal changes in coda Q− 1 and b value due to the static stress change associated with the 1995 Hyogo-ken Nanbu earthquake. J. Geophys. Res. Solid Earth. 2000;105:6141-6151.
- [Google Scholar]
- Time-space relationships of Upper Precambrian volcanic and sedimentary units in the Central Arabian Shield. J. Geol. Soc.. 1980;137:617-628.
- [Google Scholar]
- Spatial and temporal correlation between coda Q− 1 and seismicity and its physical mechanism. J. Geophys. Res. Solid Earth. 1989;94:14041-14059.
- [Google Scholar]
- Johnson, P.R. 1998. Tectonic map of Saudi Arabia and adjacent areas. Deputy Ministry for Mineral Resources Technical Report USGS-TR-98-3 (IR 948).
- The Ethiopian basement: stratigraphy and possible manner of evolution. Geol. Rundsch.. 1978;67:531-546.
- [Google Scholar]
- Paleomagnetic investigation of upper proterozoic rocks in the Eastern Arabian Shield, Kingdom of Saudi Arabia. Precambrian Res.. 1982;16
- [Google Scholar]
- Aftershocks of the 13 December 1982 North Yemen earthquake: Conjugate normal faulting in an extensional setting. Bull. Seismol. Soc. Am.. 1987;77:2038-2055.
- [Google Scholar]
- Seismic S-wave coda attenuation in the Dominican Republic as a tool for seismic hazard mitigation. Nat. Hazards. 2020;103:2849-2863.
- [Google Scholar]
- Seismological Observatory Software: 30 Yr of SEISAN. Seismol. Res. Lett.. 2020;91:1846-1852.
- [Google Scholar]
- The influence of depth-varying elastic properties of the upper plate on megathrust earthquake rupture dynamics and tsunamigenesis. J. Geophys. Res. Solid Earth 2021
- [CrossRef] [Google Scholar]
- Attenuation of coda waves in New England. Bull. Seismol. Soc. Am.. 1984;74:1149-1166.
- [Google Scholar]
- Lithospheric structure of the Arabian Shield and Platform from complete regional waveform modelling and surface wave group velocities. Geophys. J. Int.. 1999;138:871-878.
- [Google Scholar]
- Single isotropic scattering model including wave conversions simple theoretical model of the short period body wave propagation. J Phy Earth. 1977;25:163-176.
- [Google Scholar]
- Mean free path of S-waves under the Kanto district of Japan. J. Phys. Earth. 1978;26:185-198.
- [Google Scholar]
- Estimation of coda wave attenuation in the east Anatolia fault zone, Turkey. Pure Appl. Geophys.. 2012;169:1189-1204.
- [Google Scholar]
- Coda Wave Attenuation Characteristics for North Anatolian Fault Zone, Turkey. Open Geosci.. 2017;9:480-490.
- [Google Scholar]
- Evolution of the Kid Group, southeast Sinai Peninsula: Thrusts, melanges, and implications for accretionary tectonics during the late Proterozoic of the Arabian-Nubian Shield. Geology. 1984;12:242-247.
- [Google Scholar]
- Spatial variations of coda wave attenuation in Andaman-Nicobar subduction zone. Geophys. J. Int.. 2019;217:1515-1523.
- [Google Scholar]
- Pan-African microplate accretion of the Arabian Shield. Geol. Soc. Am. Bull.. 1985;96:817-826.
- [Google Scholar]
- Coda Q in the Charlevoix, Quebec, region: lapse-time dependence and spatial and temporal comparisons. Bull. Seismol. Soc. Am.. 1994;84:1123-1131.
- [Google Scholar]
Appendix A
Supplementary data
List of earthquake events used for coda Q computation. Supplementary data to this article can be found online at https://doi.org/10.1016/j.jksus.2022.102372.
Appendix A
Supplementary data
The following are the Supplementary data to this article:


