

Translate this page into:
Associations of dietary vitamin K and bone markers in adult Saudi females
⁎Corresponding author at: Chair for Biomarkers of Chronic Diseases Biochemistry Department College of Science, King Saud University, PO Box, 2455, Riyadh 11451, Saudi Arabia. ndaghri@ksu.edu.sa (Nasser M. Al-Daghri)
-
Received: ,
Accepted: ,
This article was originally published by Elsevier and was migrated to Scientific Scholar after the change of Publisher.
Peer review under responsibility of King Saud University.
Abstract
Objective
Osteoporosis is a bone disease characterized by bone mass reduction with a prevalence of approximately 34–48% in Saudi Arabia. Many risk factors can increase osteoporosis fracture, including low vitamin K levels. However, its exact role on bone mineral density (BMD) remains under investigated. This study aims to determine whether dietary vitamin K is associated with BMD, inflammation, undercarboxylated osteocalcin (ucOC) and other bone markers among adult Saudi females.
Methods
A total of 138 Saudi females aged 25 and above were recruited from different primary health care centers in Riyadh, Saudi Arabia, and were divided according to BMD status (N = 53 normal; N = 85 low BMD). Each participant completed a food frequency questionnaire. Anthropometrics were measured and serum 25(OH)D and vitamin K, bone markers (ucOC and CTX) and cytokines (IL-6, TNF-α) were assessed using assays.
Results
Low dietary vitamin K intakes were observed in both groups, ranging only 16–19 µg/day. A positive association was seen between dietary vitamin K and IL-6 in low BMD group and TNF-α in all participants. No significant association was seen between dietary vitamin K and BMD.
Conclusion
Dietary vitamin K is significantly associated with inflammation and not BMD in adult Saudi females. The alarmingly low dietary vitamin K intake is worth investigating further.
Keywords
Vitamin K
Bone markers
Undercarboxylated osteocalcin
BMD

1 Introduction:
Vitamin K is a fat-soluble vitamin with an essential role in blood coagulation. It is a group of molecules with a similar chemical structure, 2-methyl-1-4-naphthoquinone and differ side group R, its include phylloquinone (K1), menaquinones (K2), and menadione (K3) (Vermeer, 2012).
It has been postulated that skeletal health can be significantly improved by vitamin K through its role in cytokine modulation (De et al., 2006; Ginaldiet al., 2009) and as a compound in protein post-translational carboxylation, mostly with osteocalcin (Tie and Stafford, 2016). Vitamin K also protects bone matrix collagen by reducing the excretion of calcium and hydroxyproline (Hyp) in the urine. Moreover, it facilitates gamma-carboxylation by inhibiting bone resorption via osteoclasts and enhancing bone formation through osteoblasts (Palermo et al., 2017).
Most of the studies in Saudi Arabia have been focused on the effects of vitamin D and calcium in improving osteoporosis cases in our country. Despite the significant in vitro studies, limited information is available from the Middle East about the status of vitamin K levels and its effect on bone mineral density (BMD) and cytokines involved in bone turnover. The study of vitamin K intake and its possible correlation with bone mass among Saudis with osteoporosis could help design a nutrition-based strategy which could help decrease the occurrence and the severity of osteoporosis among the Saudi population. The main objective of the proposed study is to determine the relationship between dietary vitamin K consumption and bone turnover in Saudi pre- and post-menopausal women.
2 Material and methods
2.1 Subjects
The target population was Saudi adult females, aged 25–80 years old from different primary health care centers (PHCCs) (Albadi’ah and Alsuwaidi) and osteoporosis clinic in King Salman Hospital in Riyadh, Saudi Arabia. Written consent from all the patients was obtained. The study was approved by the Research Ethics of College of Applied Medical Science committee at King Saud University (KSU), Riyadh, Saudi Arabia. Subjects with congestive heart failure, nephrolithiasis, renal disease, bone or articular disease, uncontrolled hypertension and who take calcium, vitamin D, bisphosphonates, or calcitonin within the last 6 months of the study were excluded. Subjects who fulfilled the inclusion criteria were divided according to BMD score which is based on the classification of World Health Organization (WHO) (low BMD ≤ −1.0T-score in DEXA scan) and the control group (T-score > −1.0).
2.2 Questionnaire
A structured questionnaire was filled by the researcher through interviewing the participant to elicit the following information: socio-demographic data, medical history and sun exposure. The dietary information was obtained from each subject to assess their intake of different macro and micronutrient by using food frequency questionnaire (FFQ).
2.3 Anthropometrics and samples collection
Anthropometrics were measured and included height (cm), weight (kg) and blood pressure (mmHg) as performed previously (Al-Daghri et al., 2015a). Fasting (>10 h) blood samples (≈10 cc) were collected by a nurse and were transferred immediately to a non-heparinized tube for centrifugation. Collected serum was then transferred to a pre-labeled plain tube placed in ice (0–4 °C), and delivered to the Chair for Biomarkers of Chronic Diseases (CBCD) in KSU, Riyadh, Saudi Arabia, on the same day (Al-Daghri et al., 2015b). Serum samples were stored in a −20 °C freezer until analysis.
2.4 Biochemical measurements
Serum 25 (OH) D3 and β-crosslaps (β-CTx) were measured by Roche Cobas e411 using electrochemiluminescence immunoassay by a standard protocol provided along with the kit. (Roche Diagnostics, Mannheim, Germany). Serum ucOC was assayed using enzyme-linked immunosorbent assay (ELISA) as explained in another study (Saucedo et al., 2015). Serum level of vitamin K was measured by ultra-performance liquid chromatography (UPLC) connected with fluorescence detection using vitamin K1 and K2 analytical standards purchased from Sigma Aldrich. Chromatography was performed by isocratic reverse phase separation (A:B) (90:10 v/v) on a C18 column (Acquity UPLC BEH C18, 1.7 µm, 2.1 × 100 mm column, Part No. 188002352) and a post reduction column using 0.2 g Zinc metal. The mobile phase comprised of A; 1.37 g zinc chloride (ZnCl2), 0.41 g sodium acetate (C2H3NaO2) and 400 ml acetic acid in 1 L methanol and B; dichloromethane. Vitamin K derivatives were detected at a wavelength of 247 nm for excitation and 430 nm for emission.
2.5 Statistical analysis
Data analysis was done using the SPSS 22.0 (SPSS Inc., Chicago, Illinois, USA). Data was presented as a mean ± standard deviation for continuous normal variables while median and the interquartile range were used to present continuous non-normal variables.
Frequencies and percentages were used to present categorical variables. Independent Student T-test was used to compare means between groups of normally distributed data while Mann-Whitney U Test was used for non-normal data. Analysis of covariance and partial correlation analysis were used to control for the possible effects of age and BMI. All non-normal variables were transformed prior to parametric testing. A P value of ≤0.05 was considered significant.
3 Results
Table 1 shows subjects’ demographic data. The mean age of women in the control group was 48.6 ± 6.4, and the mean age of the low BMD group was 55.6 ± 8.2. Sixty-two percent of the premenopausal subjects were within the normal group while 78.1% postmenopausal subjects were in the low BMD group. Almost 40% of the subjects in the low BMD group earned less than SAR 3000, while 35.8% of the normal group earned more than SAR 10000. Majority of the subjects in both groups didn’t expose themselves to the sun. The anthropometric data is also shown in Table 1 for both groups. The result shows a significant difference in all parameters between normal and low BMD subjects. The BMI mean shows that both groups were obese. ucOC levels were similar in both the groups, but osteocalcin was more elevated in the low BMD group. Note: Data presented as mean ± SD and median (IQR) for Gaussian and non-Gaussian variables respectively; while frequencies and percentages are presented for categorical variables; p-values ≤0.05 considered statistically significant.
Parameters
Normal
Low BMD
P-values
N
53 (38.4)
85 (61.6)
–
Age (years)
48.6 ± 6.4
55.6 ± 8.2
0.000
Height (m)
1.6 ± 0.1
1.5 ± 0.1
0.009
Weight (kg)
81.5 ± 13.6
71.9 ± 14.9
0.000
BMI (kg/m2)
33.7 ± 5.5
30.7 ± 5.7
0.003
Systolic mmHg
120.0 ± 18.2
130.4 ± 17.0
0.001
Diastolic mmHg
75.8 ± 10.0
79.9 ± 9.6
0.001
BMD Femoral Neck T-score#
0.8 (1.2)
−0.6 (1.2)
0.000
BMD Lumbar T-score#
0.2 (1.2)
−2.2 (1.2)
0.000
UCOC (ng/mL)
1.1 (1.0)
1.2 (0.9)
0.314
OC (ng/mL)
6.5 (7.2)
7.6 (14.5)
0.129
Marital Status
0.164
Married
44 (41.1%)
63 (58.9%)
Widow/er
5 (20.8%)
19 (79.2%)
Divorce
4 (57.1%)
3 (42.9%)
Monthly income (SAR)
0.001
1000–3000
10 (23.3%)
33 (76.7%)
3000–5999
9 (32.1%)
19 (67.9%)
6000–10,000
15 (60.0%)
10 (40.0%)
>10,000
19 (45.2%)
23 (54.8%)
Sun Exposure
0.388
No
30 (39.0%)
47 (61.0%)
Yes
23 (37.7%)
38 (62.3%)
The intake of chosen nutrients according to FFQ in both groups (normal and low BMD) compared to reference values is show in Table 2. In both groups the dietary intake of vitamin D was lower in almost 80% of subjects in relevance to the respective reference values, while its 100% low in both groups for vitamin K and calcium. With no difference in vitamin K consumption between normal BMD and low BMD group. In general, all nutrient intakes were low in both groups except fat intake which was 49% more than the reference in both groups. Note: Data represented in terms of Mean ± SE for Gaussian variables while Median (IQR) were presented for non-Gaussian Variables, # represents non-Gaussian variables, SE. Standard error, AMDR – acceptable macronutrient distribution range. EAR: Estimated Average Requirement; RDA: Recommended Dietary Allowance; IU: International Unit; AI: Adequate Intake; * indicates p-values adjusted for age and BMI.
Parameters
AMDR, EAR or AI
Normal (N = 53)
Low BMD (N = 85)
P-values
P-values*
Mean ± SE
<Ref (%)
>Ref (%)
Mean ± SE
<Ref (%)
>Ref (%)
Energy (Kcal)
–
1110.5 ± 33.8
–
–
1103.8 ± 28.1
–
–
0.882
0.394
Carbohydrate (%)
45–65
35.7 ± 1.5
81.1
0
37.5 ± 1.2
76.5%
1.2
0.371
0.853
Protein (%)
10–35
15.8 ± 0.7
13.2
0
15.5 ± 0.5
12.9%
0
0.746
0.394
Fat (%)
20–35
33.6 ± 1.5
11.3
49.1
34.4 ± 1.0
4.7%
49.4
0.643
0.711
Vitamin D (IU) #
600
255.0 (274.7)
86.8
13.2
287.5 (373.1)
81.2%
18.8
0.227
0.444
Calcium (mg) #
800
132.8 (212.7)
100
0
239.7 (274.9)
100.0%
0
0.175
0.564
Phosphorus (mg) #
580
129.6 (202.9)
98.1
1.9
187.3 (217.4)
97.6%
2.4
0.248
0.897
Vitamin K (μg) #
90
16.1 (13.9)
100
0
19.2 (16.6)
100.0%
0
0.311
0.763
Fig. 1 shows a significant correlation with square root (sqrt) TNF-α and log dietary vitamin K in all subjects. There is a positive correlation between sqrt TNF-α and dietary vitamin K after adjusting for age and BMI as indicated by increasing trend line (r = 0.20, P < 0.048). Fig. 2 also shows significant positive correlation between sqrt IL-6 and log dietary vitamin K in subjects with low BMD after adjusting for age and BMI (r = 0.27, P = 0.034).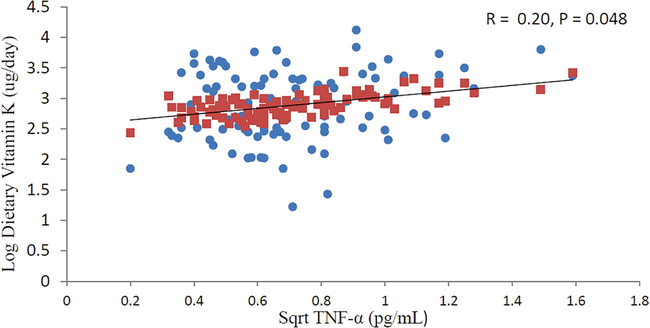
Relationship between sqrt TNF-α and log dietary vitamin K in all subjects after adjusting for age and BMI.
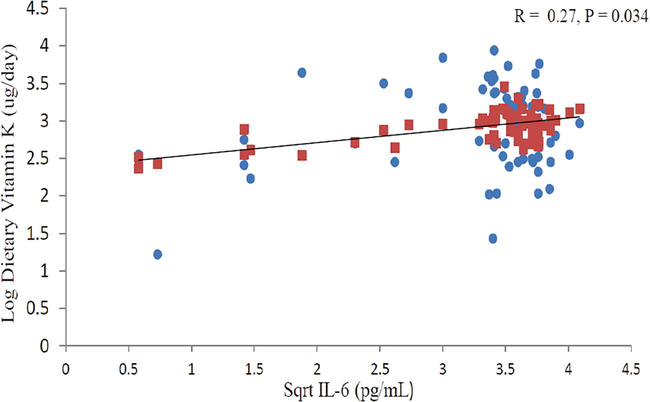
Relationship between sqrt IL-6 and log dietary vitamin K in Low BMD group after adjusting for age and BMI.
4 Discussion
This study observed whether dietary vitamin K intake is associated with BMD and bone markers. It is the first of its kind in the Middle East. In this study, the intake of vitamin K among Saudi women is much lower than the recommended AI references (90 μg/day) (Shearer et al., 2012), which confirms findings from a previous report in Saudi population (Al-Daghri et al., 2013). The dietary consumption of vitamin K is different in diverse populations due to different dietary patterns. In Saudi Arabia, vitamins K intake is low maybe due to a comparatively unhealthier diet through the intake of low milk and dairy products, vegetables and fruits. This has been documented in both young and adult Saudi population (Al-Hazzaa et al., 2011; Alsunni and Badar, 2015).
Undercarboxylated osteocalcin (ucOC) is another indicator of dietary vitamin K status. The relation between dietary vitamin K consumption with serum ucOC was studied. There was no significant correlation between vitamin K intake and serum ucOC. Similar outcomes were also reported by Booth et al. and Kuwabara et al. that circulating levels of serum ucOC did not reflect vitamin K intake (Booth et al., 2003b; Kuwabara et al., 2011). Our result was in contrast to other studies which show a significant inverse relation between ucOC and vitamin K intake (McKeown et al., 2002; Yamauchi et al., 2010). These differences could be due to the use of ucOC percentage or the high amount of vitamin K intake as it shown in a study by Kuwabara et al. which observed that PIVKAII and ucOC/OC was significantly associated with vitamin K intake, while no relation were found between ucOC and dietary vitamin K (Kuwabara et al., 2011).
Conversion of ucOC to mature OC depends on vitamin K. This suggests ucOC serum level may be an indirect indicator for vitamin K status. The lack of a significant relationship between dietary intakes of vitamin K and serum vitamin K concentrations supports the finding of other studies (Kalkwarf et al., 2004; Schurgers et al., 1999). There is a contrast to other studies who found a significant association between plasma vitamin K concentrations and total vitamin K intake as estimated by the FFQ (Booth et al., 1995; Booth et al., 1997; McKeown et al., 2002) or after vitamin K supplementation (Booth et al., 2008; Cheung et al., 2008). A possible explanation for the lack of correlation between vitamin K intake and serum vitamin K is that intake was calculated from FFQ data which reflects intake from one or two days past (Schurgers et al., 1999) while phylloquinone is cleared within 1–3 day after ingestion (Booth et al., 1999; Olson et al., 2002; Sokoll et al., 1997). Also the use of fasting serum vitamin K sample limits its value as an indicator of vitamin K status due to the wide daily variation in vitamin K intake that may not reflect habitual dietary intake (Booth et al., 1995).
In this cross-sectional study, BMI was significantly low in women with low BMD than controls which is in agreement with other studies (Al-Daghri et al., 2017; Palermo et al., 2017). Also, there was no significant correlation between BMD in lumbar bone and vitamin K intake in both groups. In a population-based prospective study in peri-menopausal Danish women, vitamin K1 intake’s role on BMD or fracture risk was not seen (Rejnmark et al., 2006). Other studies found that reduced vitamin K intake is related with low BMD (Booth et al., 2003a; Bullo et al., 2011). Our results showed that women with low BMD had low vitamin K level than women with normal BMD but wasn’t significant. This result was similar to Kanai et al. study (Kanai et al., 1997). In our study, osteocalcin was higher in the low BMD group than the normal group which is similar to another study (Singh et al., 2015; Zupan et al., 2012). The production of osteocalcin by osteoblast in bone formation and its mechanism is still not clear (Al-Daghri et al., 2017). In addition, no significant correlation was found between dietary vitamin K and osteocalcin. Vitamin K supplementation’s effect on osteocalcin is not consistent. These results could be because osteocalcin synthesis does not rely solely on vitamin K consumption but more so in hormones, for example 1, 25-dihydroxyvitamin D3 and glucocorticoids (Gundberg et al., 2012). Also, we didn’t find a significant association between CTX as a resorption marker and dietary vitamin K.
There some limitations in this study. First, the sample size was adequate but small and this may limit generalizability of findings. Second, the study was of short duration. Despite these limitations, the findings are robust and is the first to report the dietary vitamin K status in relation to bone markers among Arab women.
5 Conclusion
In summary, dietary vitamin K along with vitamin D and calcium intake were way below the recommended dietary levels in a group of adult Saudi females. No significant correlation was seen between vitamin K intake and BMD among the women. While low levels of vitamin K intake are not associated with bone markers (ucOC and CTX), it was significantly associated with inflammatory markers, suggesting that its effects in BMD maybe indirectly due to its association with inflammation.
Acknowledgements
The authors highly acknowledge the participation of the individuals in their study and they are also highly grateful to the Chair for Biomarkers of Chronic Diseases, Biochemistry Department, College of Science, King Saud University, and Deanship of Scientific Research in King Saud University, Riyadh, KSA for the technical support.
Declaration of Competing Interest
The authors declare that they have no known competing financial interests or personal relationships that could have appeared to influence the work reported in this paper.
References
- Selected dietary nutrients and the prevalence of metabolic syndrome in adult males and females in Saudi Arabia: a pilot study. Nutrients. 2013;5:4587-4604.
- [Google Scholar]
- Sensitivity of various adiposity indices in identifying cardiometabolic diseases in Arab adults. Cardiovasc. Diabetol.. 2015;14:101.
- [Google Scholar]
- Habitual physical activity is associated with circulating irisin in healthy controls but not in subjects with diabetes mellitus type 2. Eur. J. Clin. Invest.. 2015;45:775-781.
- [Google Scholar]
- Al-Daghri, N.M., Aziz, I., Yakout, S., Aljohani, N.J., Al-Saleh, Y., Amer, O.E. et al., 2017. Inflammation as a contributing factor among postmenopausal Saudi women with osteoporosis. Medicine, 96.
- Physical activity, sedentary behaviors and dietary habits among Saudi adolescents relative to age, gender and region. Int. J. Behav. Nutr. Phys. Activity. 2011;8:140.
- [Google Scholar]
- Fruit and vegetable consumption and its determinants among Saudi university students. J. Taibah Univ. Med. Sci.. 2015;10:201-207.
- [Google Scholar]
- Assessment of dietary phylloquinone intake and vitamin K status in postmenopausal women. Eur. J. Clin. Nutr.. 1995;49:832-841.
- [Google Scholar]
- Relationships between dietary intakes and fasting plasma concentrations of fat-soluble vitamins in humans. J. Nutr.. 1997;127:587-592.
- [Google Scholar]
- Response of vitamin K status to different intakes and sources of phylloquinone-rich foods: comparison of younger and older adults. Am. J. Clin. Nutr.. 1999;70:368-377.
- [Google Scholar]
- Vitamin K intake and bone mineral density in women and men. Am. J. Clin. Nutr.. 2003;77:512-516.
- [Google Scholar]
- Dietary phylloquinone depletion and repletion in older women. J. Nutr.. 2003;133:2565-2569.
- [Google Scholar]
- Effect of vitamin K supplementation on bone loss in elderly men and women. J. Clin. Endocrinol. Metab.. 2008;93:1217-1223.
- [Google Scholar]
- Dietary vitamin K intake is associated with bone quantitative ultrasound measurements but not with bone peripheral biochemical markers in elderly men and women. Bone. 2011;48:1313-1318.
- [Google Scholar]
- Vitamin K supplementation in postmenopausal women with osteopenia (ECKO trial): a randomized controlled trial. PLoS Med.. 2008;5:e196
- [Google Scholar]
- Senile osteoporosis: is it an immune-mediated disease? Inflamm. Res.. 2006;55:399-404.
- [Google Scholar]
- Osteoporosis, inflammation and ageing. In: Fulop Tamas, Franceschi Claudio, Hirokawa Katsuiku, Pawelec Graham, eds. Handbook on Immunosenescence. Netherlands: Springer; 2009. p. :1329-1352.
- [Google Scholar]
- Vitamin K-dependent carboxylation of osteocalcin: friend or foe? Adv. Nutr.. 2012;3:149-157.
- [Google Scholar]
- Vitamin K, bone turnover, and bone mass in girls. Am. J. Clin. Nutr.. 2004;80:1075-1080.
- [Google Scholar]
- Serum vitamin K level and bone mineral density in post-menopausal women. Int. J. Gynecol. Obstet.. 1997;56:25-30.
- [Google Scholar]
- Bone is more susceptible to vitamin K deficiency than liver in the institutionalized elderly. Asia Pacific J. Clin. Nutr.. 2011;20:50-55.
- [Google Scholar]
- Dietary and nondietary determinants of vitamin K biochemical measures in men and women. J. Nutr.. 2002;132:1329-1334.
- [Google Scholar]
- Total body phylloquinone and its turnover in human subjects at two levels of vitamin K intake. Br. J. Nutr.. 2002;87:543-553.
- [Google Scholar]
- No effect of vitamin K1 intake on bone mineral density and fracture risk in perimenopausal women. Osteoporos. Int.. 2006;17:1122-1132.
- [Google Scholar]
- Osteocalcin, under-carboxylated osteocalcin and osteopontin are not associated with gestational diabetes mellitus but are inversely associated with leptin in non-diabetic women. J. Endocrinol. Invest.. 2015;38:519-526.
- [Google Scholar]
- Nutritional intake of vitamins K1 (Phylloquinone) and K2 (Menaquinone) in The Netherlands. J. Nutr. Environ. Med.. 1999;9:115-122.
- [Google Scholar]
- Vitamin K nutrition, metabolism, and requirements: current concepts and future research. Adv. Nutr.. 2012;3:182-195.
- [Google Scholar]
- Serum osteocalcin as a diagnostic biomarker for primary osteoporosis in women. J. Clin. Diag. Res.. 2015;9:RC04-RC07.
- [Google Scholar]
- Changes in serum osteocalcin, plasma phylloquinone, and urinary gamma-carboxyglutamic acid in response to altered intakes of dietary phylloquinone in human subjects. Am. J. Clin. Nutr.. 1997;65:779-784.
- [Google Scholar]
- Structural and functional insights into enzymes of the vitamin K cycle. J. Thromb. Haemost.. 2016;14:236-247.
- [Google Scholar]
- Vitamin K: the effect on health beyond coagulation – an overview. Food Nutr. Res.. 2012;56:5329.
- [Google Scholar]
- Relationships between undercarboxylated osteocalcin and vitamin K intakes, bone turnover, and bone mineral density in healthy women. Clin. Nutr.. 2010;29:761-765.
- [Google Scholar]
- The relationship between osteoclastogenic and anti-osteoclastogenic pro-inflammatory cytokines differs in human osteoporotic and osteoarthritic bone tissues. J. Biomed. Sci.. 2012;19:28.
- [Google Scholar]


