

Translate this page into:
Association between SORT1 gene polymorphism studies in obesity population
⁎Corresponding author. mfbadr@ksu.edu.sa (Mohamed Farouk Elsadek),
-
Received: ,
Accepted: ,
This article was originally published by Elsevier and was migrated to Scientific Scholar after the change of Publisher.
Peer review under responsibility of King Saud University.
Abstract
Obesity is defined the accumulation of extra fat deposited in the body. Based on body mass index (BMI), obesity is classified in children and adults of both men and women. Sortilin 1 (SORT1) gene has been documented with the relationship of low-density lipoprotein cholesterol (LDLC) and coronary artery disease. However, the relation between obesity and LDLC is well documented. The aim of this study was to investigate the relation between rs464218 SNP genotype assay in SORT1 gene among obesity subjects in the Saudi population. One hundred forty samples were categorized as 80 obesity and 60 control subjects. DNA was extracted to perform PCR for rs464218 SNP genotype assay using restriction enzyme. Based on clinical and genotype data, statistical analysis will be performed. The clinical data documents weight, Body Mass Index, High Density Lipoprotein Cholesterol, LDLC and Triglycerides were associated in obese group (p < 0.05). Hardy-Weinberg Equilibrium analysis revealed the deviation with rs464218 SNP genotype assay. None of the genotypes, dominant model and allelic frequencies showed the significant association among obese groups (p > 0.05). Anova analysis revealed the positive association among weight, BMI and LDLC among obese groups (p < 0.05). In conclusion, the rs464218 SNP genotype assay of SORT1 gene doesn’t showed the genotype association but Anova analysis revealed the positive connection between obesity and LDLC. Future studies are required with large number of sample size.
Keywords
Obesity
SORT1
LDLC
CAD and SNP genotype assay

1 Introduction
Obesity is a simple and complex condition that develops as a result of our sedentary lifestyle patterns. According to the World Health Organization (WHO), 13% of the global population is obese, with men accounting for 11% and women contributing for 15% (Althumiri et al., 2021). Aside from diabetes and cardiovascular disease (CVD), COVID 19 was added as a new risk factor for obesity, according to WHO. Overweight and obesity-related problems claim the lives of 2.8 million people each year (Pugliese et al., 2022). Over the past few decades, the worldwide obesity rate has nearly tripled, with an estimated 1.9 billion persons classified as overweight or obese. Metabolic disorder has a greater correlation with visceral than subcutaneous adipose tissue in humans. Obesity can diagnose using Body Mass Index (BMI). Body fat mass can be exaggerated in those who have a lot of muscle mass, even if BMI has an association. Furthermore, BMI was discovered because not all obese persons suffer from metabolic problems that are typically linked to obesity. Both environmental and genetic factors plays a major role in development of obesity as well as developing obesity into further complications, which can leads to diabetes, CVD and other chronic metabolic diseases (Alharbi et al., 2021).
There have been numerous variations identified in complex and multifactorial human disorders by meta-analyses, Genome-wide association studies (GWAS), single nucleotide polymorphisms (SNPs), exome sequencing, next generation sequencing, and cohort studies. Obesity is known to be one of inherited complex chronic and metabolic disorder, which describes the disease with the scale of BMI (Alshammary and Khan, 2021). Understanding the pathophysiology of disease and enhancing diagnosis, prevention, and treatment are critical aspects of genetic studies (Khan et al., 2015). GWAS have revealed the existence of the Sortilin (SORT1) gene, which can be found on the chromosome 1p13.3 area. In both neurons and non-neuronal cells, SORT1 is produced, and it encodes for the sorting protein that plays a crucial role in lipid uptake. Functional variations at this locus may be located inside the SORT1 gene. The risk allele was related with lower SORT1 expression, an increase in plasma LDL-C content, and an increased risk of coronary artery disease (Alharbi et al., 2018). There have been limited studies carried out with SORT1 gene in obesity. This study was aimed to investigate the role of SORT1 gene (rs464218) in obesity subjects in the Saudi population.
2 Materials and methods
The present study included 80 obesity cases and 50 controls attended the King Saud University (KSU) Hospital in the Riyadh city of Saudi Arabia. In this study, a total of 285 subjects were enrolled and based on inclusion and exclusion criteria of this study, we have involved only 80 obesity cases and 50 healthy controls. The inclusion criteria of obesity cases were found to be BMI of 30 and above between the age range of 18–80 years of age. The exclusion criteria of obesity cases were affected with other metabolic disorder or below the BMI of 30 kg/m2. The inclusion criteria of control subjects were enrolled based on healthy life style without any complications and with a BMI of 29 kg/m2. The exclusion criteria of controls were found to be BMI 31 kg/m2. As a result of a wide range of varying etiologies, rates of prevalence, mortality, and anthropometric parameters, the BMI cases were classified to be Class-I (30–34.9 kg/m2), Class-II (35.0–39.9 kg/m2) and Class-III (40 kg/m2 and above). This study was carried out between 2020 after approval of ethical grant from Institutional review board at KSU. All the patients recruited in this study has signed the patient consent form. In this study, 155 subjects were excluded for not signing the patient consent form. In this study the sample size was determined based on the reference of Wang et al and Alshammary et al studies with 85% of power and 95% of confidence intervals with the obtained critical value of less than 2.0 (Alshammary and Khan, 2021; Wang and Chow, 2007).
2.1 Data and blood collection
Based on Alharbi et al., 5 ml of EDTA blood was collected and 3 ml was used for lipid profile analysis and 2 ml for separation of DNA (Alharbi et al., 2014). There are 4 types of lipid Profile parameters was obtained which was documented in Table 1. Both coagulant and anti-coagulant tubes were stored at 4 °C after collection of blood and again both serum and DNA were stored at −20 °C after the separation from their specific tubes. Lipid profile analysis was performed with Dimension vista1500 system available in the hospital premises. Based on the recommendations from the kits, lipid profile analysis was measured for obesity and control patients.
Obesity (n = 80)
Controls (n = 50)
P Value
Age (Years)
58.52 ± 10.55
55.21 ± 8.76
0.06
Gender (F:M)
35:45
22:28
0.06
Weight (kg)
83.25 ± 10.42
62.14 ± 9.57
<0.0001
Height (cms)
157.2 ± 6.13
156.7 ± 6.16
0.65
BMI (kg/m2)
33.59 ± 3.68
25.3 ± 3.09
<0.0001
HDL-C (mmol/L)
1.77 ± 1.83
1.21 ± 0.71
0.04
LDL-C (mmol/L)
3.21 ± 1.05
2.24 ± 0.84
0.001
TG (mmol/L)
2.60 ± 1.89
1.72 ± 0.65
0.001
TC (mmol/L)
4.02 ± 1.72
4.03 ± 0.84
0.96
2.2 SORT1 genotyping assay
DNA was extracted from 2 ml of EDTA tubes and simultaneously stored at −20 °C (Khan et al., 2015). Genomic DNA was measured with NanoDrop spectrophotometry for both qualitative and quantitative analysis (Poornima et al., 2019). The genotyping analysis for rs464218 SNP was performed with PCR-RFLP assay as described (Alharbi et al., 2018). The experimental analysis for PCR was optimized for 50 µl using Qiagen-PCR master mix kit, ionized water, primers and DNA templates. Master mix incorporated 10X buffer, dNTPs, Mgcl2 and Taq DNA polymerase. All DNA templates were denatured at 95 °C as initial denaturation for 5 mins, denaturation at 95 °C at 30 s, annealing-60 °C at 30 s, extension-72 °C at 45 s and final extension-72 °C at 10 min (Subramanyam et al., 2016). The amplification was performed for 35 cycles and later on completion of PCR analysis, the unpurified PCR products was run on 2% of agarose gel and then using HhaI restriction enzyme, RFLP analysis was carried out for overnight to digest the restriction enzyme. The digested PCR products were run on 3% agarose gel. The 230 bp (A allele) was the PCR product and after digestion 178 bp (G allele) was formed.
2.3 Statistical analysis
Eight obesity cases and 50 controls were measured the t-tests between both groups. Hardy-Weinberg equilibrium (HWE) analysis was performed for rs464218 SNP assay. Genotyping analysis was performed between cases and control groups using OR and 95%CI with P values. One-way Anova analysis was performed with lipid profile and rs464218 SNP assay. P value was confirmed as <0.05 as a significant analysis (Khan et al., 2019). The statistical analysis was performed with SPSS software.
3 Results
3.1 Demographical features of obesity population
This study involves 140 subjects of obese and non-obese population. The anthropometric features and lipid profile parameters are presented in Table 1. The obesity group had a higher BMI levels when compared with controls (p < 0.0001) and it was vice versa in weight (p < 0.0001). The elevated levels of HDLC, LDLC and TG showed in obesity with positive association (p < 0.05). The mean age of obesity subjects was found to be 58.52 and 55.21 in control subejcts. Age, gender, height and TC showed the negative association (p > 0.05).
3.2 Distribution of SORT1 genotyping assay
The distribution of rs464218 genotypes and allele frequencies in both the study subjects were shown in Table 2. A deviation was confirmed in HWE analysis in both the subjects (p < 0.05). Among control groups, the genotype frequencies of AA, AG and GG were 58%, 26% and 16% and 53.75%, 28.75% and 17.5% in obesity groups (Fig. 1). The allele frequencies in obesity group showed 68% of A allele and 32% of G allele, where as in control group, 71% of A allele and 29% of G allele was confirmed. None of the genotypes including dominant models and allele frequencies showed the positive association between the obesity and control groups (AG vs AA; OR-1.19 (0.52–2.72); p = 0.67, AA vs AG + GG; OR-1.18(0.58–2.42); p = 0.63 and G vs A; OR-0.87 (0.50–1.50), p = 0.62).
Genotype
Obesity Cases (n = 80)
Controls (n = 50)
OR (95%CIs)
P Value
AA
43 (53.75%)
29 (58%)
Reference
Reference
AG
23 (28.75%)
13 (26%)
1.19 (0.52–2.72)
0.67
GG
14 (17.5%)
08 (16%)
1.18 (0.43–3.17)
0.74
AA vs AG + GG
37 (46.25%)
21 (42%)
1.18 (0.58–2.42)
0.63
A allele
109 (0.68)
71 (0.71)
Reference
Reference
G allele
51 (0.32)
29 (0.29)
0.87 (0.50–1.50)
0.62
HWE
0.32
0.29
–
–
X2
11.42
13.58
–
–
P values
0.0007
0.0002
–
–
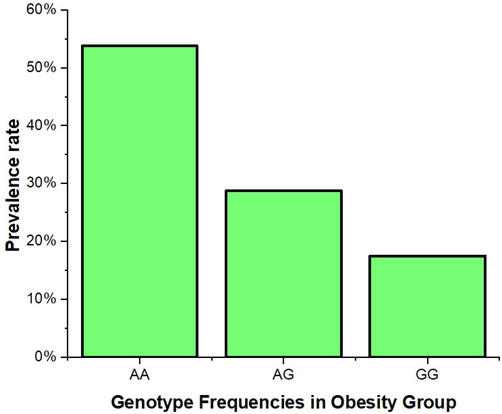
Representation of prevalence frequencies of rs464218 SNP genotype assay in obese group.
3.3 Analysis of Anova
Table 3 defines the one-way of Anova analysis in obesity groups. Obesity groups has been categorized into 3 groups based on BMI. The Class-I obesity group consists of 59 subjects, Class-II obesity group consists of 15 subjects and Class-III obesity group consists of 06 subjects. The Class-I obesity group subjects showed the elevated levels of TG (4.21 ± 1.74) and LDLC (3.38 ± 0.97), whereas in first group of Class-II obesity group showed height (158.53 ± 6.41) and HDLC (2.90 ± 2.20) as elevated levels. The Class-III obesity group subjects showed Age (60.6 ± 9.54), weight (102.28 ± 6.60), BMI (43.35 ± 2.65) and TC (3.36 ± 1.94) as elevated levels among the three groups. The Anova analysis revealed the positive association in weight (p = 0.0004), BMI (p = 0.0008) and LDLC (p = 0.001) among the three groups.
Class-I Obesity (n = 59)
Class-II Obesity (n = 15)
Class-III Obesity (n = 06)
P value
Age (Years)
59.08 ± 10.01
55.46 ± 13.37
60.6 ± 9.54
0.44
Weight (kgs)
79.02 ± 6.93
93.35 ± 8.12
102.28 ± 6.60
0.0004
Height (Cms)
157.48 ± 6.13
158.53 ± 6.41
153.63 ± 5.16
0.25
BMI (kg/m2)
31.81 ± 1.35
37.09 ± 1.34
43.35 ± 2.65
0.0008
TG (mmol/L)
4.21 ± 1.74
3.31 ± 1.47
3.90 ± 1.85
0.19
TC (mmol/L)
2.55 ± 1.78
2.47 ± 2.05
3.36 ± 1.94
0.56
HDLC (mmol/L)
1.63 ± 1.80
2.90 ± 2.20
1.39 ± 0.60
0.051
LDLC (mmol/L)
3.38 ± 0.97
2.31 ± 1.25
3.04 ± 0.52
0.001
4 Discussion
GWAS was found to be a powerful method for identifying the genetic loci most closely connected with obesity because of the huge cohorts of samples and the specific genes and genetic diversity it is associated with (Ke et al., 2021). There has been a recent flurry of new GWAS discoverers as a result of increased sample size and improved sequencing techniques (Loos and Yeo, 2021). Obesity was linked to 750 loci, according to the findings (Sun et al., 2020). SORT1 gene was discovered by GWAS and has been studied in numerous human disorders, including obesity (Alharbi et al., 2018). This study was designed to investigate the role of rs464218 SNP genotype assay in SORT1 gene in the obesity subjects in the Saudi population. There were no studies between obesity and the rs464218 SNP in Saudi Arabia, although Alharbi et al reported a comparable SNP genotype in Stroke patients (Alharbi et al., 2018). This study confirmed the negative association with genotype, dominant model and allele frequencies (p > 0.05). Anthropometric measurements such as weight and BMI were strongly associated between cases versus controls (p < 0.05). Lipid profile parameter revealed the significant association between HDLC, LDLC and TG among the cases (p < 0.05). Anova analysis also revealed a strong association among obesity such as weight and BMI as well as LDLC (p < 0.05).
SORT1 gene was studied in obesity subjects with the limited population (Al-Eitan et al 2020). Apart from obesity, SORT1 gene was studied in other human diseases (Alharbi et al., 2018; Luay et al., 2021; Møller et al., 2021; Zeng et al., 2013; Zhou et al., 2015). Till now there were no meta-analysis studies have been discovered between obesity and SORT1 gene. Apolipoprotein B100 (ApoB100) binds to Sortilin, which is produced by SORT1. As a result, plasma LDL-C is regulated, as is the production and hepatic export of lipoproteins containing ApoB100 (Zhou et al., 2015). This indicates there is a relation between SORT1 gene and lipid profile, specifically towards LDLC. In this study, LDLC levels were strongly associated with controls as well as within the obesity groups which was documented in Table-3 (p < 0.05). One of the recent studies has reconfirmed the relation between lipid profile parameter and SORT1 gene as this gene is a confirmed as a potential biomarker for CVD (Møller et al., 2021).
Average height is used as a proxy for nutritional well-being, and the term 'biological standard of living' is used instead of ‘standard of living' in this context. The latter is evaluated from a financial standpoint. Those who are taller than their peers are also viewed as having an edge. Obesity is more likely to strike children who are taller than average for their age (Rosario et al., 2018). Obesity and morbid obesity are likely to occur in the future as a result of the combination of shorter people with elevated BMI levels (Sahoo et al., 2015). Genotyping errors were ruled out with 10% of genotyping with Sanger sequencing analysis (Al-Otaiby et al., 2021; Bogari et al., 2021). DNA sequencing analysis is very accurate analysis to identify the specific SNPs but this technique is expensive. Genotyping errors may be caused due to the handling of pipettes, human errors, low quality of DNA and many more.
One of the strengths of this study was selection of cases and controls from a single tertiary hospital and low sample size of cases and control were one of the limitations of this study. This study concludes as rs464218 SNP genotype is not associated in obesity subjects. This is due to the low sample size and future studies recommend to perform the large sample size in the global population studies.
Conflict of interest
None.
Acknowledgement
The authors would like to extend their sincere appreciation for funding this research to Researchers Supporting Project number (RSP-2021/349), King Saud University, Riyadh, Saudi Arabia.
References
- The prevalence of Factor V Leiden (Arg506Gln) mutation in King Khalid University Hospital patients, 2017–2019. Nagoya J. Med. Sci.. 2021;83:407.
- [Google Scholar]
- Relationship between serum amyloid A1 (SAA1) gene polymorphisms studies with obesity in the Saudi population. Diabetes Metabolic Syndrome Obesity: Targets Therapy. 2021;14:895.
- [Google Scholar]
- Lack of association between UBE2E2 gene polymorphism (rs7612463) and type 2 diabetes mellitus in a Saudi population. Acta Biochim. Pol.. 2014;61
- [Google Scholar]
- Genetic Association of SH2B1 Gene Polymorphisms in Jordanian Arab Patients with Type 2 Diabetes Mellitus. 13, p.1825.Vancouver. Diabetes, Metabolic Syndrome and Obesity: Targets and Therapy,. 2020;13:1825-1834.
- [Google Scholar]
- Molecular genetic studies in Saudi population; identified variants from GWAS and meta-analysis in stroke. Saudi J. Biol. Sci.. 2018;25:83-89.
- [Google Scholar]
- Screening of obese offspring of first-cousin consanguineous subjects for the angiotensin-converting enzyme gene with a 287-bp Alu sequence. J. Obesity Metabol. Syndrome. 2021;30:63-71.
- [Google Scholar]
- Althumiri, N.A., Basyouni, M.H., AlMousa, N., AlJuwaysim, M.F., Almubark, R.A., BinDhim, N.F., Alkhamaali, Z., Alqahtani, S.A. (2021). Obesity in Saudi Arabia in 2020: prevalence, distribution, and its current association with various health conditions. In 3. (Multidisciplinary Digital Publishing Institute), pp. 311.
- Assessment of genetic polymorphism associated with ATP-binding cassette transporter A1 (ABCA1) gene and fluctuations in serum lipid profile levels in patients with coronary artery disease. Saudi Pharm. J. 2021
- [Google Scholar]
- Genes in human obesity loci are causal obesity genes in C. elegans. PLoS Genet.. 2021;17
- [Google Scholar]
- Genetic confirmation of T2DM meta-analysis variants studied in gestational diabetes mellitus in an Indian population. Diab. Metabol. Syndrome: Clin. Res. Rev.. 2019;13:688-694.
- [Google Scholar]
- Importance of glucokinase-258G/A polymorphism in Asian Indians with post-transplant and type 2 diabetes mellitus. IRDR 2015
- [Google Scholar]
- An investigation of SORT1 gene polymorphism with lipid profile biomarkers in Iraqi patients having Myocardial infarction. Ann. Roman. Soc. Cell Biol.. 2021;25:1561-1574.
- [Google Scholar]
- Sortilin as a biomarker for cardiovascular disease revisited. Front. Cardiovas. Med.. 2021;8:166.
- [Google Scholar]
- Role of SREBP2 gene polymorphism on knee osteoarthritis in the South Indian Hyderabad Population: a hospital based study with G595C variant. J. Orthop.. 2019;16:293-297.
- [Google Scholar]
- Obesity and infectious diseases: pathophysiology and epidemiology of a double pandemic condition. Int. J. Obesity 2022:1-17.
- [Google Scholar]
- Body mass index categories and attained height in Portuguese adults. Obesity facts. 2018;11:287-293.
- [Google Scholar]
- Childhood obesity: causes and consequences. J. Family Med. Primary Care. 2015;4:187.
- [Google Scholar]
- Missense FokI variant in the vitamin D receptor gene in primary knee osteoarthritis patients in south Indian population. Gene Rep.. 2016;4:118-122.
- [Google Scholar]
- Sun, C., Kovacs, P., Guiu-Jurado, E. (2020). Genetics of obesity in East Asians. Front. Genetics, 1224.
- Sample size calculation for comparing means. Encyclopedia Statistical Sci. 2007:1-10.
- [Google Scholar]
- No association of SORT1 gene polymorphism with sporadic Alzheimer’s disease in the Chinese Han population. NeuroReport. 2013;24:464-468.
- [Google Scholar]
- Association of variants in CELSR2-PSRC1-SORT1 with risk of serum lipid traits, coronary artery disease and ischemic stroke. Int. J. Clin. Exp. Path.. 2015;8:9543.
- [Google Scholar]


