

Translate this page into:
Assessment on the geological engineering properties of Riyadh’s carbonate bedrock (Saudi Arabia)
⁎Corresponding author. mcueto@idom.com (Manuel Cueto)
-
Received: ,
Accepted: ,
This article was originally published by Elsevier and was migrated to Scientific Scholar after the change of Publisher.
Peer review under responsibility of King Saud University.
Abstract
Nowadays global urbanization, increasingly trending towards megacities worldwide, is putting pressure on the underground environment. Consequently, a need to shed light on the metropolitan subsurface geology has arises. Different megacities around the world maintain large bibliographic repositories related to prior infrastructure construction projects, for example, metro projects which spread over entire urban areas. However, in fast growing cities like the capital of Saudi Arabia, the available technical and scientific literature regarding the city’s subsoil is scarce. This investigation shows the first full-scale geotechnical assessment of the Upper Jurassic - Lower Cretacic subcrop sequence found throughout Riyadh’s downtown region. It is based on data obtained during the investigation of Riyadh’s Metro Line 3 (41.6 km), the longest line within the largest metro project ever built from scratch and as a whole.
The geotechnical testing protocol involved around 9 km of core-drilling with tests conducted inside the boreholes, collection of more than 900 samples of rock cores obtained to perform laboratory tests, and 42 km of multi-technique geophysical survey. This article provides data concerning ground properties based on the statistical evaluation of intact rock and rock mass scales. Considering the lack of pre-existing information, this paper could be useful when planning the design of future geotechnical investigations and projects spanning the city of Riyadh. Furthermore, this paper also provides empirical correlations which are usable to obtain indirect geotechnical parameters, applicable to other urban areas crossing frameworks similar to Riyadh’s subsoil.
Keywords
Characteristic value
Geotechnical parameters
Intact rock
Mesozoic limestone
Rock mass

- ADA
-
Arriyadh Development Authority
- ASTM
-
American Society for Testing Materials
- GSI
-
Geological Strength Index
- ISRM
-
International Society for Rock Mechanics
- Jcond
-
Joint Condition
- JCS
-
Joint Compressive Strength
- JRC
-
Joint Roughness Coefficient
- KP
-
Kilometer Point
- RQD
-
Rock Quality Designation
- RMR
-
Rock Mass Rating
- UN
-
United Nations
Abbreviations
1 Introduction
With the global population residing in urban areas expected to increase from its current 55 % to 68 % by 2050 (UN, 2019), assessments of ground properties providing geotechnical data are increasingly in demand in dense urban environments. In this regard, there is an increased motivation to use the metropolitan underground space for the benefit of citizens.
Existing data from underground works can be of great value, if data acquired is collected and made available to proceed with correlations and analysis, especially in case of challenging geological and geotechnical conditions (Marinos et al., 2013). Several authors have reported geotechnical assessments related to railway metro construction in the Arabian Peninsula. Beau et al. (2008) gives description and characterization of the geotechnical units along the Dubai Metro Project (the first urban transit network in the region). Sousa et al. (2017) presents methodologies for tunnel exploration planning in Masdar City Metro subway tunnels in Abu Dhabi. Particularly in Saudi Arabia, Abdelrahman et al. (2020) recently assessed ground conditions in the Holy city of Makkah Al-Mukarramah and Alhumimidi (2020) in Jizan city, among others.
Riyadh, capital of the Kingdom of Saudi Arabia, is one of the world’s fastest growing cities and its population is expected to increase from 7 million (current) to 8.5 million by 2030. Although there was an increase in the number of subsoil surveys associated with the rapid urban development in Riyadh, the geotechnical data is either not accessible or lost (Al-Refeai and Al-Ghamdy, 1994). In this regard, only a few authors have brought to light geotechnical aspects relating to rock engineering properties. Examples include Masoud and Abd El Aal (2019) preparing geotechnical zoning maps to describe the suitability of construction based on Rock Quality Designation (RQD) and unconfined compressive strength. Moreover, several authors have reported on the geotechnical constraints of the subsurface rocks related to karst cavities and sinkholes (Hird et al., 2019, among others). These factors elevated the need to improve the geological and geotechnical knowledge of the carbonate Mesozoic sequence in the city.
Riyadh lies on Late Jurassic to Lower Cretaceous carbonate rocks with subhorizontal bedding, which from bottom to top are: Jubaila, Arab (A, B, C and D members), Hith and Sulaiy Formations. These units have suffered extensive slumping, collapsing and brecciating due to the dissolution of the interbedded anhydrite levels by meteoric water (Bamousa et al., 2014). Due to the dissolution and collapse of these rocks, myriad evidence of karst features was found in the city, such as sinkholes and empty or clay filled cavities (Youssef et al., 2016; Cueto et al., 2018a). Approximately 30 % of the city, especially its central and eastern parts, is covered by recent sediments, which are mainly composed of clay, silt, sand, and gravel deposits (Al-Othman, 2002).
Considering that the understanding of urban environments increases with each megaproject completed, the Riyadh Metro Project (Fig. 1a) can be a starting point to enhance the urban geological and geotechnical background of the city. It is a $23 bn project with a driverless operating system, which comprises of 6 metro lines (176 km), 85 stations, 7 depots, and 25 park & ride facilities. Given the new information that this project provides and evidence of the growing interest on this topic, several technical articles have been written about the geotechnical design aspects of the Riyadh Metro Project: of Line 1 (Almajed et al., 2021), Line 3 (Gómez Corral et al., 2017), etc. However, ranges of geotechnical properties for the main rock units found in the city have not been fully assessed until now.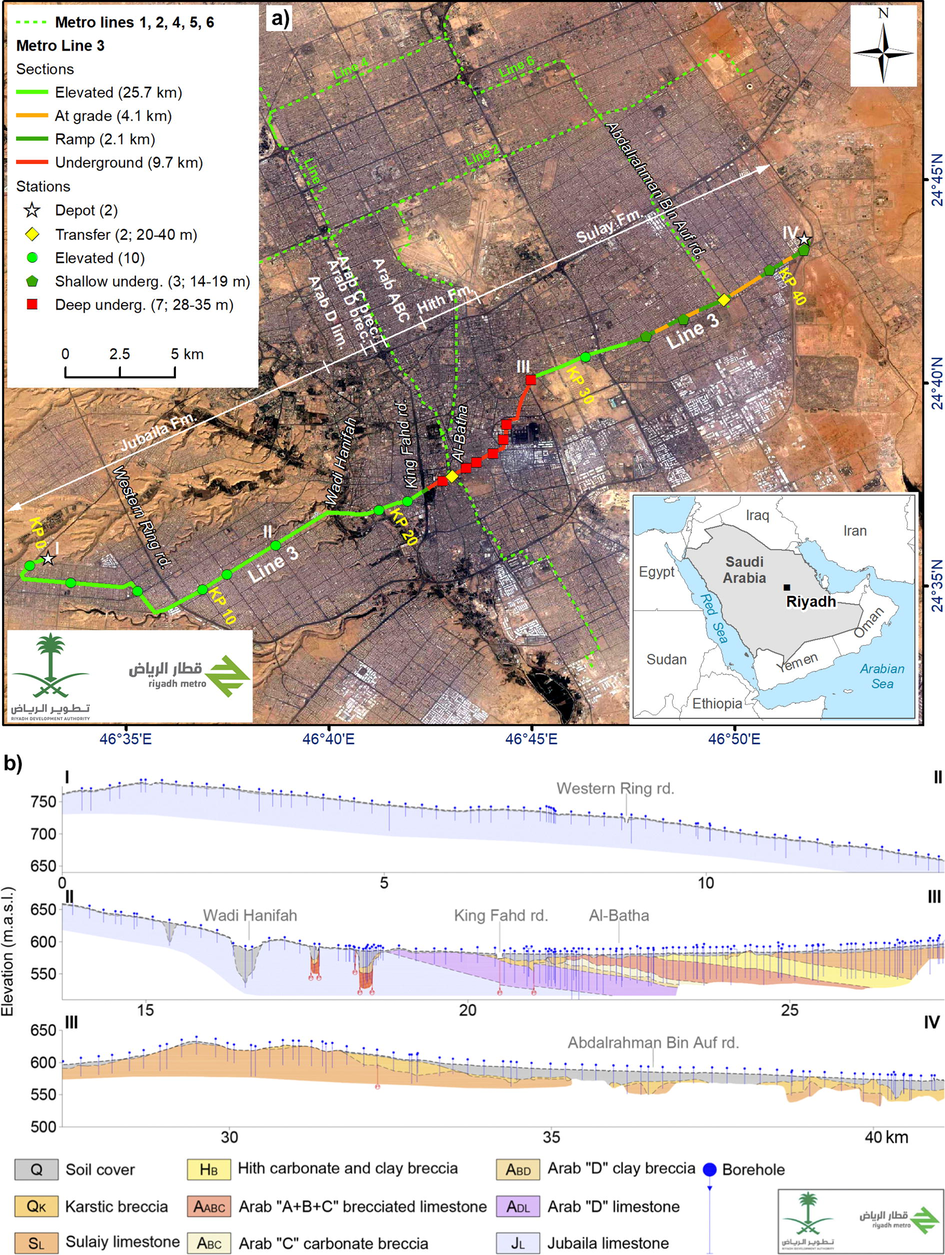
Riyadh Metro Project: a) general layout; b) geological section along Line 3 (vertical axis x10).
2 Methodology
This research starts from the rock units classification reported by Cueto et al. (2020) using multi-technique engineering geological testing in Riyadh (462 x-ray fluorescence and LECO, 406 x-ray diffraction and 11 petrographic analysis): Jubaila, Arab D limestone, Arab D clay breccia, Arab C carbonate breccia, Arab ABC brecciated limestone, Hith carbonate and clay breccia, and Sulaiy (Fig. 1b). Furthermore, geophysical data for this investigation is gathered from the integrated geophysical survey carried out along the entirety of Metro Line 3 (37.8 km of seismic refraction, 39.7 km of electrical resistivity, 28 crosshole and 169 downhole tests). Finally, the geotechnical information presented in this article is based on the extensive borehole testing program with 9 km of core-drilling including 48 pressuremeters. These boreholes were scaled along Line 3 with a shorter interval along the deep underground section (100 m) than the elevated sections (250 m) to match the level of difficulties likely to be encountered throughout the metro infrastructure (Fig. 1a) and geology (Fig. 1b). In benchmark boreholes, a total amount of 909 samples of rock cores were collected for laboratory tests (818 density, 626 unconfined compression, 92 elasticity modulus, 237 point load and 7 triaxial). Samples were taken approximately each 3 m in depth, and at each change of layer. For the execution of the different tests, ASTM standard (American Society for Testing Materials) was applied.
Given the variability and uncertainty of the rock properties, different standards use varied statistical analysis to assess characteristic geotechnical parameters. According to Eurocode 7, these parameters should be mainly calculated based on laboratory and field test results, choosing the characteristic value of a geotechnical parameter as a prudent estimation of the limit state, with the calculated probability of a worse value governing its occurrence lower than 5 % (EN 1997-1, 2004). At the first stage, to improve the analysis, the available data was treated statistically using Tukey’s Fences, including the definition of extreme values as outliers based on the interquartile range. At a second stage, the characteristic values of intact rock properties (Xk,inf and Xk,sup) were calculated as a cautious estimate of the mean value (large volume of ground that controls the occurrence of the limit state) with a confidence level of 95 %. Considering that a large amount of laboratory data is available (Central Limit Theorem); a Normal distribution was considered, as suggested for these parameters in previous studies of rock mechanics (e.g. Sari, 2009). The statistical method for determining the characteristic values (from Bond and Harris, 2008): where Xmean is the arithmetical mean value, Vx is the coefficient of variation and the kn is a statistical coefficient calculated as:
The factor is the t factor of Student's distribution with n-1 degrees of freedom and confidence of 95 %, and n the sample size.
The rock mass was classified based on its characteristics and the type and distribution of joints, with the Geological Strength Index (GSI). The degree of jointing was calculated from borehole logging and compared with the image from the corresponding Tv-logging (218 tests) by observation of the general appearance of the rock mass. In some cases, the low RQD value was revealed to correspond to difficult rock sampling conditions, rather than a real fracturing of the rock. For the Jcond parameter, reference was made to the Rock Mass Rating system (RMR89) of Bieniawski (1989) implemented by taking advantage of direct observations of existing outcrops carrying out 14 geomechanical surveys. From now on, RMR refers to the RMR89 system without adjusting for joint direction (RMRb) and for dry conditions. The basic data obtained with the results of laboratory tests on intact rock samples was then amplified using RocData v5.0 software (Rocscience Inc.) to define the behavior of the rock mass following the Hoek-Brown failure criterion (Hoek et al., 2002).
3 Results and discussion
3.1 Intact rock properties
3.1.1 Description, identification and classification
The chemical and mineralogical composition categorized most of the rock samples as pure limestone, with only 30 % of them classified as argillaceous limestones and marls (Arab C and D breccias, Hith, and lower Sulaiy). Magnesium-rich limestones are restricted to Arab D limestone and upper Jubaila. The petrographic analysis showed that most of the units corresponded to calcarenitic, bioclastic, and lithoclastic limestones with heterogeneous texture; from mud-rich mudstone and wackstone to grain-supported lithoclastic or peloidal packstone fabric (Fig. 2). Some samples presented brecciated textures made up of polymictic rock fragments (<1 cm), quite likely due to the complete interbedded gypsum and anhydrite dissolution and the subsequent brecciation under lithostatic load, as mainly observed in Hith.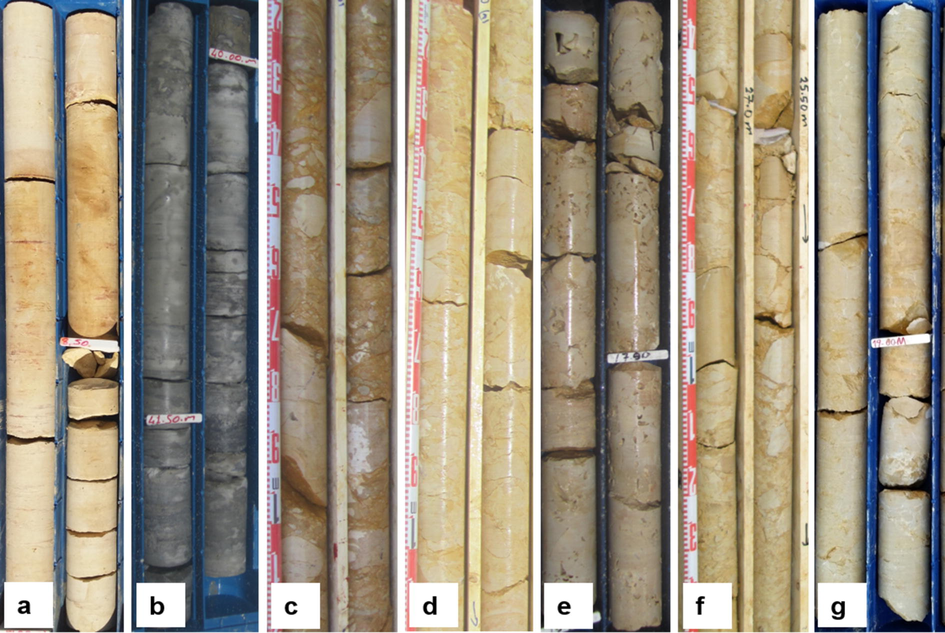
Core photographs examples: a) Jubaila calcarenite; b) Arab D calcarenite with burrows; c) Arab D clay breccia; d) Arab C carbonate breccia; e) Arab ABC aphanitic limestone with geodic porosity; f) Hith carbonate and clay breccia; g) brecciated aphanitic-calcarenitic Sulaiy.
3.1.2 Physical properties
The unit weight at the natural water content values typically ranged from 22 to 27 kN/m3, with an average of 24.6 kN/m3. Only slight differences were found comparing the results of the well layered units (Jubaila and Arab D limestone) with the brecciated formations (Arab D and C breccias, Arab ABC, Hith and Sulaiy) as shown in Fig. 3a. The natural water content typically oscillated from 0.1 to 1.1%. The porosity varied from 0.1 to 8.1% with an average of 2.5%, which is in the range of the typical values for limestone (5–20 %) suggested by Serrano (2002). These values matched quite well with the average unit weight of 22.75 kN/m3 and porosity of 2 to 12% for Sulaiy limestone reported in the city by Abd El Aal (2015).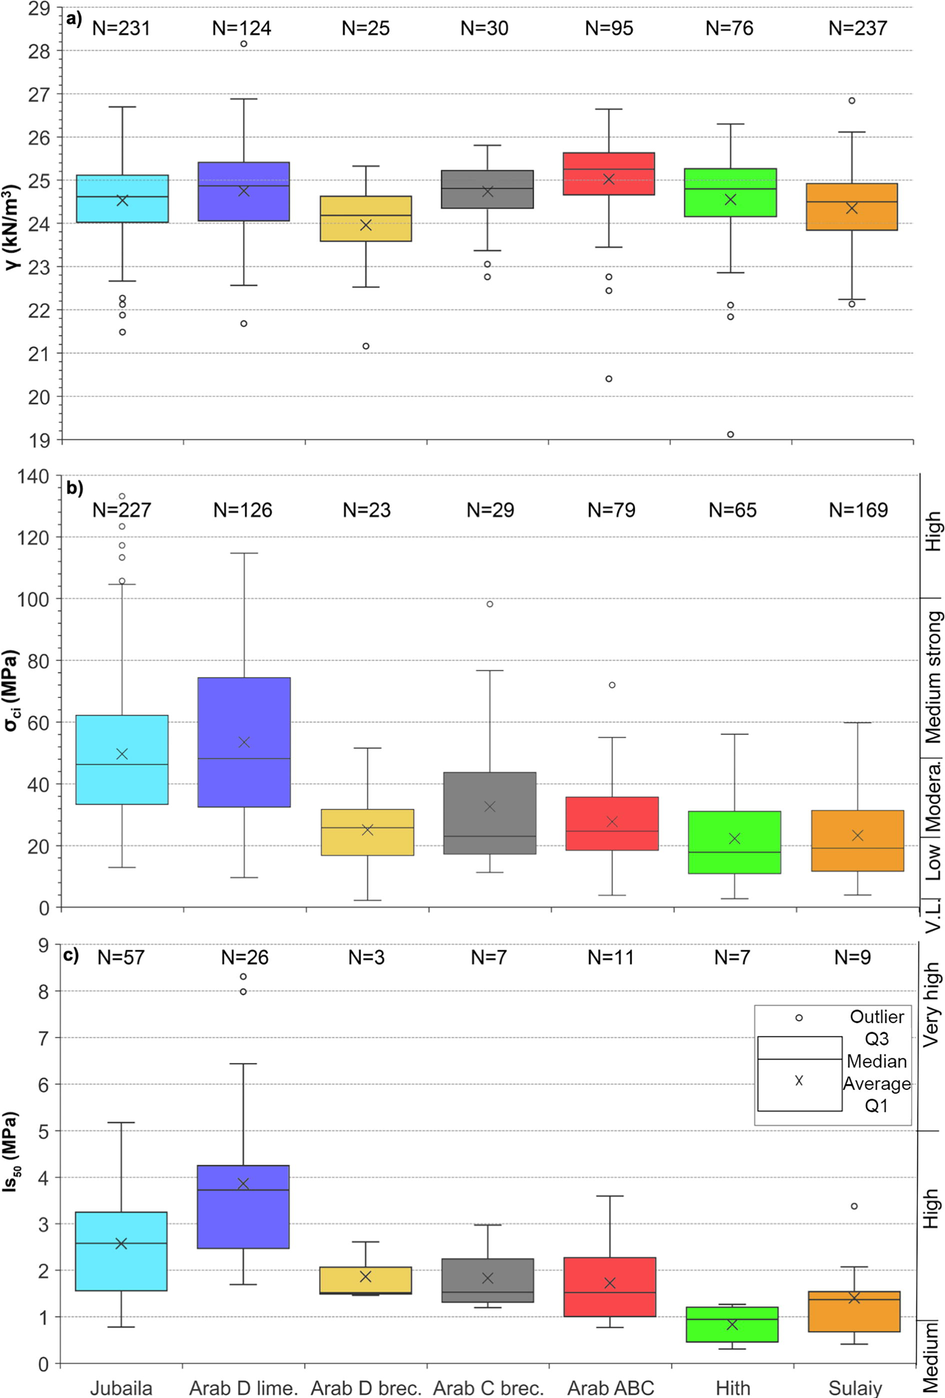
Boxplots for each geotechnical unit: a) unit weight at the natural water content (γ); b) unconfined compressive strength (σci); c) point load index (Is50).
3.1.3 Mechanical and elasticity properties
The unconfined compressive strength over 718 rock samples ranged from 2.2 to 133.2 MPa, with an average of 37.8 MPa and median value of 32.7 MPa. Strength results on rock samples showed higher values for the bedded limestone rock layers (Jubaila and Arab D limestone) with an average of 51 MPa, than for the brecciated units (Arab D and C breccias, Arab ABC, Hith and Sulaiy) with 25 MPa (Fig. 3b). These values matched relatively well with the average dry strength previously evaluated by ADA (1990): 39.9 and 26.5 MPa for Jubaila aphanitic and calcarenitc limestone respectively; 19.8, 23.1, and 25.3 MPa for Arab aphanitic, breccia, and calcarenite correspondingly; and 25.6, 17.9, and 21.3 MPa for Sulaiy aphanitic, breccia and calcarenite respectively. In addition, their findings trend towards weakness with increasing moisture content (23 to 73% reduction).
The strength results were also indirectly obtained from point load test determinations (Fig. 3c) which presented high scatter of the variation coefficient (Vx of 0.58). The Is50 index varied from 0.3 to 8.3 MPa, which are typical values for limestone. Comparing the strength results obtained from unconfined compressive strength test with the ones directly obtained from point load (Fig. 3c), there is fairly the same trend towards strength per geotechnical unit. These values are slightly lower than the ones obtained by Abdlmutalib et al. (2015) in an outcrop 60 km south of Riyadh for Upper Jubaila and Arab-D Member. They ranged from 1.5 MPa for the laminated mudstone to 14 MPa for the grainstone lithofacies. On the other hand, triaxial laboratory tests on rock resulted in an average Hoek-Brown parameter “mi” of 12 for the bedded limestone and 15 for the brecciated units.
Rock units show a modulus of elasticity typically ranging from 10 to 55 GPa, meanwhile, the Poisson ratio is generally between 0.2 and 0.3. The stiffness results obtained from the triaxial tests are higher (average and median modulus of 41 GPa) than the ones gained from the uniaxial strength tests with bands (33 GPa), probably due to the effect of the confining pressure in weak rocks, which increase the friction in micro fissures (Mingqing, 2003). In this regard, Alnuaim et al. (2019) obtained from nine rock core specimens of Jubaila and Arab Formation in two sites of Riyadh city, an average value of Poisson’s ratio of 0.25 and Young’s modulus ranging from 45 to 59 GPa. These average values are greater than the ones obtained along Line 3, probably due to the number of test results and different specimens’ geometry.
Rock units were categorized as “low strength” and “high modulus ratio” (Ei/σci > 500) according to Deere and Miller (1966) as shown in Fig. 4. This high modulus ratio is typical in other limestones in Arabia (Al-Shayea, 2004), with extreme values higher than 1200.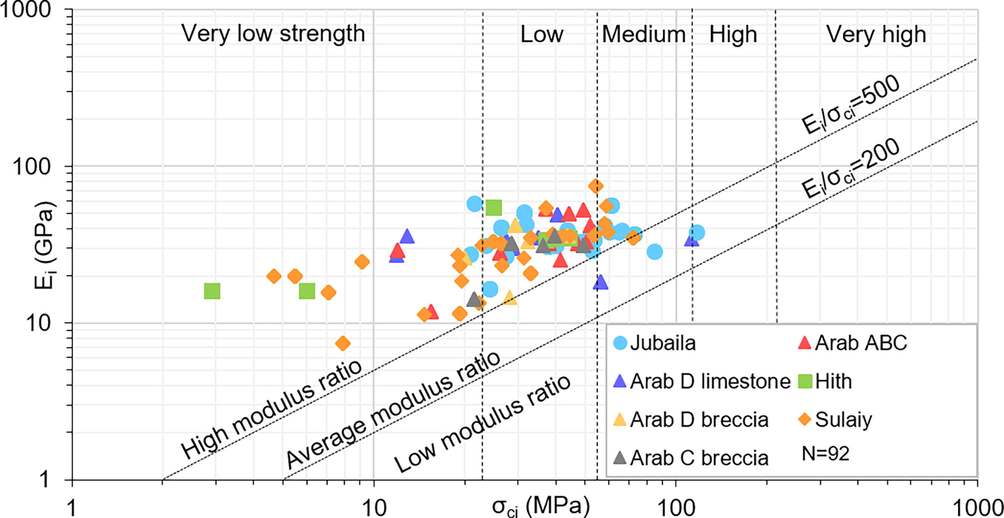
Engineering Classification for intact rock.
3.1.4 Physico-mechanical correlations
Regarding correlation between density and strength tests, better correlation was found between the thinly bedded limestone rocks (Jubaila and Arab D limestone) than the brecciated carbonate rocks (Arab brecciated rock units, Hith and Sulaiy), however, both had a low Determination Coefficient (R2 < 0.4). On the other hand, a good linear correlation (R2 > 0.9) was found between the maximum axial stress and strain (Fig. 5).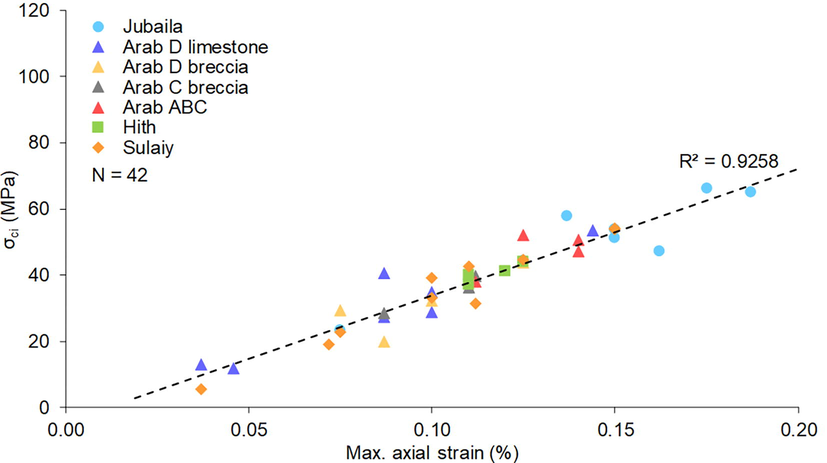
Stress–strain ratio of the unconfined compression strength test.
According to Bieniawski (1974) an average correction factor for all types of rock is feasible (σci≈24·Is50). Contrastingly, Romana (1999) presented variable factor depending on the type of rock, ranging from 18 to 24 for well cemented limestone and 12 to 18 for poor cemented limestones. The point load data resulted in a wide range of results and a linear regression among point load and uniaxial strength of 17.7, in place of the most common value of 22–24. Such a result was associated with the brecciated nature of most of the rocks and the fact that the point load results are not very effective in the range of 0 to 2 MPa. The average σci /Is50 ratio of these rock units was 19 for the bedded limestone units (Jubaila and Arab D limestone), and approximately 16 for the brecciated and slumped rock layers (Arab D and C breccias, Arab ABC, Hith and Sulaiy). Moreover, higher average coefficients and more consistent results were obtained through point load testing of axial specimens (Is50 of 3.6 MPa and Vx of 0.03) than diametral ones (2.2 MPa and 0.58) as previously assessed testing weak rocks by Bowden et al. (1998).
3.1.5 Characteristic values of intact rock parameters
Based on the statistical analysis carried out, the lower or inferior characteristic value (Xk,inf) and the higher or superior characteristic value (Xk,sup) as a 95 % confidence limit for the mean were calculated (Table 1). Considering the size and distribution of the available data, a Percentile of 33 % was in general satisfactorily adopted in Line 3. Tighter rules were not justified regarding this kind of ground, where brecciated and well-bedded rocks may coexist.
Unit weight (kN/m3)
Unit
n
Max.
Min.
Xmean
P50
Sx
Vx
P33
Xk,inf
Xk,sup
All
818
28.15
19.12
24.56
24.65
0.95
0.04
24.24
24.50
24.61
Jubaila
231
26.70
21.48
24.53
24.61
0.84
0.03
24.23
24.44
24.62
Arab D limestone
124
28.15
21.68
24.75
24.86
1.05
0.04
24.38
24.59
24.90
Arab D breccia
25
25.32
21.16
23.96
24.18
0.92
0.04
23.82
23.64
24.27
Arab C breccia
30
25.80
22.76
24.71
24.78
0.81
0.03
24.51
24.46
24.96
Arab ABC
95
26.64
20.40
25.02
25.25
0.96
0.04
24.92
24.86
25.18
Hith
76
26.30
19.12
24.55
24.79
1.08
0.04
24.38
24.34
24.75
Sulaiy
237
26.84
20.50
24.35
24.50
0.87
0.04
24.09
24.25
24.44
Unconfined compressive strength (MPa)
Unit
n
Max.
Min.
Xmean
P50
Sx
Vx
P33
Xk,inf
Xk,sup
All
718
133.20
2.20
37.80
32.70
23.73
0.63
24.18
36.34
39.26
Jubaila
227
133.20
12.89
49.71
46.31
21.19
0.43
37.67
47.38
52.03
Arab D limestone
126
114.70
9.63
53.51
48.21
27.72
0.52
37.73
49.41
57.60
Arab D breccia
23
51.60
2.20
25.12
25.80
12.88
0.51
19.28
20.51
29.73
Arab C breccia
29
98.20
11.30
32.68
23.04
21.23
0.65
20.42
25.98
39.39
Arab ABC
79
72.00
3.90
27.78
24.70
13.14
0.47
19.61
25.32
30.24
Hith
65
71.70
2.80
22.32
17.90
15.18
0.68
12.20
19.18
25.47
Sulaiy
169
73.70
4.00
23.32
19.19
14.45
0.62
14.59
21.49
25.16
Elasticity modulus (GPa)
Unit
n
Max.
Min.
Xmean
P50
Sx
Vx
P33
Xk,inf
Xk,sup
All
99
74.20
7.39
33.72
34.00
12.21
0.36
30.96
31.68
35.76
Jubaila
29
58.19
16.49
37.12
36.83
8.87
0.24
33.24
34.32
39.92
Arab D limestone
12
57.80
18.30
38.51
35.50
11.76
0.31
33.88
32.41
44.61
Arab D breccia
6
42.00
14.60
27.85
29.50
11.18
0.40
22.33
18.65
37.05
Arab C breccia
5
36.00
14.10
28.82
31.00
8.48
0.29
31.00
20.73
36.91
Arab ABC
11
53.13
11.85
35.26
32.00
12.77
0.36
29.90
28.28
42.24
Hith
7
54.50
16.00
32.22
35.00
13.21
0.41
33.64
22.52
41.92
Sulaiy
29
74.20
7.39
30.18
31.00
14.58
0.48
23.12
25.57
34.78
Point load test Is50 (MPa)
Unit
n
Max.
Min.
Xmean
P50
Sx
Vx
P33
Xk,inf
Xk,sup
All
120
8.31
0.31
2.53
2.30
1.47
0.58
1.56
2.30
2.75
Jubaila
57
5.18
0.78
2.58
2.58
1.11
0.43
1.87
2.33
2.82
Arab D limestone
26
8.31
1.69
3.87
3.73
1.77
0.46
3.02
3.27
4.46
Arab D breccia
3
2.61
1.46
1.86
1.52
0.65
0.35
1.50
0.77
2.96
Arab C breccia
7
2.97
1.20
1.83
1.53
0.67
0.36
1.38
1.34
2.32
Arab ABC
11
3.60
0.77
1.73
1.52
0.96
0.56
1.15
1.20
2.25
Hith
7
1.27
0.31
0.84
0.94
0.41
0.50
0.47
0.53
1.14
Sulaiy
9
3.38
0.41
1.40
1.37
0.91
0.65
0.95
0.84
1.97
3.2 Rock mass
3.2.1 Geomechanical classification
In addition to the bedding (S0), four joint sets (due to lithification under lithostatic load) of subvertical joints have been recognized in geomechanical surveys (J1 to J4), for both the undisturbed limestone and the brecciated units (Fig. 6a). This fact is coherent with the sedimentary wedge context, evidence of the absence of tectonic deformation. The bedding is of close spacing (Fig. 6b), partially open (Fig. 6c), of very high persistence (Fig. 6d), and with weathering rock infilling (Fig. 6e) according to ISRM (1981). The joint sets (J1 to J4) show patent differences between the unaltered bedded limestones and the brecciated formations, the latter showing, closer spacing, lower persistence, and higher weathering infilling.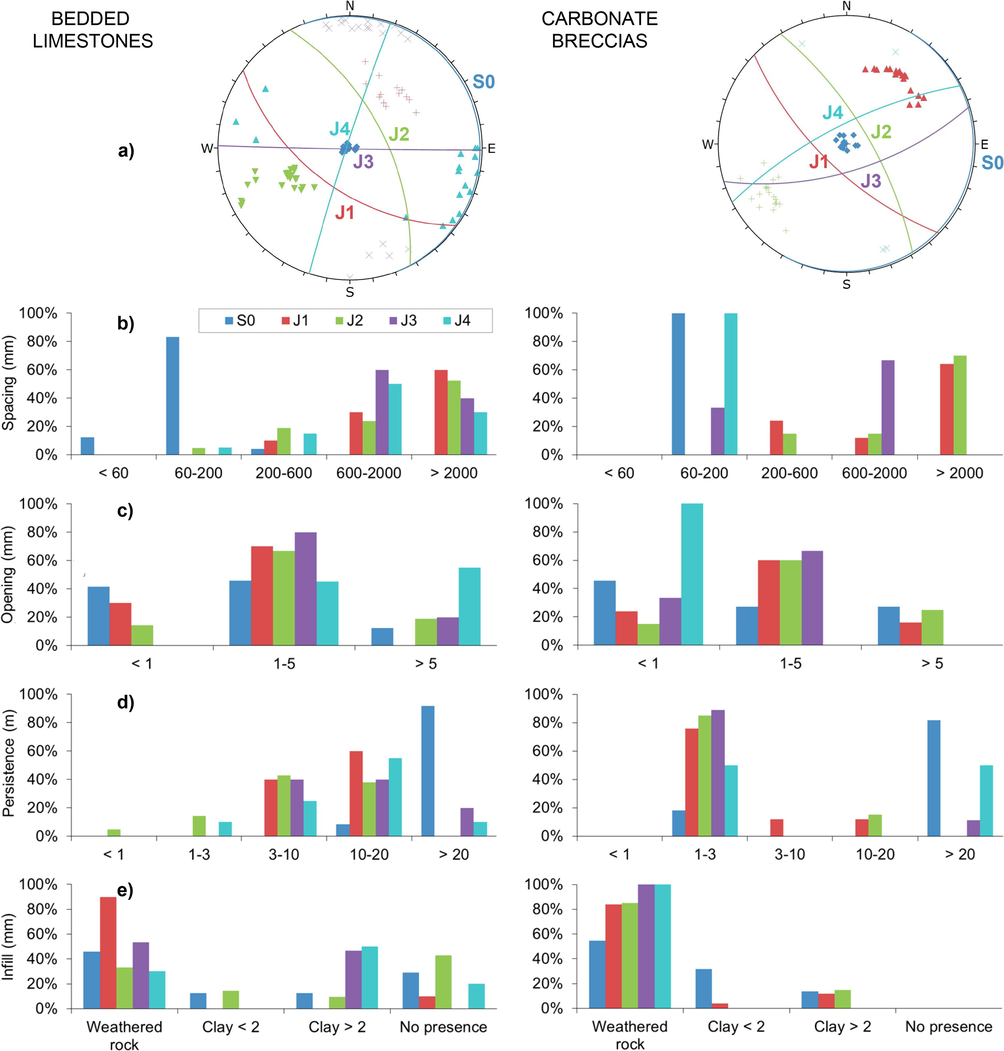
Joint set data from geomechanical surveys in open outcrops: a) orientation; b) spacing (mm); c) opening (mm) d) persistence or continuity (m); e) infilling (mm).
Starting from the 46 Schmidt rebound number measured in the geomechanical surveys (between 44 and 59 in Jubaila and 20 to 54 in Sulaiy) and a basic angle of friction (Øb) of 25°, a residual angle of friction (Ør) of 15° was calculated. The Schmidt rebound hammer was also used to evaluate the Joint Compressive Strength (JCS) of the walls as proposed by Deere and Miller (1966) resulting in 10 to 30 MPa. The Joint Roughness Coefficient (JRC) was estimated as 10 “smooth undulating” by comparing the appearance of the surface of the rock joints with the standard profiles published by Barton and Choubey (1977). The RQD measured in borehole cores (Table 2) describes most of the rock units as “fair” (Jubaila, Arab D limestone, Arab C breccia, Arab ABC and Sulaiy), classifying the rest of the geotechnical units as “poor” (Arab D breccia and Hith). The unaltered bedded limestone units are classified as good rock (65 > RMR > 62) and the fractured and brecciated, as fair rocks (57 > RMR > 42) as shown in Table 2. Most of the values are within the range of GSI = RMR–2 (bedded limestone) and GSI = RMR–4 (carbonate breccias).
UNIT
BEDDED LIMESTONE
CARBONATE BRECCIAS
Jubaila
Arab D Limestone
Arab D Breccia
Arab C Breccia
Arab ABC
Hith
Sulaiy
RMR
Strength
(MPa)
50
54
25
33
28
22
23
RQD
(%)
61
65
33
58
55
34
52
Spacing
(mm)
200–600
200–600
<60
60–200
60–200
60–200
60–200
Jcond
Persistence (m)
10–20
10–20
>20
>20
10–20
10–20
3–10
Aperture (mm)
<0.1
<0.1
0.1–1
0.1–1
0.1–1
0.1–1
0.1–1
Roughness
Rough
Rough
Slight
Slight
Slight
Slight
Slight
Infilling (mm)
Hard < 5
Hard < 5
Soft < 5
Hard < 5
Hard < 5
Soft < 5
Hard < 5
Weathering
Slight
Slight
Moderate
Slight
Slight
Moderate
Slight
Rating
20
20
12
16
17
13
18
Rating
62
65
42
56
57
46
56
Quality
Good
Good
Fair
Fair
Fair
Fair
Fair
GSI
Rating
61
63
38
53
53
40
53
3.2.2 Rock mass properties
The Generalized Hoek-Brown rock mass parameters were calculated (Fig. 7) based on the intact rock parameters (Table 2). The correlation between the intact rock properties calculated from laboratory tests (σci, Ei and mi) and the rock mass parameters calculated with RocData (σcm and Erm) using the GSI, correspond well between geotechnical units, reflecting a geotechnical quality reduction from the bedded limestone units to the brecciated formations. Consequently, a geotechnical quality decrease from the western section (bedded limestone outcrops) to the eastern section of Line 3 (brecciated rocks formations) is revealed (Fig. 1b).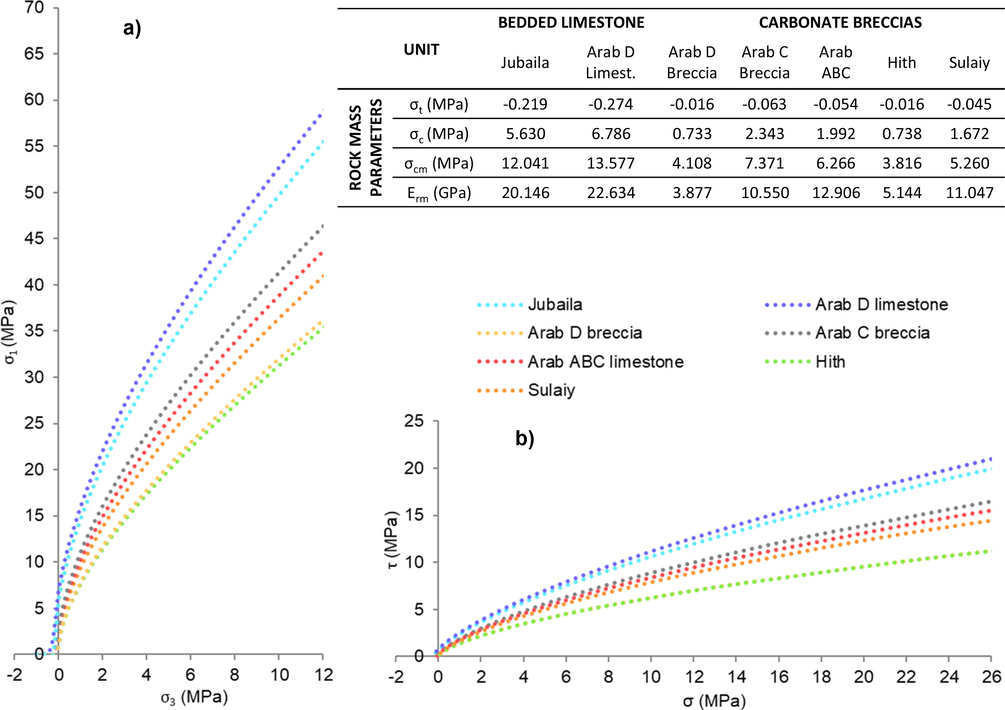
Rock mass strength parameters: a) major (σ1) versus minor principal stress (σ3); b) shear (τ) versus normal (σ) stress space. Legend: σt, uniaxial tensile strength; σc, uniaxial compressive strength; σcm, compressive strength of rock mass and Erm, deformation modulus of the rock mass.
3.2.3 Geophysical investigation
Crosshole and downhole seismic testing resulted in P-wave and S-wave velocities increase with depth, reflecting a subsurface geomechanical quality improvement. Good results were obtained for P-waves; contrastingly, S-waves signal showed poorer results and quality, mainly due to the high background noise. The undisturbed limestone units (Jubaila and Arab D limestone) generally resulted in the highest P-wave velocities (2000–3000 m/s). On the other hand, the brecciated layers (Arab C and D breccias, Arab ABC limestone, Hith and Sulaiy) usually showed lower velocities with P-wave values ranging from 1500 to 2500 m/s.
The seismic refraction tomography has resulted in P-wave velocities of 3000 to 4500 m/s for the competent calcareous bedrock composed of the Jubaila and Arab D limestone. Lower P-wave velocities (2000 to 3000 m/s) are associated with the brecciated terms of the Arab formations, Hith and Sulaiy. Comparing the P-wave velocity from seismic refraction tomography with P-wave velocity from downhole and crosshole tests, it was found that the velocities from the latter are lower. This is explained by the horizontally integrating effect of seismic refraction compared with point-based sampling of the seismic tests inside boreholes (Cueto et al., 2018b).
Finally, the electrical resistivity tomography has mainly given information about the weathering and jointing state of the rocks, with low resistivity values usually indicating more weathered or fractured zones (<200 Ωm), while the high resistivity values correspond to the solid carbonate bedrock (200–700 Ωm). The limitations of this method prevented noticeable contrast of resistivity between different geological formations, due to the similar lithological features.
3.2.4 Rock mass stiffness
The results of the 48 pressuremeter tests carried out (76 mm diameter OYO dilatometer) presented an average pressuremeter modulus of 3.7 GPa. There is a clear difference between the massive limestone unit with an average pressuremeter modulus of 7.6 GPa, and the brecciated rocks which reached an average value of 2.8 GPa (Fig. 8). An increase of pressuremeter modulus and shear modulus was observed related to the quality of the rock in terms of RQD, RMR and GSI. Comparing the elasticity modulus directly obtained from pressuremeter tests with the modulus calculated based on different geomechanical correlation equations (Fig. 8), it is evident that the latter overestimates the rock mass modulus. This overestimation is more pronounced as the value of RMR increases.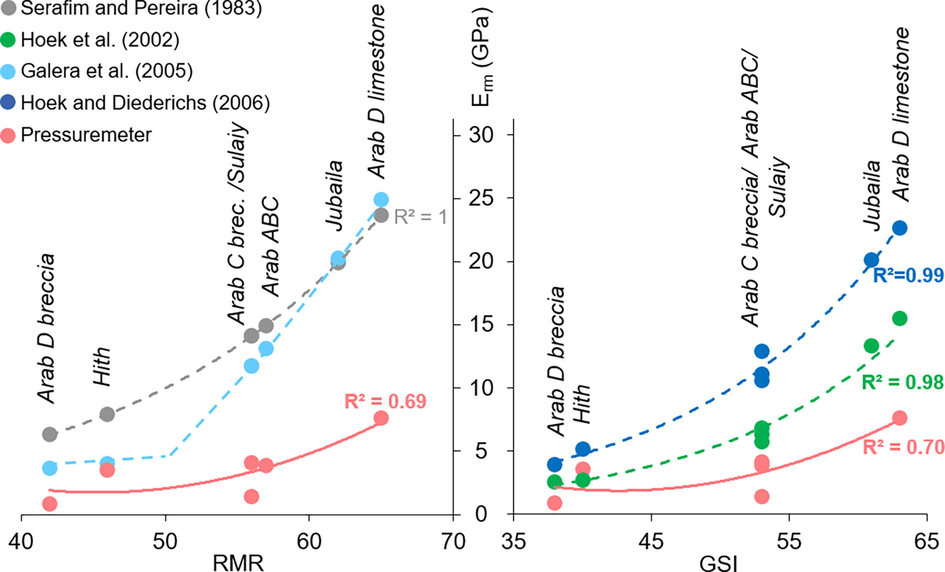
Comparison between the average rock mass modulus (Erm) estimated with empirical relationships (Serafim and Pereira 1983; Hoek et al. 2002, Galera et al. 2005, Hoek and Diederichs 2006) against average in-situ pressuremeter test results based on the calculated RMR and GSI.
The dynamic elasticity modulus obtained from the downhole and crosshole tests presented values ranging from 2 to 10 GPa, while the dynamic shear modulus varied from 1 to 4.5 GPa and the Poisson ratio resulted in values differing from 0.20 to 0.35. The average values of elasticity dynamic modulus determined along Line 3 with the seismic wave velocities for each geotechnical unit are in the range of 5 to 8 GPa, which is approximately 1 to 4 times higher than the static ones measured with pressuremeter tests. This is explained because the static moduli refer to a portion of the mass rather than the whole rock mass, and this difference is wider when the rock mass conditions are poorer (Martínez-Martínez et al., 2012). Although a trend like this is to be expected due to the different range of strains involved in a seismic excitation and in a static loading, the gap appears to be wide indeed and is presumably related to local effects of the borehole walls.
4 Conclusions
The multi-technique geological testing revealed the existence of seven geotechnical rock units, classifying most of them as calcarenitic limestone. The upper Arab members, Hith and Sulaiy presented brecciated textures due to evaporites dissolution, part of them classified as argillaceous limestones and marls. The engineering behavior shows outstanding differences between the undisturbed formations (Jubaila and Arab D limestone) which are moderate to medium strong, with high to average modulus ratio. Comparatively, the brecciated units (Arab, Hith and Sulaiy) are classified as low to moderate strength with a high modulus ratio. The latter presents potential geotechnical risks such as weak strength, karst, etc. Linear regression values among point load and uniaxial strength of 19 and 16 were obtained for the bedded and for the brecciated layers, respectively.
The undisturbed limestone units are classified as good rocks, and the brecciated as fair rocks. Thus, resulting in a geotechnical quality decrease from the west region to the east region of the city. In this regard, new investigations should be mainly focused on the eastern stretch of Line 3, which corresponds to an area with more uncertainty in terms of available surveys and potential geotechnical challenges. Good results were obtained for P-wave velocities allowing for differentiation between geotechnical units, with the reduction in velocities related to higher weathering. The values of the dynamic modulus are approximately 1 to 4 times higher than the static ones.
As infrastructure projects increase in the Riyadh area, the geotechnical investigation carried out can be utilized to assess ground-related properties and design parameters in future projects crossing the Mesozoic formations. Furthermore, it also seeks to deliver empirical correlations to obtain indirect geotechnical parameters, applicable to other urban areas crossing frameworks similar to Riyadh’s subsoil. Some correlations resulted in low coefficients of correlation (R2 < 0.8), likely associated with the brecciated nature of most of the rocks, which implies low reliability and accuracy. Thus, confirmatory geotechnical tests must always be carried out to allow a safe and reliable design, thereby optimizing the construction cost and schedule.
Acknowledgements
We would like to thank IDOM Consulting, Engineering, Architecture, S.A.U. As part of IDOM’s technical staff, a special mention to MSc. Pablo de la Puente, MSc. Sergio Mayordomo and MSc. Miguel Martin. Also, the authors gratefully acknowledge Saudi Arabia's Riyadh Development Authority and especially ArRiyadh New Mobility Consortium. Thanks are extended to Ms. Miiraf Arefeaine for her English revision.
Declaration of Competing Interest
The authors declare that they have no known competing financial interests or personal relationships that could have appeared to influence the work reported in this paper.
References
- Geomechanical Aspects and Suitability of the Limestone (Sulaiy Limestone Formation) for Foundation Bedrock, Sulaiy Region, Saudi Arabia. J. Geol. Geophys.. 2015;4:230.
- [CrossRef] [Google Scholar]
- Geotechnical assessment for the ground conditions in Makah Al-Mukarramah city, Saudi Arabia. J. King Saud Univ.-Sci.. 2020;32(3):2112-2121.
- [CrossRef] [Google Scholar]
- The relationship between lithological and geomechanical properties of tight carbonate rocks from Upper Jubaila and Arab-D Member outcrop analog, Central Saudi Arabia. Arab. J. Geosci.. 2015;8(12):11031-11048.
- [CrossRef] [Google Scholar]
- ADA (Arriyadh Development Authority), 1990. The Rising Groundwater Management Program. Volume 1: Natural Setting.
- Geotechnical assessment of near-surface sediments and their hazardous impact: Case study of Jizan city, southwestern Saudi Arabia. J. King Saud Univ.-Sci.. 2020;32(3):2195-2201.
- [CrossRef] [Google Scholar]
- Geological and geotechnical evaluation of limestone rocks along the Riyadh Metro Project (Riyadh City, Saudi Arabia) Arab. J. Geosci.. 2021;14:89.
- [CrossRef] [Google Scholar]
- Unconfined Compressive Strength and Young’s Modulus of Riyadh Limestone. Electron. J. Geotech. Eng.. 2019;24:707-717.
- [Google Scholar]
- Environmental study of Wadi Hanifah, Riyadh, with special reference to wastewater disposal and the quality of the stream water, groundwater and sediments. College Cardiff, UK: University of Wales; 2002. Ph.D Thesis
- Geological and geotechnical aspects of Saudi Arabia. Geotech. Geol. Eng.. 1994;12(4):253-276.
- [CrossRef] [Google Scholar]
- Effects of testing methods and conditions on the elastic properties of limestone rock. Eng. Geol.. 2004;74(1-2):139-156.
- [CrossRef] [Google Scholar]
- Morphotectonic development of Mesozoic carbonates and evaporites of Ath-Thumamah depression in central Arabia. Carbonates Evaporites. 2014;29(1):65-72.
- [CrossRef] [Google Scholar]
- The shear strength of rock joints in theory and practice. Rock Mech.. 1977;10(1-2):1-54.
- [Google Scholar]
- Beau, P., Maghazy, M., Chiriotti, E., 2008. Importance of geological and geotechnical upgrading for the tunnel / station interface during the TBM breakthrough on the Dubai Metro Project. World Tunnel Congress 2008. Underground Facilities for Better Environment and Safety, India.
- Estimating the strength of rock materials. S. Afr. Inst. Min. Met.. 1974;74:312-320.
- [Google Scholar]
- Engineering Rock Mass Classifications: A Complete Manual for Engineers and Geologists in Mining, Civil, and Petroleum Engineering. New York: John Wiley and Sons; 1989.
- Decoding Eurocode 7. London: Taylor & Francis; 2008.
- Point load testing of weak rocks with particular reference to chalk. Q. J. Eng. Geol.. 1998;31(2):95-103.
- [CrossRef] [Google Scholar]
- Karst Detection, Prevention and Correction: A Case Study along the Riyadh Metro Line 3 (Saudi Arabia) Proceedings. 2018;2:1429.
- [CrossRef] [Google Scholar]
- Cueto, M., Olona, J., Fernández-Viejo, G., Pando, L., López-Fernández, C., 2018b. Karst-induced sinkhole detection using an integrated geophysical survey: a case study along the Riyadh Metro Line 3 (Saudi Arabia) 3, 270–281. doi:10.3997/1873-0604.2018003.
- Engineering geological assessment using geochemical, mineralogical, and petrographic analysis along the Riyadh Metro Line 3 (Saudi Arabia) Arab. J. Geosci.. 2020;13(2)
- [CrossRef] [Google Scholar]
- Engineering classification and index properties of rock. New Mexico: Tech. Report Air Force Weapons Lab; 1966. p. :65-116.
- EN 1997-1, 2004. Eurocode 7: Geotechnical design - Part 1: General rules.
- Galera, J.M., Alvarez, M., Bieniawski, Z.T., 2005. Evaluation of the deformation modulus of rock masses: comparison of pressuremeter and dilatometer tests with RMR prediction, ISP5-PRESSIO 2005 International Symposium.
- Estaciones enterradas de la línea 3 del Metro de Riad. Estaciones profundas con contrabóveda. Hormigón y Acero. 2017;68(283):209-220.
- [CrossRef] [Google Scholar]
- Empirical estimation of rock mass modulus. Int. J. Rock Mech. Min. Sci.. 2006;43(2):203-215.
- [CrossRef] [Google Scholar]
- Hoek, E., Carranza-Torres, C., Corkum B., 2002. Hoek-Brown failure criterion. In: Proceedings of the 5th North American rock mechanics symposium and 17th Tunnelling Association of Canada: NARMS-TAC, Canada, Toronto, vol 1, 267–273.
- ISRM (International Society for Rock Mechanics), 1981. ISRM suggested methods. In: Brown ET (ed) Rock characterization testing and monitoring. Pergamon p, New York, p 211.
- “Tunnel information and analysis system”: a geotechnical database for tunnels. Geotech. Geol. Eng.. 2013;31(3):891-910.
- [CrossRef] [Google Scholar]
- Comparison of the static and dynamic elastic modulus in carbonate rocks. Bull. Eng. Geol. Environ.. 2012;71(2):263-268.
- [CrossRef] [Google Scholar]
- Three-dimensional geotechnical modeling of the soils in Riyadh city. KSA. Bull. Eng. Geol. Environ.. 2019;78(1):1-17.
- [CrossRef] [Google Scholar]
- Effect of confining pressure on the Young’s modulus of rock specimen. Chinese J. Rock Mech. Eng.. 2003;22(1):53-60.
- [Google Scholar]
- The stochastic assessment of strength and de-formability characteristics for a pyroclastic rock mass. Int. J. Rock Mech. Mining Sci.. 2009;46(3):613-626.
- [Google Scholar]
- Consideration of the Geomechanics Classification of Bieniawski. Proc. Intnl. Symp. Engng. Geol. And Underground Construction. Lisbon, Portugal, Vol. 1. Part. 1983;11:33-44.
- [Google Scholar]
- Serrano, A., 2002.“Mecánica de las rocas, I y II”. E. T. S. de Caminos, Canales y Puertos. Madrid.
- Exploration and decision-making in geotechnical engineering–a case study. Georisk. 2017;11(1):129-145.
- [CrossRef] [Google Scholar]
- UN (United Nations), 2019. World Urbanization Prospects: The 2018 Revision (ST/ESA/SER.A/420). Department of Economic and Social Affairs, Population Division. New York. United Nations.
- Natural and human-induced sinkhole hazards in Saudi Arabia: Distribution, investigation, causes and impactsAléas d’origine naturelle et humaine des dolines en Arabie Saoudite: distribution, investigation, causes et impacts. Hydrogeol. J.. 2016;24(3):625-644.
- [Google Scholar]


