

Translate this page into:
Assessment of Inter simple sequence repeat (ISSR) and simple sequence repeat (SSR) markers to reveal genetic diversity among Tamarix ecotypes
⁎Corresponding author. musarrat.ramzan@iub.edu.pk (Musarrat Ramzan)
-
Received: ,
Accepted: ,
This article was originally published by Elsevier and was migrated to Scientific Scholar after the change of Publisher.
Peer review under responsibility of King Saud University.
Abstract
Tamarix is an important genus of Tamarieaceae family, known for its medicinal importance. Its taxonomy is tricky, and a few molecular makers are available for species identification. The present study was designed to evaluate the genetic diversity among 21 Tamarix specimens collected from Thal desert, Punjab, Pakistan. Ten Inter-Simple Sequence Repeats (ISSR) and six Simple Sequence Repeats (SSR) markers were used. Results revealed that ISSR markers produced 131 bands, of which 116 were polymorphic (88.5%) with a mean Polymorphic Information Content (PIC) value of 0.34. The SSR markers yielded 30 amplified bands, of which 24 were polymorphic (80.28%) with mean PIC value of 0.35. Cluster and factorial analysis revealed a high level of genetic variability among tested Tamarix ecotypes. Dissimilarity index indicated a genetic variability among tested specimens ranging from 0.00 to 0.77. The ISSR analysis reflected that Tamarix specimens stemming from Kalurkot and Bhakkar region revealed the highest dissimilarity level with respect to the rest of the specimens.
Keywords
Thal area
Plant taxonomy
Microsatellite
Inter simple sequence repeat
Genetic diversity

1 Introduction
Tamarix, commonly known as Tamarisk or Athel Pine is an important phreatophyte. It is a genus of small family Tamaricaceae belongs to the order Caryophyllales (Vonlanthen et al., 2010). It is globally distributed as perennial shrub, mostly in salty, dry and riparian habitats. The characteristic feature of Tamarix is feathery foliage and slender branches containing small scale-like leaves (Naz et al., 2013). Tamarix is globally known for its tremendous medicinal properties. It is used to treat toothache (Kamal et al., 2009), treatment of rheumatism, and liver diseases (Marwat et al., 2009). Leaf and flower infusion of Tamarix have anti-inflammatory, stimulant, analgesic and anti-diarrheic properties (Datta et al., 2004). It is known as an interesting source of antioxidants for therapeutics, nutraceutical industries, and for food manufactures (Riadh et al., 2009). Numerous biological activities such as antiseptic (saponins and aqnthraquinones), antitumor (mucopolysaccharides), anti-inflammatory (steroids and salicylic acid), and immune regulatory activities (glucomananns) have been reported for Tamarix species. The bark of T. aphylla is an astringent tonic, which is commonly used to treat hepatitis, eczema and skin diseases like capitis, syphilis and scaly skin (Iqbal et al., 2012).
Tamarix is a halophytic species, highly resistant to abiotic stresses, particularly salinity (Wang, 2011). It is highly adapted to extreme environmental conditions and plays a vital role in rehabilitation of degraded ecosystems and provides a great help to control desertification; Abdelhamid (Abdelhamid and Chaabane, 2014) revealed that Tamarix is ubiquitous and can tolerate adverse environmental conditions such as drought, salinity and cold. It is a small family of about four genera and 110 species; in Pakistan it is represented by four genera and 35 species (Qaiser, 1981).
Genetic diversity quantifies the magnitude of genetic variability within or among populations (Hughes et al., 2008). It estimates homogeneity or heterogeneity that allows the species to adapt and persist in changing environments (Ashraf et al., 2010). Inter simple sequence repeat (ISSR) estimates the genetic relationship/variability and DNA fingerprints with a reverse and forward synthetic nucleotide primers. This technique is successfully employed in various taxonomic and genetic diversity studies (Hamza et al., 2013). Simple sequence repeat (SSR) markers are co-dominant, abundant, highly reproducible and exhibit a high degree of allelic distinction (Podani, 1997). The SSRs appear to be ubiquitous in higher organisms, though their occurrence varies among species. They are generally copious, dispersed throughout the genome, and show higher levels of polymorphism than other genetic makers (Holton et al., 2002). Yao et al. (2008) reported that among various molecular markers, ISSRs are highly reliable because of high annealing temperature and longer sequence.
Insights into genetic diversity within and among populations of Tamarix ecotypes would be helpful for breeding and conservation strategies. Conservation decisions can be made quickly on the basis of genetic diversity without considering ecological data (Ashraf et al., 2010). Genetic diversity of Tamarix species was reported for the first time from yellow river Delta (Yao et al., 2008), and it was of high level diversity. In the year 2013, Mahmood et al. (Mahmood et al., 2013) were the first one to report the genetic diversity of Tamarix species in Pakistan. They analyzed 13 salt-tolerant species by Random Amplified Polymorphic DNA (RAPD) markers. Abdelhamid and Chaabane (Abdelhamid and Chaabane, 2014) studied the effect of environmental factors on Tamarix genus with the help of molecular markers; for this study 23 genotypes were selected from three different sites and 14 specific primers were utilized. The results showed a high level of genetic divergence within and among species.
To date limited information is available on the genetic study of Tamarix throughout the world. In Pakistan also majority of research reports are regarding its phytochemical, antibacterial, and anticancerous studies. There is almost no work is reported regarding molecular and genetic studies of this genus from Pakistan. As this data will be very useful for the management of plant genetic resources, their conservation and improvement. Therefore; there is an utmost need to study the molecular and genetics variations and divergence among various species of Tamarisk present in Pakistan. Present research was designed to evaluate the genetic information as well as evolutionary relationships among Tamarix ecotypes in Pakistan. The samples were collected from seven different localities, distributed in arid the zone of District Bhakkar, Pakistan. The study will be helpful to understand the genetic diversity or similarity among and within populations.
2 Material and methods
2.1 Sample collection
Tamarix distribution in Pakistan spreads from the southern part of the Punjab province (generally known as Thal desert) to the borderline of river Indus up to Khyber Pakhtunkhwa. The District Bhakkar of Thal desert was selected for the collection of Tamarix ecotypes used in this study. Local bodies, gardeners, and marketers were interviewed to get the information regarding the distribution of Tamarix at various places. The ecotypes were selected on the basis of differences in various morphological characters, like physical appearance, branching pattern, shape, size, and stem surface. Samples were collected from their natural distributions. Plant specimens were preserved by using pressing and drying technique. The voucher specimens were deposited to the Herbarium at Department of Botany, University of Sargodha, Sub-Campus Bhakkar. A total of 21 populations were collected from the region and included in the study. Geographical location of these sites is given in the Fig. 1. Sample list is provided in Table 1.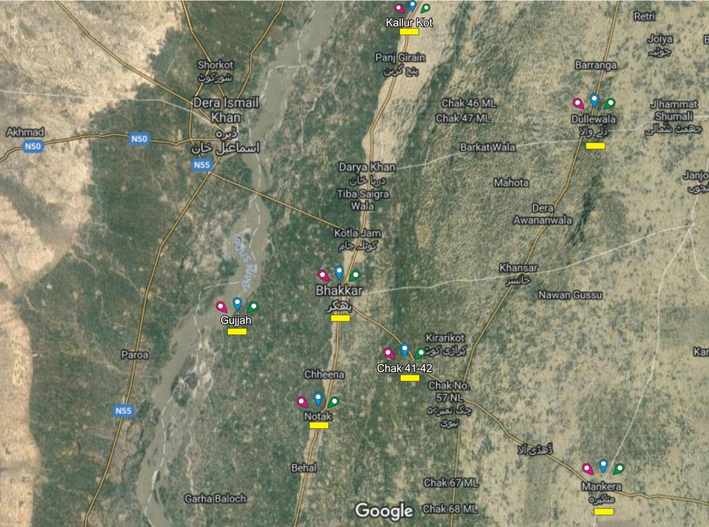
Satellite map of district Bhakkar : (yellow color showed the selected areas of sampling) indicating seven sites of sampling of Tamarix ecotypes. 1: Mankera, 2: Notak, 3: Chak 41–42, 4: Bhakkar city, 5: Gujjah, 6: Dulley wala, 7: Kallurkot.
Sr No
Sample Code
Date of collection
Location
1
S1 L
22–08-15
Kalorkot
2
S1 M
22–08-15
Kalorkot
3
S1 S
22–08-15
Kalorkot
4
S2L
20–08-15
Darya khan
5
S2 L
20–08-15
Darya khan
6
S2 S
20–08-15
Darya khan
7
S3L
20–08-15
Gujjah
8
S3 S
20–08-15
Gujjah
9
S3 S
20–08-15
Gujjah
10
S4L
22–08-15
Bhakkar
11
S4L
22–08-15
Bhakkar
12
S4S
22–08-15
Bhakkar
13
S5L
22–08-15
Mankera
14
S5M
22–08-15
Mankera
15
S5S
22–08-15
Mankera
16
S6L
23–08-15
CHAK 41–42
17
S6L
23–08-15
CHAK 41–42
18
S6S
23–08-15
CHAK 41–42
19
S7L
20–08-15
Notak
20
S7M
20–08-15
Notak
21
S7S
20–08-15
Notak
2.2 DNA extraction and polymerase chain reaction (PCR)
To extract good quality of DNA , the leaf samples were washed with tap water and tap dried. Leaves were grinded into fine powder in mortar and pestle using liquid nitrogen. The extraction buffer (1Molar Tris-Cl, 5 M NaCl, 2% CTAB,50 mM EDTA, 1% PVP, and 0.2% 2-mercaptoethanol) was preheated at 60 °C and then added to each sample and pour into falcon tubes, then incubated at 60 °C for 40 min, with continuous gentle shaking. Afterwards add 2 ml freshly prepared Chloroform: Isoamyl alcohol and invert mixed 50 times. Centrifuge at 10000 rpm for 10 min at 4 °C. Collect the supernatant, add 3 ml of ice cold Isopropanol and incubate at 4 °C for 30 min. Centrifuge the tubes again at 10000 rpm for 5 min to get the DNA pellet. The obtained DNA pellet is dissolved in 1000 µl of TE Buffer. The quality and quantity of DNA was estimated by GenWay 6315 UV/Visible spectrophotometer and genomic DNA were separated on 0.8% (w/v) agarose gel in 1x TBE buffer and stained with ethidium bromide.
The PCR reactions were carried out in a 25 ul volume containing 50 ng genomic DNA, 0.2 µM primer (synthesized from Penicons), 0.2 mM dNTPs, 1 unit DNA Taq polymerase, and 1x PCR buffer from Invitrogen. The reactions were set up in Eppendorf® 5331 Mastercycler® Gradient thermal cycler (Eppendorf, Hamburg Germany). The PCR program consisted of initial denaturation at 94 °C for 5 min, followed by 35 cycles of 30 sec denaturation at 94 °C, 40 sec annealing at the optimized annealing temperature for each primer and 45 sec primer extension at 72 °C. This was followed by a 5 min final extension at 72 °C. The amplified PCR products were separated on 2% (w/v) agarose gel in 1x TBE buffer employing constant voltage of 5 V/cm of the gel length and stained with ethidium bromide. The amplified products were run on horizontal gel (Electrophoresis apparatus BIO-RAD Wide Mini-Cell GT and BIO-RAD Sub-Cell GT).
2.3 Data scoring and statistical analysis
Alleles were binary coded as present (1) or absent (0) in each genotype and these data were used for calculation of the dissimilarity coefficient and cluster analysis. DARWIN software version 6.0.17 was used for the analysis of number and percentage of polymorphic loci. Cluster analysis based on unweight pair group method with arithmetic mean (UPGMA) was also done using the same software.
3 Results and discussion
3.1 Assessment of polymorphism by ISSR markers
A total 131 reproducible amplification products were generated with an average of 13.1 fragments per primer. Out of these, 116 were polymorphic ranging from 8 to 19 fragments per primer. The primers generated multiple fragments profiles varying from 10 to 21 bands (Table 2) with a mean of 11.6 alleles per locus. The highest number (19) of polymorphic bands were yielded by the primer ubc810, whereas least (8) were yielded by the primer ubc811 (Table 2). The size of the amplified fragments ranged from 155 to 1729 bp. The percentage range of polymorphism varied between 66.7% and 100%. The primers had a high discriminating power as observed by their Polymorphic Information content (PIC) (mean = 0.34) values. The highest PIC value was obtained with ubc808 (0.46) and the least (0.20) was noted for ubc834 (Table 2). Other population genetics parameters, i.e., marker index (MI), resolving power (RP), mean resolving power (MRP), and Shannon’s diversity index (H’) were also recorded. Average RP and MRP were 4.3 and 0.43, respectively (maximum = 6.6 for ubc857 and minimum = 2.3 for ubc808). The mean MI was 4.12 and H’ was 0.334. There was a positive correlation between the MI and PIC values (r2 = 0.813, P < 0.05) and PIC and RP (r2 = 0.615, P < 0.05). SB- No. of scored bands, PB- No. of polymorphic bands, PPB- percentage of polymorphic bands, BR- Band range, PIC-polymorphic information content, RP- Resolving power, MRP- Mean resolving power, MI-Marker Index, H’- Shannon’s diversity index
Primer code
Primer sequence
SB
PB
PPB
BR
PIC
RP
MRP
MI
H’
ubc807
AGA GAG AGA GAG AGA GT
11
10
90.9
250–1051
0.45
4.9
0.49
4.5
0.266
ubc857
ACA CAC ACA CAC ACA CAG
15
10
66.7
168–1729
0.40
6.7
0.67
4.0
0.347
ubc808
AGA GAG AGA GAG AGA GC
14
12
85.7
233–1237
0.46
2.3
0.20
5.4
0.280
ubc858
TGT GTG TGT GTG TGT GT
16
14
87.5
155–1137
0.37
6.5
0.46
5.2
0.424
ubc809
AGA GAG AGA GAG AGA GG
10
8
80.0
251–1006
0.34
2.8
0.35
2.7
0.260
ubc859
TGT GTG TGT GTG TGT GC
10
10
100.0
344–1027
0.36
4.1
0.41
3.8
0.262
ubc810
GAG AGA GAG AGA GAG AT
21
19
90.5
322–1522
0.42
6.6
0.35
8.0
0.504
ubc860
TGT GTG TGT GTG TGT GA
13
13
100.0
135–1649
0.26
3.9
0.30
3.4
0.376
ubc811
GAG AGA GAG AGA GAG AC
9
8
88.9
516–1516
0.23
2.4
0.31
1.8
0.263
ubc834
AGA GAG AGA GAG AGA GT
12
12
100
497–1424
0.20
2.8
0.24
2.4
0.360
Total
131
116
Mean
11.6
88.5
0.34
4.3
0.43
4.12
0.334
For this study 10 ISSR primers were selected and 21 samples were used to get amplified product of these primers. The ISSR profiles of certain primers exhibited unique bands. The primer ubc857 and ubc809 generated 2 unique bands, which were not matched with any other amplified bands. Similarly, ubc810 amplified a single unique band. The range of polymorphic bands and percentage polymorphism observed in the current study are similar to the findings of several researchers. Bhagyawant and Shrivastava (2008) reported that 492 bands were amplified across 12 chickpea cultivars using 7 ISSR primers. Similarly, the results of Jhuma and Nand (Datta and Nand, 2011) are in accordance with the present study that a total with 162 observed bands and loci varied from 4 to 17 per primer with an average of 7.9.
3.2 Assessment of polymorphism by SSR markers
As for this assessment 06 SSR primers were selected on the basis of available published literature and successfully get amplified products. A total 30 reproducible and score able amplification products were generated with an average of 4.0 fragments per primer. Of these, 24 were polymorphic ranging from 3 to 8 fragments per primer (Table 3). The maximum number of polymorphic bands (10) were yielded by primer TC3. The size of the amplified fragments ranged from 121 to 218 bp. The percentage range of polymorphism varied between 66.6% and 100%. The primers had a high discriminating power as observed by their PIC (mean = 0.41) values. The highest PIC value was obtained with Th715 (0.53) and the least (0.32) with TC3 (Table 3). The mean values of RP, MRP, MI, and H’ were 4.7, 1.55, 4.56 and0.352, respectively (Table 3). There was a positive correlation between MI and PIC values (r2 = 0.863, P < 0.05) and PIC and RP (r2 = 0.74, P < 0.05). SB- No. of scored bands, PB- No. of polymorphic bands, PPB- percentage of polymorphic bands, BR- Band range, PIC-polymorphic information content, RP- Resolving power, MRP- Mean resolving power, MI-Marker Index, H’- Shannon’s diversity index
Primer code
Primer sequence
SB
PB
PPB
BR
PIC
RP
MRP
MI
H’
Th321FTh321R
TACCTTGCGAACACAACTGCTACACCGAGAGAGACGCTA
3
2
66.66
121–124
0.40
6.1
3.05
8.0
0.267
Th715FTh715R
ACGTGGTTTGGTGAAAGGGCCACCCTTAACCCACTCAGA
5
4
80.0
126–136
0.53
4.5
1.12
6.2
0.36
Th1071FTh1071R
CGCTCTGTTGATCATCTTCGTGTCCCAATCCGTTACAAAA
3
3
100.0
147–166
0.37
6.6
2.2
5.2
0.24
TC1FTC1R
ATGTGGGGAGGTGGAGTGAATGTATGCAGACAAAAGT
3
3
100.0
115–121
0.46
5.3
1.76
1.8
0.33
TC3FTC3R
AAAGCAGGTGAGATTGAAACACCCTAATCCACATAAC
10
8
80.0
150–201
0.32
2.4
0.3
2.4
0.50
TC5FTC5R
GTCTGCCTAAGAAGTCGCCGGAAATAAGGGAGAAAT
6
4
66.66
186–218
0.38
3.6
0.9
3.8
0.42
Total
30
24
Average
4.0
80.28
0.41
4.7
1.55
4.56
0.352
3.3 Cluster analysis (ISSR markers)
The ISSR based dendrogram showed that Kalurkot ecotype was most genetically dissimilar and physiologically distinct, which separated from all other populations with 44% genetic distance. The dendrogram separated the populations into two major groups (I and II, Fig. 2). The first group has a single Long Branch representing Kalurkot ecotype. The Long Branch length of the Kalurkot region indicates large genetic difference between Kalurkot and neighboring Bhakkar ecotype. The phylogenetic relationships of Kalurkot fit with the known historical records of Tamarix populations. Kalurkot is located on the bank of the river Sindh, which is a fertile area. The fertility of the region probably imparted the high level of heterogeneity in the genetic makeup of Kalurkot ecotypes.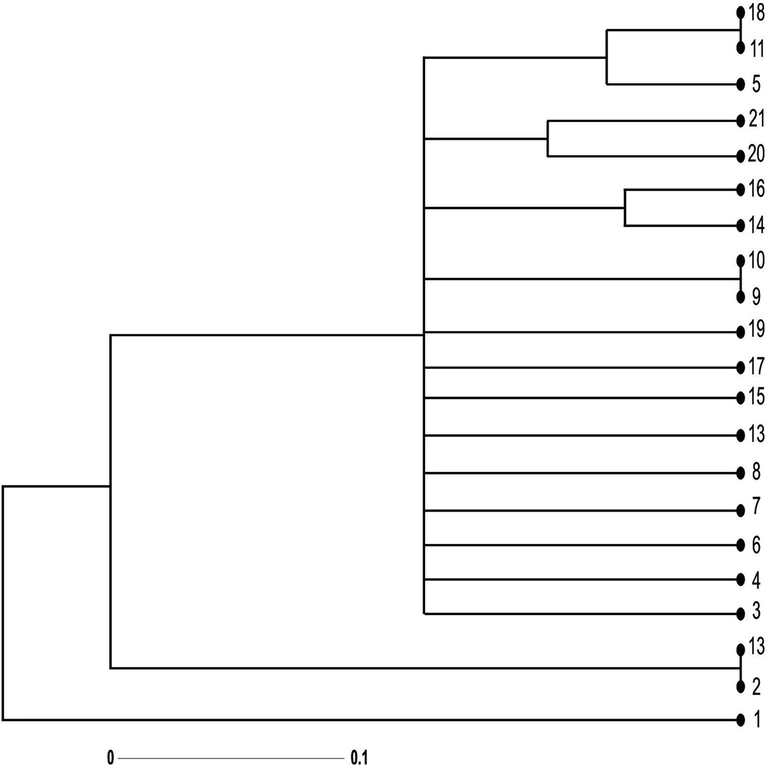
Dendrogram representing the genetic relationship among 21 Tamarix specimens obtained from seven different regions of district Bhakkar using Darwin statistical analysis (version 6.0.17) generated from ten ISSR markers. 1,2,3: Tamarix specimens of Kalurkot region, 4,5,6: Dulleywala region, 7,8,9: Gujjah region, 10,11,12: Bhakkar city region, 13,14,15: Mankera region, 16,17,18: Chak 41–42 region and 19,20,21: Notak region.
This indicates that some gene flow has been occurred between Kalurkot region and Bhakkar populations despite the geographical and cultural barriers. Moreover, it can be explained from the fact that geographically isolated individuals tend to accumulate genetic variations during the course of environmental adaptation.
The second major group is divided into two sub-groups (IIa and IIb, Fig. 2). The main Long Branch of first sub-group contains two nodes belonging to Notak and Bhakkar regions. Although these two regions are close to each other, are highly divergent from all the remaining populations of District Bhakkar. The second sub-group is further divided into three small groups (a, b and c), which represent 11 ecotypes. These 11 ecotypes formed a single cluster with 2 ecotypes from Dulleywala, 1 from Kalurkot, 3 from Gujjah, 3 from Mankera, 1 from Notak and 1 from Chak- 41/42.
The group (a) represented populations of Mankera and Chak- 41/42. These localities are extremely close to each other and grouped in similar cluster. The group (b) had the populations from Notak, which indicates that both populations are quite similar to each other and belong to a single species. This can be explained by the assumption that plants or populations located in less geographical distance produce low genetic variations. However, these two populations had high level of genetic variation compared with the populations of other regions.
The sub-group (c) contained populations stemming from Dulleywala region grouped in similar cluster of the populations belonging to Chak- 41/42 and Bhakkar city. Both regions are similar to each other showing there is no genetic difference between the regions (Fig. 3). The plant specimen in sub group IIB, thus show close relationship in terms of origin. However, the overall results revealed a little consistency between the dendrogram based on geographical distance.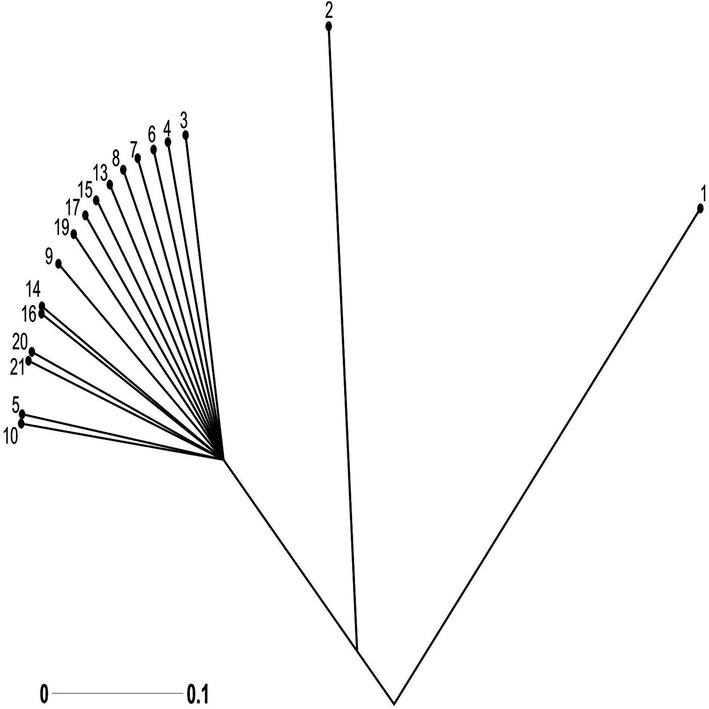
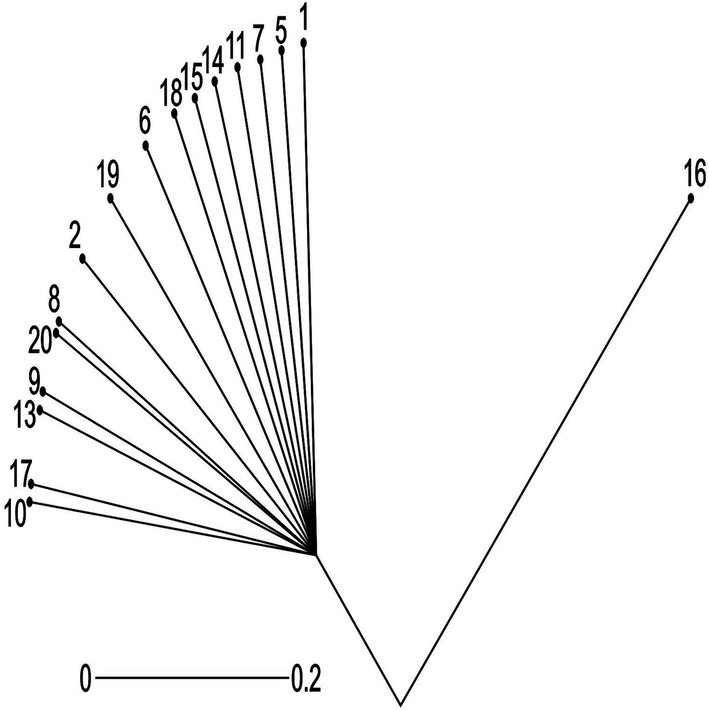
Growing from root Tree indicating the genetic relationship among 21 Tamarix specimens obtained from seven different regions of district Bhakkar using Darwin statistical analysis (version 6.0.17) generated from 10 ISSR markers. Root = 30.1,2,3: Tamarix specimens of Kalurkot region, 4,5,6: Dulleywala region, 7,8,9: Gujjah region, 10,11,12: Bhakkar city region, 13,14,15: Mankera region, 16,17,18: Chak 41–42 region and 19,20,21: Notak region.
The same results were obtained through factorial analysis. Tamarix population of Kalurkot region was most distinct and located on the negative Y-axis at the distance of 0.53 (Fig. 4). However, the ecotype of Bhakkar city area was quite different from Kalurkot and other ecotypes as it lies on 0.49 distance at X-axis. This suggests that both these ecotypes are different from rest of the ecotypes included in the study.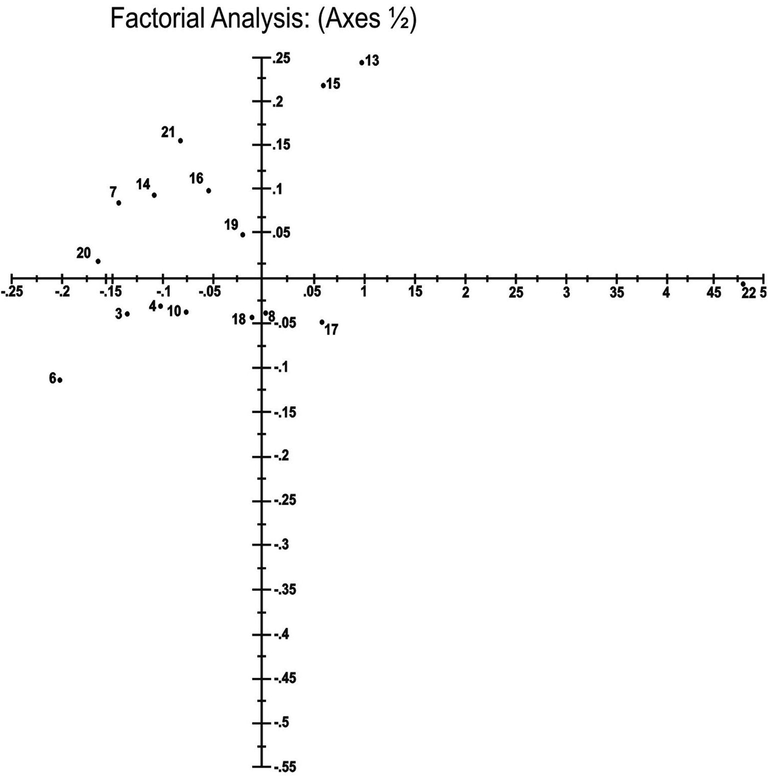
Factorial analysis indicating the genetic relationship among 21 Tamarix specimens obtained from seven different regions of district Bhakkar using Darwin statistical analysis (version 6.0.17) generated from ten ISSR markers.1,2,3: Tamarix specimens of Kalurkot region, 4,5,6: Dulleywala region, 7,8,9: Gujjah region, 10,11,12: Bhakkar city region, 13,14,15: Mankera region, 16,17,18: Chak 41–42 region and 19,20,21: Notak region.
Genetic diversity plays a significant role in species’ origin, reproduction and adaptability. Presence of substantial genetic variation between populations has been observed in the present study. A higher degree of genetic variability is an indicator of health and provide the opportunity for adaptation to environmental changes. Meng et al. (Meng et al., 2014) observed that population variation estimates based on ISSR markers were higher than the dominant marker values. The ISSR markers have proven useful in genotype recognition and gene mapping (Abbas and Asim, 2015). Our results supported by the findings of Javaid et al. (Javaid et al., 2004), who used 10 ISSR primers. Out of these, seven primers amplified the genomic DNA of D. sissoo yielding 114 fragments, of which 78 were polymorphic. Yao et al. (2008). investigated ISSR primer screening and preliminary evaluation of genetic diversity in wild populations of Glycyrrhiza uralensis. They reported that among various molecular markers, ISSRs were highly reliable because of high annealing temperature and longer sequence. Brito et al. (2016) determined the genetic diversity of Varronia curassavica Jacq. accessions using ISSR markers and found 14 polymorphic markers resulting in 149 bands with 97.98% polymorphism.
3.4 Cluster analysis (SSR markers)
The cluster tree based on SSR markers had two main clusters I and II (Fig. 5 and Fig. 6). Cluster-1 had a single long branch, while the second cluster was divided into three sub-clusters IIA, IIB and IIC.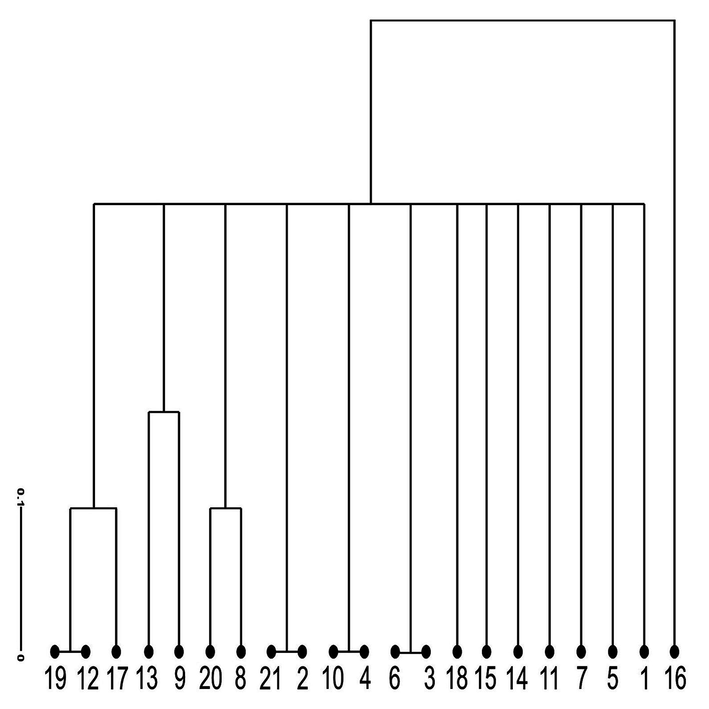
Dendrogram representing the Genetic diversityamong 21 Tamarix specimens obtained from seven different regions of district Bhakkar using Darwin statistical analysis (version 6.0.17) generated from six SSR markers. 1,2,3: Tamarix specimens of Kalurkot region, 4,5,6: Dulleywala region, 7,8,9: Gujjah region, 10,11,12: Bhakkar city region, 13,14,15: Mankera region, 16,17,18: Chak 41–42 region and 19,20,21: Notak region.
Growing from root Tree indicating the genetic relationship among 21 Tamarix specimens obtained from seven different regions of district Bhakkar using Darwin statistical analysis(version 6.0.17) generated from six SSR markers..Root = 30. 1,2,3: Tamarix specimens of Kalurkot region, 4,5,6: Dulleywala region, 7,8,9: Gujjah region, 10,11,12: Bhakkar city region, 13,14,15: Mankera region, 16,17,18: Chak 41–42 region and 19,20,21: Notak region.
The first cluster had a single Long Branch representing population stemming from Chak- 41/42. The branch length of the dendrogram indicates large genetic variation between Chak- 41/42 and neighboring population. It may be justified with the fact that Chak- 41/42 is an irrigated area as it has main water source. Moreover, fertilizers are applied to the soil that could have changed the genetic makeup of Chak- 41/42 population (Hammer et al., 2006).
The second major group was split into three subgroups (IIA, IIB and IIC Fig. 5). The first subgroup contained two root nodes belonging to Notak and Bhakkar populations, which are quite similar to each other and indicated no dissimilarity. The second subgroup was further categorized into two branches belonging to Mankera and Gujjah ecotypes. These two regions are quite different with respect to the climatic conditions. Mankera lies in arid zone, while Gujjah is a small village on the west. Western side of the district Bhakkar is riverine with Indus river flow. The similarity in genetic makeup of these two populations indicate that these populations stemmed from Bhakkar. The third subclade included ecotypes from Notak and Gujjah regions. The ecotypes belonging to the same area possesses same genetic makeup due to similar environmental conditions. The results are in line with Javed (Javaid et al., 2004), who reported that Tamarix specimens belonging to a specific area have same genetic properties.
The present study reveals that all populations collected from Bhakkar form a single large clade. However each branch is at a specific distance from other. In short populations belonging to Notak, Chak- 41/42, Gujjah, Bhkkar city, Dulleywala and Mankera are different species (Fig. 6).
The possible explanation of low genetic diversity is low polymorphism level among tested populations. These results are similar to earlier findings (Abdelhamid and Chaabane, 2014). The genetic diversity based on Nei’s gene diversity H, was high in comparison to several other Tamaricaceae species (Suo et al., 2017). In our study, many populations were located on Indus River bank, and human activities are low. Similar findings have been observed by earlier studies (Liang et al., 2019). Therefore, low disturbance is believed to be the reason of low genetic diversity. Frequent gene flow by hydrochory along Pleistocene rivers resulted in the retention of considerable genetic diversity within each population and genetic homogenization among populations of Rhododendron ripense (mean Fst: 0.111, p < 0.001) (Kondo et al., 2009). The patterns of genetic structure are caused by several historical drainage events (Zhang et al., 2011). We found that frequent gene flow resulted in low genetic differentiation among populations within sampled populations.
Genetic dissimilarity coefficient obtained by SSR markers was 0.2–1. It showed medium resolving power of SSR markers against Tamarix populations. According to the low genetic dissimilarity values, tested ecotypes are closely related to each other. These findings are in contradiction with previous studies, which evaluated certain tree species by SSR markers (Vonlanthen et al., 2010).
The same results were obtained by factorial analysis. The populations arising from Dulleywala and Mankera regions are most distinct and located on the negative Y-axis at the distance of 0.45 (Fig. 7). However, population stemming from Bhakkar city area is quite different from Kalurkot population. Populations collected from other regions of district Bhakkar were present on 0.40 distance at X-axis. This suggests that both of these specimens are different varieties from all other populations.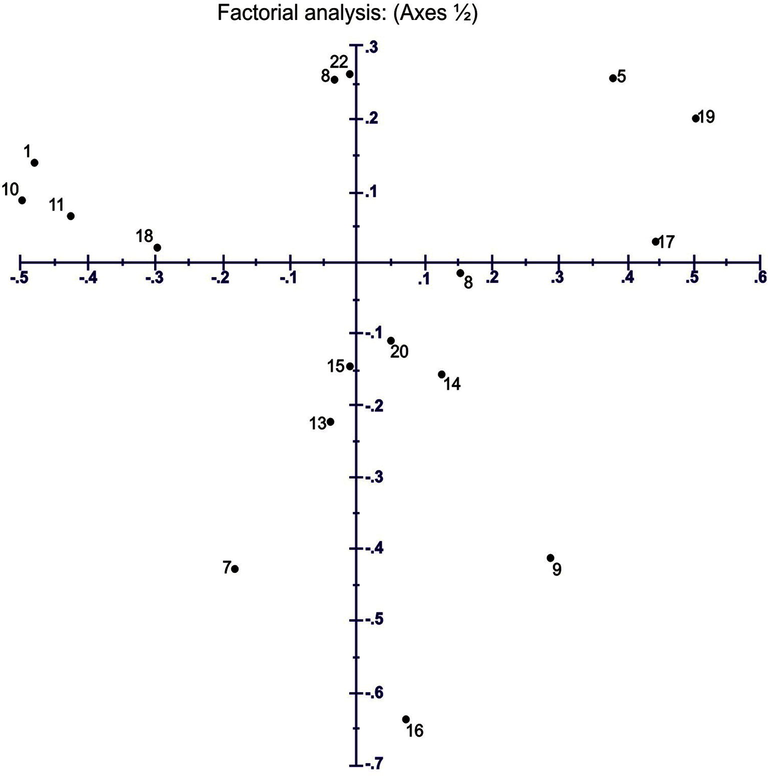
Factorial analysis indicating the genetic relationships among 21 Tamarix specimens obtained from seven different regions of district Bhakkar using Darwin statistical analysis (version 6.0.17) generated from six SSR markers.1,2,3: Tamarix specimens of Kalurkot region, 4,5,6: Dulleywala region, 7,8,9: Gujjah region, 10,11,12: Bhakkar city region, 13,14,15: Mankera region, 16,17,18: Chak 41–42 region and 19,20,21: Notak region.
3.5 Comparison polymorphism level in ISSR and SSR markers
Two types of marker were used for revealing genetic diversity among 21 populations. The results indicate that both ISSR and SSR markers showed phenomenon of polymorphism. Polymorphism percentage in ISSR and SSR markers was 88.50% and 80.28%, respectively. Number of polymorphic bands varied in both markers. The ISSR markers produced 116 polymorphic bands, while SSR markers resulted in 24 polymorphic bands (Tables 2 & 3 respectively).
The polymorphism in SSR markers varied from 66.66% to 100%. The primers ubc859, ubc860 and ubc834 recorded maximum (100%) polymorphic loci. Thus, all these primers proved best and were also reported by Hamza et al. (2013). The SSR primers also resulted in 66.6 to 100% polymorphism. The primers Th1071 and TC1 recorded maximum (100%) polymorphic loci. The comparison of both markers revealed that ISSR markers gave better results as compared to SSR markers as number of polymorphic bands indicated were higher in ISSR markers. Moreover, ISSR markers take less time and are cheap (Manimekalai et al., 2002). ISSR uses microsatellite, usually 16–25 base pairs as primer in a single primer PCR reaction targeting multiple genomic loci to amplify mainly inter SSR sequences of different sizes. However, SSR markers detect the allelic variation by repeat numbers with in a locus and one pair of SSR primer deals with one locus (Weising et al., 1992).
4 Conclusion
For the above study, the comparison of the both markers revealed that ISSR markers exhibited better results than SSR markers by generating higher number of polymorphic bands. The high genetic diversity within Tamarix ecotypes has been preserved from a conservation point of view. We observed a subsequent bottleneck event existing in ecotypes structure, indicating that a drastic decrease in population size may impact individual populations. The low genetic differences indicates that these populations should be maintained to the greatest extent possible, in order to retain their current status, especially those with greater diversity, i.e., Kalurkot should be protected as a priority for in situ conservation.
Acknowledgement
The authors extend their appreciation to the Researchers supporting project number (RSP-2020/193) King Saud University, Riyadh, Saudi Arabia. All authors also acknowledge the support and technical assistance provided by the Department of Biological Sciences, University of Sargodha, Pakistan.
Declaration of Competing Interest
The authors declare that they have no known competing financial interests or personal relationships that could have appeared to influence the work reported in this paper.
References
- Cultural globlization and its impacts on students in socio-economically backward district Bhakkar of Pakistan during 21st century. J. Siberian Federal Univers. Humanities Soc. Sci.. 2015;11:2152-2161.
- [Google Scholar]
- Determination of the effect of the environment on the genetic polymorphism in the genus of tamarix using the molecular marker simple sequence repeats “pcr-ssr” in arid areas of the khenchela region (eastern of Algeria) Int. J. Sci. Basic Appl. Res.. 2014;16(2):1-10.
- [Google Scholar]
- Ashraf M, Akram N A., Arteca R N, Foolad M R.(2010). The physiological, biochemical and molecular roles of brassinosteroids and salicylic acid in plant processes and salt tolerance. Crit. Rev. Plant Sci. 29:162-190.
- Genetic Fingerprinting of chickpea (Cicer arietinum L) germplasm using ISSR markers and their relationships. Afr. J. Biotechnol.. 2008;7(24):4428-4431.
- [Google Scholar]
- Brito1, F. A., Nizio1, D. A. C., Silva, A. V. C., Diniz, L. E. C., Rabbani, A. R. C., Arrigoni-Blank, M. F., Alvares-Carvalho, S. V., Figueira, G. M., Montanari, I. and Blank, A. F. (2016). Genet. Mol. Res. 15 (3): 678-684.
- Analgesic, antiinflamatory and CNS depressant activities of l g 2.sesquiterpenes and a flavonoide glycoside from polygonum viscosum. Pharmazie. 2004;59(3):222-225.
- [Google Scholar]
- Characterization of genetic diversity in Cicer arietinum L. and Cajanus cajan L. Millspaugh using random amplified Polymorphic DNA and Simple sequence repeat markers. Genom. Quantit. Genet.. 2011;3:30-41.
- [Google Scholar]
- Models for navigating biological complexity in breeding improved crop plants. Science. Direct.. 2006;11(12):587-593.
- [Google Scholar]
- Comparison of the effectiveness of ISSR and SSR markers in determination of date palm (Phoenix dactylifera L.) agronomic trait (2013) Am. J. Crop Sci.. 2013;7(6):763-769.
- [Google Scholar]
- Identification and mapping of polymorphic SSR markers from expressed gene sequences of barley and wheat. Mol. Breed.. 2002;9(2):63-71.
- [Google Scholar]
- Ecol. Consequ. Genet. Divers.. 2008;11(6):1461-10248.
- Comparative Efficacy of Aloe vera and Tamarix aphylla against Cutaneous Leishmaniasis. Int. J. Basic Med. Sci. Pharmacy. 2012;2(2):2049-4963.
- [Google Scholar]
- Seed storage protein electrophoresis in groundnut for evaluating genetic diversity. Pak. J. Bot.. 2004;36(1):25-29.
- [Google Scholar]
- Ethnobotanically important plants of District Bannu, Pakistan. Pakistan J. Plant Sci.. 2009;15(2):87-93.
- [Google Scholar]
- Shaping of genetic structure along Pleistocene and modern river systems in the hydrochorous riparian azalea, Rhododendron ripense (Ericaceae) Am. J. Bot.. 2009;96(8):1532-1543.
- [Google Scholar]
- Low population genetic differentiation in two Tamarix species (Tamarix austromongolica and Tamarix chinensis) along the Yellow River. Genetica. 2019;147(1):13-22.
- [Google Scholar]
- Molecular markers assisted genetic characterization of different salt tolerant plant species. J. Anim. Plant Sci.. 2013;23(5):1441-1447.
- [Google Scholar]
- Genetic diversity within an isolated olive (Olea europaea L.) population in relation to feral spread. Sci. Hortic.. 2002;94:91-105.
- [Google Scholar]
- Three woody plant species mentioned in Holy Quran and Ahadith and their ethnobotanical uses in North Westernpart (D.I. Khan) of Pakistan. Pakistan J. Nutrit.. 2009;8:542-547.
- [Google Scholar]
- Analysis of genetic diversity in Aconitum kongboense L. revealed by AFLP markers. Biochem. Syst. Ecol.. 2014;57388394
- [Google Scholar]
- Phytochemical investigations of Tamarix indica willd and Tamarix passernioides del. leaves from Pakistan. Pak. J. Bot.. 2013;45(5):1503-1507.
- [Google Scholar]
- Bevezetés a többváltozós biológiai adatfeltárás rejtelmeibe. In: Introduction in the Multivariate Biological Data Analysis. Budapest, Hungary: Scientia Publishing; 1997.
- [Google Scholar]
- Riadh K, Hanen F, Wided M, Najla T, Baya H, Kamel C, Amina B, Christian M and chedly A.(2009). Antioxidant and microbial activities of the edible medicinal halophyte Tamarix galica L. and related polyphenolic constituents. Int J. Pharmacol. 17(8): 2083-2091.
- Genetic diversity and structure of an endangered desert shrub and the implications for conservation. Aob Plants. 2017;9(3):1-10.
- [Google Scholar]
- Clonal structure and genetic diversity of three desert phreatophytes. Am. J. Bot.. 2010;97(2):234-242.
- [Google Scholar]
- Inter-simple sequence repeats (ISSR) molecular fingerprinting markers for authenticating the genuine species of rhubarb. J. Med Plants Res.. 2011;5(5):758-764.
- [Google Scholar]
- Oligonucleotide fingerprinting reveals various probe dependent levels of informativeness in chickpea. Genome. 1992;35:436-442.
- [Google Scholar]
- ISSR primer screening and preliminary evaluation of genetic diversity in wild populations of Glycyrrhiza uralensis. Biology Plantarum.. 2008;52(1):117-120.
- [Google Scholar]
- Chloroplast phylogeography of Terminalia franchetii (Combretaceae) from the eastern Sino-Himalayan region and its correlation with historical river capture events. Mol. Phylogenet. Evol.. 2011;60(1):1-12.
- [Google Scholar]


