

Translate this page into:
Assessment of heavy metals pollution in seawater and sediments in the Arabian Gulf, near Dammam, Saudi Arabia
⁎Corresponding author. mushahid@ksu.edu.sa (Shahid Mahboob)
-
Received: ,
Accepted: ,
This article was originally published by Elsevier and was migrated to Scientific Scholar after the change of Publisher.
Peer review under responsibility of King Saud University.
Abstract
Anthropogenic activities, urban and industrial wastewaters, and the usual disintegration of rock from physical, chemical, and biological stresses are the main cause of heavy metals in seawater and sediments worldwide. Five different sampling locations were selected after an initial survey of the Dammam region Seawater study area, and sediment samples were procured in triplicate from each location to assess the level of selected heavy metals pollutions in the Arabian Gulf, Dammam, Saudi Arabia. Be, Cr, Ni, Cu, As, Se, Ag, Cd, Pb, Hg, Co, Zn, Fe, Mn, Sr, and Mo were detected using “inductively coupled plasma mass spectrometer (ICP-MS).” The pH ranges from 7.91 ± 0.26–8.22 ± 0.38 in stations 4 and 3, respectively. Surface seawater's electrical conductivity values ranged from 71788 ± 28.52 to 75680 ± 42.92 µS/cm at stations 4 and 3. The minimum and maximum concentration of total dissolved solid was observed as 49524 ± 50.25 and 54786 ± 66.95 mgL-1 in sites 4 and 3, respectively. The level of these metals fluctuated among the sampling sites. The highest concentration of these heavy metals was recorded from sampling site 4 and minimum in location 1. The average level of these metals in water samples were recorded Sr > Cu > Se > Zn > As > Mn > Fe > Ni > Mo > Hg > Co > Cr > Ag > Cd > Pb and Be, respectively. The average level of these metals in sediment samples were recorded Fe > Sr > Ni > Mn > Cu > Cr > Zn > Pb > Ag > As > Mo > Co > Se > Hg > Be and Cd, respectively. It has been concluded that the concentration of As, Hg, Cd, Cr, Cu, Fe, and Sr was high, which is alarming, particularly in the Dammam area.
Keywords
Electrical conductivity
Heavy metals
Sediments
Total dissolved solids
Water

1 Introduction
Heavy metal contamination in marine environments has emerged as a critical factor and emerging global environmental issue as it poses a threat to marine life (Qian et al., 2015). Anthropogenic activities, urban and industrial wastewaters, and the usual disintegration of rock from physical, chemical, and biological stresses cause heavy metals in the coastal waters (Alharbi and El-Sorogy, 2017) worldwide. Expeditious urbanization and industrialization has resulted in a rise in the level of heavy metal pollution along the coasts of Saudi Arabia situated in the Arabian Peninsula (El-Sorogy et al., 2018; Mahboob et al., 2014).
Dammam, “a major metropolis that thrives on its coastal location is situated at the central part of the Saudi Arabian Gulf, between latitudes 26 28 01–27 07 09 N and longitudes 49 34 19–50 04 34E” (Alharbi et al., 2017; El-Sorogy et al., 2018). The coastlines of the Arabian Gulf, particularly in the eastern region of the Kingdom, have been rapidly developed and modified. The development along the coastal area for industrialization, urbanization, and recreational purposes has increased contamination due to the discharge of untreated waste from multiple sources in the Arabian Gulf (Sheppard et al., 2010; Naser, 2013). The anthropogenic contaminants into the territorial waters from the city include sewage wastewaters, “landfilling because of seaside framework advancement, oil spills, petrochemical sectors” etc. (El-Sorogy et al., 2018). The heavy metal pollution status of the Arabian Gulf has been reviewed (Freije, 2013). It focuses on the fact that the region is arid and experiences elevated temperatures and high evaporation rates that lead to intensified contamination and the persistence of metals in the ecosystem due to the lower dilution and slow dispersion rates. Metals in the coastal waters and sediments harm the ecosystem and the biota due to their bioaccumulation potency that addresses concerns on human health (Sharifuzzaman et al., 2016). The metal pollution could also affect the socio-economic structure of the region as seafood which includes both fish and shrimps, is of value in the Arabian Gulf in terms of domestic consumption and international trade (Freije, 2015; Hussain et al., 2020). Also, Saudi Arabia, an arid country, depends on seawater to obtain potable water via desalination for domestic and industrial use. Thus, it is imperative to maintain a healthy aquatic atmosphere in the area by constantly examining the present status and spatial circulation of heavy metals in the sediments and seawater. In addition, it is essential to recognize the potential point/ non-point sources of metal contamination in the region and to have a comparative assessment of the level of pollution concerning the other coastal areas of the world. The data on the risks and effects of metal contamination on human health in the Arabian Gulf is minimal and needs to be well addressed to get baseline information. This subsequently would help frame and plan coastal management guidelines, legislations, and strategies to conserve and enhance the ecological value of the coastline.
With this premise, the present study was aimed to determine the level of heavy metals (Be, Cr, Ni, Cu, As, Se, Ag, Cd, Pb, Hg, Co, Zn, Fe, Mn, Sr, and Mo) pollution in the coastal waters and sediments in the Arabian Gulf, near Dammam, Saudi Arabia to generate the information to devise the strategies for surveillance to decrease the pollution load.
2 Materials and methods
2.1 Sites for sample collection
Five different sampling locations were selected after the initial survey of the study area of the Dammam region (Uqair 25° 38′ 20.99″ N, 50° 12′ 31.20″ E; Half Moon 26.0786° N, 50.0393° E; Al-Aziziyah 26.4574° N, 50.0718° E; Saihat Qatif 26.4889° N, 50.0282° E and Tarut Island 26.571°N 50.056°E) as shown in Fig. 1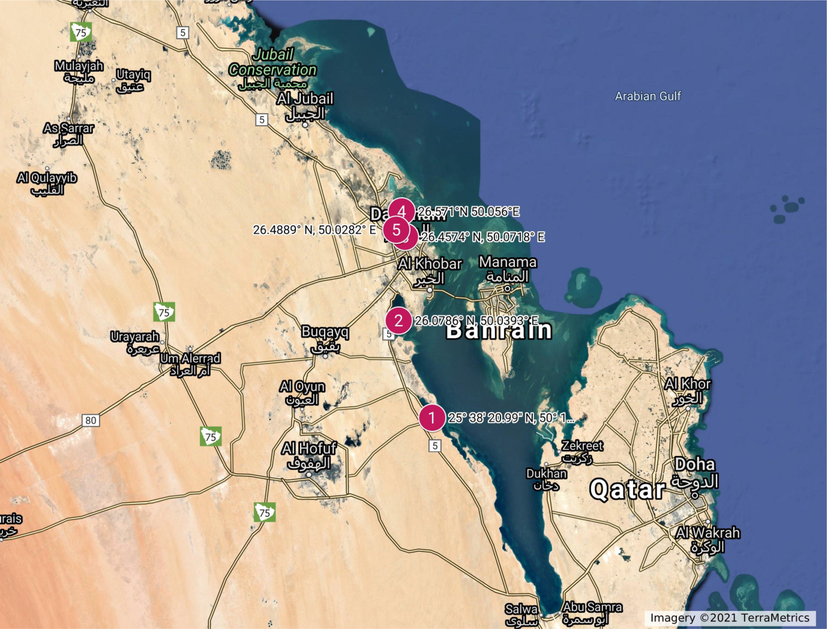
Map of study area indicating different sampling locations (1: Uqair; 2: Half-moon; 3: Al-Aziziyah; 4: Tarut; 5: Saihat Qatif) and transported to the water laboratory for further chemical analysis”.
2.2 Sample collection
Fifteen surface seawater samples were collected from the sub-tidal zone of five different locations, as mentioned earlier. “The water samples were collected from the sampling sites in clean polyethylene bottles. Salinity as well as pH were figured out straight in situ using a mobile electronic pH meter (Orion Research model 210) and a Beckman Induction Salinometer (version RS-7C), respectively. Unfiltered samples were collected in 1-l pre-acidified polyethylene containers kept in an icebox (at 4 °C), and transported to the water laboratory for further chemical analysis”.
Coastal sediment samples (from 1 to 30 cm deep) were collected from five pre-determined five different locations in triplicate and mixed to make a composite sample. “The samples were stored in clean polyethylene bags until metals analysis was performed. Grain size analysis was determined according to Folk (1974). A composite sample was taken, dried, sieved, and then homogenized to a fine powder in a mortar. A 100 mg sediment sample was prepared into dry and clean Teflon microwave digestion vessels, 2 ml of HNO3, 6 ml HCl and 2 ml HF were added to the vessels. The samples were digested using a scientific microwave (Model Milestone Ethos 1600). The digested sample was transferred to a 15 ml plastic volumetric tube and made up to mark using deionized water. A blank digest was carried out in the same way“ (Folk, 1974).
2.3 Determination of metal concentrations
Analysis of selected heavy metals viz., Beryllium (Be), chromium (Cr), nickel (Ni), copper (Cu), arsenic (As), selenium (Se), silver (Ag), cadmium (Cd), lead (Pb), mercury (Hg), cobalt (Co), zinc (Zn), iron (Fe), manganese (Mn), strontium (Sr), and molybdenum (Mo) was carried out by ICP-MS (Inductive Coupled Plasma-Mass Spectrometer, Thermo Fisher Scientific, Instrument) at the Central Laboratory in King Saud University, Riyadh. The external calibration was carried out by using a multi-elements standard of 10 ppm concentration (ultra-scientific analytical solution). “Each sample was analyzed in triplicates. Be, Cr, Ni, Cu, As, Se, Ag, Cd, Pb, Hg, Co, Zn, Fe,Mn, Sr, and Mo calibration curves were obtained using the blank and three working standards 0, 50, 100, and 200 μg/L. It started from a 100 mg/L multielement standard solution for ICP-MS (Panreac, 766333. 1208). Calibration curves showed an excellent linearity for all elements”.
2.4 Statistical analysis
The data are expressed as the means ± standard error of the mean (SEM). Pearson's correlation coefficient was worked out as statistical analyses, using SPSS 16.0 statistical software and Microsoft Excel 2016. P ≤ 0.05 was considered as a level of significance for the interpretation of results.
3 Results discussions
The pH ranges from 7.91 ± 0.26–8.22 ± 0.38 in stations 4 and 3, respectively. Surface seawater's electrical conductivity values ranged from 71788 ± 28.52 to 75680 ± 42.92 µS/cm at stations 4 and 3, respectively (Table 1). The minimum and maximum concentration of total dissolved solid was observed as 49524 ± 50.25 and 54786 ± 66.95 mgL-1 in sites 4 and 3, respectively (Table 1).
Sites No.
Location
pH
Electrical Conductivity (EC) μS/cm
Total dissolved solids (TDS) mg/L
1
26.0786° N, 50.0393° E
7.96 ± 0.24
72466 ± 22.54
49687 ± 33.62
2
26.4574° N, 50.0718° E
8.13 ± 0.29
73787 ± 35.64
51262 ± 42.54
3
26.4889° N, 50.0282° E
8.22 ± 0.38
75680 ± 42.92
54786 ± 66.95
4
26.571°N 50.056°E (Tarut)
7.91 ± 0.26
71788 ± 28.52
52687 ± 54.33
5
25° 38′ 20.99″ N, 50° 12′ 31.20″ E
8.05 ± 0.41
73112 ± 31.66
52687 ± 54.33
Be, Cr, Ni, Cu, As, Se, Ag, Cd, Pb, Hg, Co, Zn, Fe, Mn, Sr, and Mo concentration in water samples collected from different sampling sites is presented in Table 2. The concentration of these heavy metals fluctuated among the sampling sites. The highest concentrations of these heavy metals were recorded in sampling site 4 and at least in location 1. The average level of these metals in water samples were recorded Sr > Cu > Se > Zn > As > Mn > Fe > Ni > Mo > Hg > Co > Cr > Ag > Cd > Pb and Be, respectively (Table 2). Sr and Copper exhibit fluctuated values within in the study area and ranged as 250.66 ± 6.33–209.36 ± 3.39; 121.33 ± 6.68 and 68.77 ± 2.88 µg L-1 as maximum and minimum in the water samples procured from the location 4 and 1, respectively (Table 2; Figs. 2a, 2b, 2c). The minimum concentration of Se, Zn, As, Mn, Fe, Ni, and Mo was recorded as 44.66 ± 3.45, 28.22 ± 2.35, 21.07 ± 1.19, 8.72 ± 1.06, 4.60 ± 0.55, 2.84 ± 0.33 and 2.16 ± 0.18 µg L-1. The maximum concentration of Se, Zn, As, Mn, Fe, Ni, and Mo was recorded as 51.69 ± 4.42, 34.17 ± 3.59, 24.61 ± 2.39, 11.20 ± 2.03, 5.95 ± 0.82, 3.95 ± 0.66 and 2.95 ± 0.49 µg L-1. The minimum concentration of Hg, Co, Cr, Ag, Cd, Pb and Be was recorded as 0.84 ± 0.15, 0.78 ± 0.11, 0.34 ± 0.06, 0.00, 0.000, 0.000 and 0.000 µg L-1, respectively. The maximum concentration of Hg, Co, Cr, Ag, Cd, Pb and Be was recorded as 1.13 ± 0.22, 1.02 ± 0.21, 0.51 ± 0.11, 0.003 ± 0.00, 0.003 ± 0.00, 0.002 ± 0.00, 0.01 µg L-1, respectively (Table 2; Figs. 2a, 2b and 2c). The studied metals were categorized into two groups. The first group (Be, Cr, Ni, Ag, Cd, Pb, Hg, Co, Fe, Mn, and Mo) and the second group includes Cu, As, Zn, and Sr. These findings were substantiated by Pearson's correlation coefficient (Table 3). Negative correlations were noticed among Sr and many metals such as Cr, Pb, As Co, and Zn. This study observed negative correlations between Zn and Be, Cu, As, Cd, Pb, and Co (Table 3). A negative correlation was also recorded between Pb and Be.Fig. 3a. Beryllium (Be), chromium (Cr), nickel (Ni), copper (Cu), arsenic (As), selenium (Se), silver (Ag), cadmium (Cd), lead (Pb), mercury (Hg), cobalt (Co), zinc (Zn), iron (Fe), manganese (Mn), strontium (Sr), and molybdenum (Mo). Beryllium (Be), chromium (Cr), nickel (Ni), copper (Cu), arsenic (As), selenium (Se), silver (Ag), cadmium (Cd), lead (Pb), mercury (Hg), cobalt (Co), zinc (Zn), iron (Fe), manganese (Mn), strontium (Sr), and molybdenum (Mo).
Sites No.
Be
Cr
Ni
Cu
As
Se
Ag
Cd
Pb
Hg
Co
Zn
Fe
Mn
Sr
Mo
1
0.00
0.34 ± 0.06
2.84 ± 0.33
48.77 ± 2.88
21.07 ± 1.19
44.66 ± 3.45
0.00
0.00 ± 0.00
0.00±
0.84 ± 0.15
0.78 ± 0.11
28.22 ± 2.35
4.60 ± 0.55
8.72 ± 1.06
209.36 ± 3.39
2.16 ± 0.18
2
0.00
0.33 ± 0.04
3.08 ± 0.44
114.80 ± 5.28
22.78 ± 2.08
48.06 ± 3.85
0.00
0.00 ± 0.00
0.00±
0.95 ± 0.21
0.91 ± 0.12
30.11 ± 3.08
4.98 ± 0.41
9.24 ± 1.28
234.67 ± 4.79
2.44 ± 0.21
3
0.001
0.45 ± 0.07
3.69 ± 051
119.22 ± 7.28
23.66 ± 2.33
50.01 ± 4.34
0.002 ± 0.00
0.001 ± 0.00
0.001 ± 0.00
0.98 ± 0.18
0.99 ± 0.09
32.19 ± 2.86
5.67 ± 0.71
10.36 ± 1.32
247.92 ± 5.56
2.78 ± 0.44
4
0.01
0.51 ± 0.11
3.95 ± 0.66
121.33 ± 6.68
24.61 ± 2.39
51.69 ± 4.42
0.003 ± 0.00
0.003 ± 0.00
0.002 ± 0.00
1.13 ± 0.22
1.02 ± 0.21
34.17 ± 3.59
5.95 ± 0.82
11.20 ± 2.03
250.66 ± 6.33
2.95 ± 0.49
5
0.00
0.33 ± 0.03
2.96 ± 0.44
77.86 ± 5.72
21.89 ± 1.95
46.34 ± 3.88
0.00
0.00
0.00
0.89 ± 0.16
0.83 ± 0.20
29.21 ± 2.77
4.77 ± 0.66
8.88 ± 1.16
236.54 ± 5.95
2.23 ± 0.22
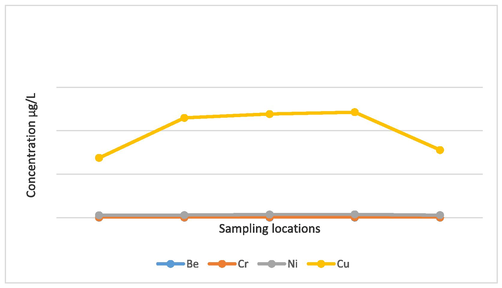
Average concentration of Be, Cr, Ni and Cu in water samples from Arabian Gulf.
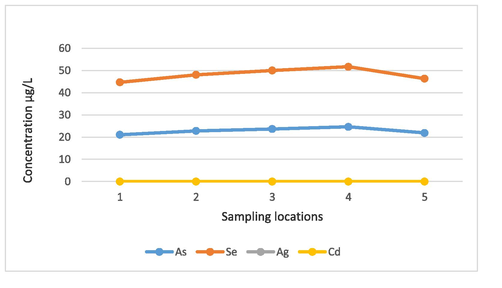
Average concentration of As, Se, Ag and Cd in water samples from Arabian Gulf.
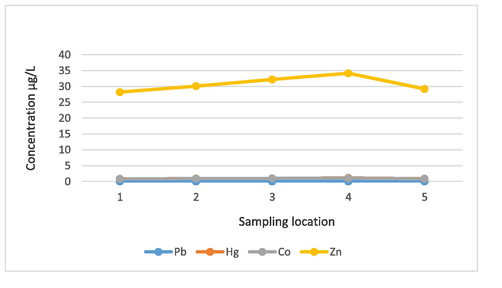
Average concentration of Pb, Hg, Co and Zn in water samples from Arabian Gulf.
pH
EC μS/cm
TDS (mg/L)
Be
Cr
Ni
Cu
As
Se
Ag
Cd
Pb
Hg
Co
Zn
Fe
Mn
Sr
Mo
pH
1
EC μS/cm
−0.348
1
TDS (mg/L)
−0.355
−0.367
1
Be
−0.248
−0.255
−0.311
1
Cr
0.166
−0.271
−0.271
0.117
1
Ni
0.216
−0.627
−0.641
−0.315
0.498
1
Cu
−0.044
−0.368
−0.368
0.155
0.406
0.490
1
As
0.178
−0.292
−0.328
−0.121
0.471
0.523
0.317
1
Se
0.312
−0.495
−0.514
−0.358
0.349
0.458
0.522
0.392
1
Ag
0.385
−0.117
−0.160
0.095
0.288
0.305
0.366
0.319
1
Cd
−0.081
−0.439
−0.464
−0.092
0.518
0.825
0.414
0.398
0.482
0.412
1
Pb
0.297
−0.668
−0.690
−0.188
0.609
0.694
0.556
0.817
0.477
0.398
0.517
1
Hg
0.212
−0.769
−0.782
−0.387
0.654
0.772
0.347
0.419
0.427
0.318
0.471
−0.224
1
Co
0.177
−0.649
−0.621
−0.259
0.590
0.815
0.567
0.871
0.690
0.494
0.765
−0.168
−0.269
1
Zn
0.191
−0.669
−0.695
−0.287
0.551
0.859
−0.918
−0.487
0.338
0.544
−0.796
−0.186
0.311
−0.485
1
Fe
−0.118
0.486
0.511
0.533
0.611
−0.266
0.188
0.224
0.317
0.411
−0.115
−0.096
0.105
−0.387
0.424
1
Mn
0.310
−0.634
−0.662
−0.095
0.470
0.445
0.521
0.496
0.558
0.611
0.617
−0.196
0.189
−0.119
-0.0.108
−0.338
1
Sr
−0.044
−0.445
−0.468
0.077
−0.549
0.706
0.691
−0.567
0.415
0.602
−0.489
0.289
0.314
−0.544
−0.495
−0.114
0.256
1
Mo
0.192
−0.697
−0.521
−0.267
0.585
0.739
0.706
0.598
0.482
0.742
0.685
−0.305
0.418
−0.279
0.275
0.312
0.402
0.118
1
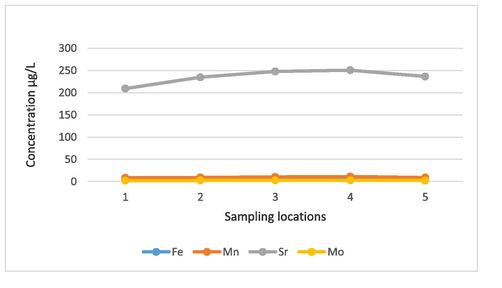
Average concentration of Fe, Mn, Sr and Mo in water samples from Arabian Gulf.
The concentration of Be, Cr, Ni, Cu, As, Se, Ag, Cd, Pb, Hg, Co, Zn, Fe, Mn, Sr, and Mo in sediment samples collected from different sampling sites of the Arabian Gulf, Dammamis presented in Table 4. The concentration of these heavy metals in sediment samples fluctuated among the sampling sites. The highest concentrations of these heavy metals were recorded in sampling site 4 and at least in location 1. The average level of these metals in sediment samples were recorded Fe > Sr > Ni > Mn > Cu > Cr > Zn > Pb > Ag > As > Mo > Co > Se > Hg > Be and Cd, respectively (Table 4; Figs. 3b, 4a. 4b). Fe, Sr, Ni, Mn, Cu, and Cr were more abundant, and their concentrations were ranged as 12985 ± 108.21 and 11252 ± 69.81; 2891.23 ± 49.61 and 2654.07 ± 22.61; 398.22 ± 3.52 and 200.49 ± 2.44; 245.99 ± 4.19 and 221.34 ± 3.61; 120.51 ± 3.71 and 61.63 ± 2.61and 109.66 ± 5.28 and 48.32 ± 2.44 µg g−1 as maximum and minimum in the sediment samples procured from the location 4 and 1, respectively (Table 4; Figs. 3b, 4a. 4b). The minimum concentration of Fe, Sr, Ni, Mn, Cu, and Cr was recorded as 11252 ± 69.81, 2654.07 ± 22.61, 200.49 ± 2.44, 221.34 ± 3.61, 61.63 ± 2.61, 48.32 ± 2.44 µg g−1 from sampling site 1. The maximum concentration of Be, As, Se, Ag, Cd, Pb, Hg, Co, Zn and Mo was recorded as 0.91 ± 0.11, 39.88 ± 2.48, 3.02 ± 0.60, 42.93 ± 1.25, 0.82 ± 0.05, 49.23 ± 1.25, 1.69 ± 0.05,10.69 ± 1.33, 85.69 ± 3.75 and 16.55 ± 1.42 µg g−1 from location 4, respectively. The minimum concentration in sediments samples in Be, As, Se, Ag, Cd, Pb, Hg, Co, Zn and Mo was recorded as 0.52 ± 0.07, 24.45 ± 1.76, 0.56 ± 0.09, 31.10 ± 1.25, 0.38 ± 0.06, 29.37 ± 1.95, 1.01 ± 0.01,7.77 ± 1.41, 71.62 ± 2.95 and 12.35 ± 1.17 µg g−1 from location 1, respectively (Table 4 Figs. 3b, 4a. 4b). The studied metals were categorized into two groups. The correlation matrix was worked out for the heavy metals recorded in sediments and exhibited different trends (Table 5). Some of the metals showed a negative correlation with each other. Beryllium (Be), chromium (Cr), nickel (Ni), copper (Cu), arsenic (As), selenium (Se), silver (Ag), cadmium (Cd), lead (Pb), mercury (Hg), cobalt (Co), zinc (Zn), iron (Fe), manganese (Mn), strontium (Sr), and molybdenum (Mo). Beryllium (Be), chromium (Cr), nickel (Ni), copper (Cu), arsenic (As), selenium (Se), silver (Ag), cadmium (Cd), lead (Pb), mercury (Hg), cobalt (Co), zinc (Zn), iron (Fe), manganese (Mn), strontium (Sr), and molybdenum (Mo).
Sites No.
Be
Cr
Ni
Cu
As
Se
Ag
Cd
Pb
Hg
Co
Zn
Fe
Mn
Sr
Mo
1
0.52 ± 0.07
48.32 ± 2.66
200.49 ± 2.44
51.63 ± 2.61
24.45 ± 1.76
0.56 ± 0.09
31.10 ± 1.25
0.38 ± 0.06
29.37 ± 1.95
1.01 ± 0.01
7.77 ± 1.41
71.624 ± 2.95
11252 ± 69.81
221.34 ± 3.61
2654.07 ± 22.61
12.35 ± 1.17
2
0.61 ± 0.05
58.66 ± 3.15
201.97 ± 2.60
67.65 ± 2.77
29.57 ± 1.02
1.67 ± 0.31
35.51 ± 1.63
0.47 ± 0.0.02
36.14 ± 1.98
1.28 ± 0.28
8.27 ± 1.48
77.33 ± 3.44
11768 ± 71.92
232.11 ± 3.71
2698.06 ± 35.64
13.11 ± 1.33
3
0.87 ± 0.08
106.58 ± 4.48
387.73 ± 3.19
177.58 ± 4.14
37.47 ± 1.11
2.67 ± 0.0.55
40.97 ± 2.09
0.77 ± 0.06
47.67 ± 1.18
1.47 ± 0.22
9.79 ± 1.28
82.35 ± 3.75
12234 ± 85.98
240.85 ± 3.95
2716.12 ± 32.61
14.69 ± 1.26
4
0.91 ± 0.11
109.66 ± 5.28
398.22 ± 3.52
220.51 ± 3.71
239.88 ± 2.48
3.02 ± 0.60
42.93 ± 2.44
0.82 ± 0.05
49.23 ± 1.25
1.69 ± 0.05
10.69 ± 1.33
85.69 ± 3.66
12985 ± 108.21
245.99 ± 4.19
2891.23 ± 49.61
16.55 ± 1.42
5
0.58 ± 0.06
50.26 ± 2.66
222.92 ± 4.08
72.66 ± 3.07
32.45 ± 1.92
0.79 ± 0.06
33.22 ± 1.82
0.41 ± 0.02
32.55 ± 1.71
1.18 ± 0.09
8.86 ± 1.06
78.92 ± 2.98
11885 ± 10.2.35
228.79 ± 3.95
2670.25 ± 29.82
12.69 ± 1.09
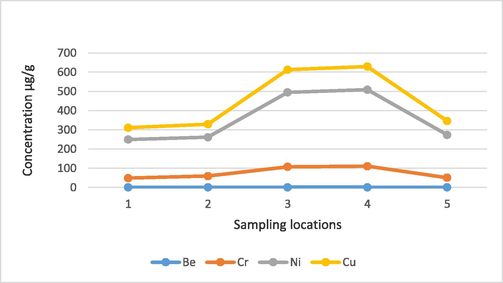
Average concentration of Be, Cr, Ni and Cu in sediment samples from Arabian Gulf.
pH
EC μS/cm
TDS (mg/L)
Be
Cr
Ni
Cu
As
Se
Ag
Cd
Pb
Hg
Co
Zn
Fe
Mn
Sr
Mo
pH
1
EC μS/cm
−0.379
1
TDS (mg/L)
−0.391
−0.402
1
Be
−0.290
−0.306
−0.360
1
Cr
0.190
−0.302
−0.295
0.160
1
Ni
0.244
−0.690
−0.675
−0.349
0.533
1
Cu
−0.160
−0.402
−0.411
0.197
0.451
0.522
1
As
0.244
−0.316
−0.332
−0.170
0.544
0.570
0.380
1
Se
0.393
−0.559
−0.560
−0.430
0.438
0.527
0.587
0.4601
1
Ag
0.411
−0.139
−0.148
0.127
0.366
0.370
0.392
0.350
0.452
1
Cd
−0.125
−0.468
−0.495
−0.121
0.550
0.860
0.440
0.424
0.522
0.447
1
Pb
0.328
−0.695
−0.676
−0.248
0.671
0.712
0.580
0.841
0.492
0.432
0.538
1
Hg
0.252
−0.788
−0.791
−0.631
0.672
0.790
0.369
0.433
0.454
0.341
0.496
−0.275
1
Co
0.191
−0.672
−0.681
−0.280
0.613
0.842
0.581
0.892
0.702
0.541
0.782
−0.190
−0.280
1
Zn
0.218
−0.693
−0.686
−0.312
0.585
0.880
0.931
0.509
0.360
0.580
0.818
−0.224
0.344
0.445
1
Fe
−0.133
0.529
0.518
0.542
0.635
−0.280
0.208
0.256
0.344
0.450
−0.140
−0.116
0.133
−0.429
0.451
1
Mn
0.360
−0.655
−0.670
−0.134
0.496
0.470
0.544
0.526
0.570
0.640
0.662
−0.260
0.240
−0.165
-0.0.144
−0.376
1
Sr
−0.112
−0.470
−0.461
0.128
0.561
0.733
0.740
0.580
0.444
0.653
0.249
0.322
0.351
−0.302
−0.238
−0.160
0.288
1
Mo
0.235
−0725
−0.711
−0.297
0.619
0.802
0.741
0.629
0.516
0.770
0.694
−0.356
0.449
−0.329
0.311
0.360
0.451
0.160
1
Water pollution is a significant concern of a majority of countries. It severely affects the lives of the people and aquatic fauna. It is necessary to identify the sources of pollution to effectively overcome this great environmental challenge (Freije, 2013; Hussain et al., 2020). Sewage, including organic matter, human and animal by-products, is one of the major water pollutants in urban and rural areas. Sewage often contains organic matter that encourages microbial growth. These microbes not only cause diseases but also consume all oxygen in the water bodies. Industrial effluents contain a variety of toxicants inducing a wide range of toxic effects. In general, the higher concentration of total dissolved solids was probably due to the dissolution and leaching of the adjacent deposits. Mineral dissolution was due to wave activity and irregular flash floods, transporting salts coastward (Al-Taani et al., 2014).
Average concentrations of “Pb (0.001 μg/L) and Cd (0.001 μg/L) were less than the ones recorded from the north Atlantic (100–150 and 1–10 μg/L) and Pacific (14–50 and 1–10 μg/L) oceans, Luoyuan Bay (0.51and 0.68 μg/L), and Yellow River Estuary, South China (Donat and Bruland 1995; Wang et al., 2010; Tang et al. 2010; Zhang et al. 2016). Zn (30.78 μg/L) and Cu 100.396 μg/L) were higher compared to Gulf of Suez, Iranian Oman Sea coast and, Gulf of Aqaba and Yellow River Estuary (Hamed and Emara 2006; Bazzi 2014; Al-Taani et al., 2014; Tang et al., 2010; Zhang et al. 2016; Alharbi and El-Sorogy, 2017; Alharbi et al., 2017). As concentration was higher than the Yellow River Estuary (Zhang et al., 2016)”. Co and Hg exhibited similar trends reported in North Atlantic (Donat and Bruland, 1995) and Arabian Gulf (El-Sorogy et al., 2016). The average concentration of Sr (235.78 μg/L) was compared to the Pacific Ocean, Gulf of California, and Kuwait (Bernat et al. 1972; Sun et al. 2005; Uddin et al., 2013). The higher concentration of metals in different locations was due to anthropogenic activities such as paints of marine ships, corrosion of the marine constructions, landfilling, and construction residuals. Sr, Cu, Se, Zn, and As were the most abundant metals recorded in this study from Tarut Island (Table 2). These findings were in line with El-Sorogy et al. (2016). Fe concentration was less in water samples than the previously reported by El-Sorogy et al. (2016), but it was very high in the sediment samples (Table 4). The atmospheric deposition of Fe to the ocean surface varies in different regions, and maximum concentration was reported in near-desert source regions as in the present study (Duce and Tindale, 1991; Fung et al., 2000).
The maximum concentration Mn in water samples (11.20 ± 2.03 µg/L) and sediment samples (245.99 ± 4.99 µg/g) was recorded from station no. 4 (Tarut Island). Mn transfer to the marine environments from multiple sources, including natural input as wadies in the present study (Table 2 and 4).
The highest As contents in the sediment samples were recorded as 239.88 ± 2.48 µg/g (Fig. 3c). As concertation was found higher than the permissible limits by the Canadian Interim sediment quality guidelines (7.24 µg/g; Ccrem, 1987). The concentration of arsenic in the studied area exceeded the MEC, PEC indicating possible As contamination (Table 4). The sources of pollution for As in sampling site no.4 might be agricultural chemicals such as herbicides, fungicides, rodenticides, and insecticides. We believe that the leaching of exposed wastes of draining from large industrial and domestic areas and leftover by the visitors in the area (El-Sorogy et al., 2016).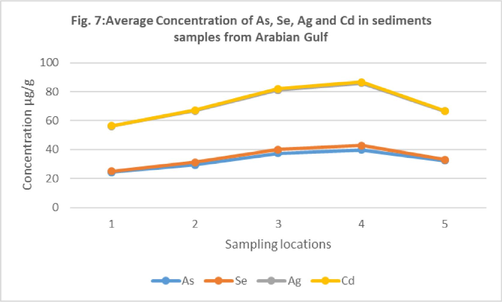
Average concentration of As, Se, Ag and Cd in sediment samples from Arabian Gulf.
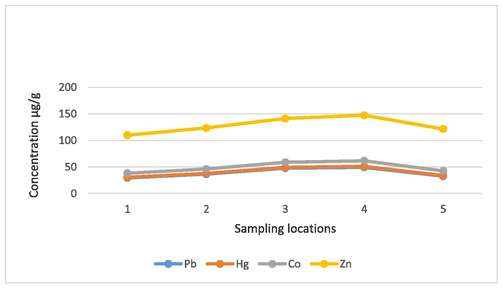
Average concentration of Pb, Hg, Co and Zn in sediment samples from Arabian Gulf.
Lead occurs naturally from the decomposition of parent rocks and may accumulate from anthropogenic sources, including traffic exhaust (Cameron, 1992), oil spills, motorboats, and untreated wastes (Mansour et al., 2011). The higher concentration of Pb in sediment samples collected from sampling site 4 was due to industrial and household Pb and exceeded the suggested upper limits (Table 4) by Sweden Environmental Protection Agency (2000).
Cu content varied from 48.77 ± 2.88–121.33 ± 6.68 µg/L and 54.63 ± 2.61–220.51 ± 3.71 µg/g in water and sediment samples, respectively collected from different locations of Arabian Gulf (Tables 2 and 4). The fluctuation in Cr in water and sediments showed was recorded. Cr contents were higher in the sediment samples than in the Gulf of Oman concentration (Mora et al., 2004). The higher concentration of Cu was probably due to the effect of terrigenous sediments and antifouling paint from ships from the extensive boat traffic of fishing. The higher concentration of Cr might be due to water from the desalination plant (Lattemann and Hoepner, 2008).
Zn is present as a common contaminant in agricultural, food wastes, manufacturing of pesticides, and antifouling paints (Badr et al., 2009). The primary anthropogenic source of Zn includes ZnSO4, “air-conditioning ducts, trash bins, galvanized pipes, batteries and wear of automobiles tires” (El-Sorogy et al., 2016). Se content was ranged as 44.66 ± 3.45–51.69 ± 4.42 µg/L and 0.56 ± 0.09–3.02 ± 0.60 µg/g, respectively from water and sediment samples (Tables 2 and 4). Se contents were are higher than the already reported concentration from the Gulf of Aqaba (AL-Taani et al., 2014). The higher concentration of Se in water samples was due to anthropogenic activities such as “coal ash from coal-fired power plants, irrigation of wastewaters from some industrial processes” (Ccrem, 1987) and the power station in the study area (Peters et al., 1999).
Gulf of Aqaba surface sediments Hg contents sediments was compared to the present study (Al-Taani et al., 2014). The concentrations of Hg, Cd, and Co in sediments of the study area were recorded as 1.01–1.69; 0.38–0.82 and 7.77–10.69 µg/g, respectively, from the sampling sites (Fig. 4a). Hg, Cd, and Co contents in the sediment samples procured from location no.4 were higher than coastal sediments from Qatar (Al-Madfa et al., 1994), Arabian Gulf (Kureishy and Ahmed, 1994). “Cd Hg load was probably due to anthropogenic emissions considerably associated with meteorological conditions (Bełdowska et al.,2014). The level of Hg and Cd in the present study exceeded the MEC, indicating possible Hg contamination. The sediment samples collected from location no.4 were highly contaminated (Table 4 and Figs. 4a-4b) due to industrial wastewaters and sewage (McMurtry et al., 1995). Mora et al. (2004) reported that higher concentration in the Gulf of Oman was due to local mineralogy instead of pollution. Multiple other factors like grain size, organic matter, pH, and redox also affect this metal's accumulation in water and sediments (Smith and Paterson, 1990)”.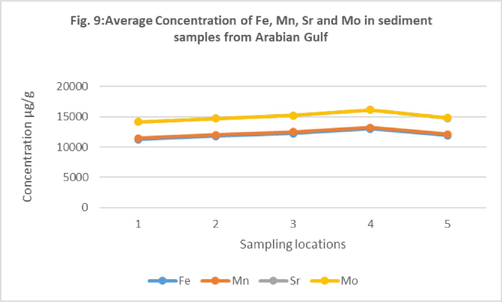
Average concentration of Fe, Mn, Sr and Mo in sediment samples from Arabian Gulf.
Be, Se, and Mo contents were recorded as 0.52–0.91; 0.56–3.02 and 12.35 and 16.55 µg/g. Be and Se were relatively low in concentration in water and sediment samples (Tables 2 and 4). Mo concentration was found higher compared to reported by Al-Taani et al. (2014) in the Gulf of Aqaba. Mo is probably entered due to corrosion and discharged from desalination plants in Saudi Arabia (Lattemann and Hoepner, 2008). The elevated concentration in some heavy metals in the Dammam area seawater compared to some other global water bodies might be because of the in situ sediments, anthropogenic activities like landfill and oil spills, and the dust storms from the surrounding desert area.
4 Conclusions
It has been concluded that the pollution stress was not very high except Tarut Island compared to other sampling sites. The average level of these metals in water samples were recorded Sr > Cu > Se > Zn > As > Mn > Fe > Ni > Mo > Hg > Co > Cr > Ag > Cd > Pb and Be, respectively. The average level of these metals in sediment samples were recorded Fe > Sr > Ni > Mn > Cu > Cr > Zn > Pb > Ag > As > Mo > Co > Se > Hg > Be and Cd, respectively. The concentration of As, Hg, Cd, Cr, Cu, Fe, and Sr was high, alarming, particularly in the Dammam area. This critical situation warrants the attention of the country's Environmental Protection Agency and other stakeholders to devise strategies to overcome the current situation to ensure the supply of aquaculture products for human consumption.
Acknowledgements
The authors extend their appreciation to the Deputyship for Research & Innovation, Ministry of Education in Saudi Arabia for funding this research work through the project number DRI-KSU-659.
Declaration of Competing Interest
The authors declare that they have no known competing financial interests or personal relationships that could have appeared to influence the work reported in this paper.
References
- Assessment of metal contamination in coastal sediments of Al-Khobar area, Arabian Gulf, Saudi Arabia. J. Afr. Earth Sci.. 2017;129:458-468.
- [Google Scholar]
- Metal pollution in Al-Khobar seawater, Arabian Gulf, Saudi Arabia. Mar. Pollut. Bull.. 2017;119:407-415.
- [Google Scholar]
- Mercury pollution in Doha (Qatar) coastal environment. Environ. Toxicol. Chem.. 1994;13(5):725-735.
- [Google Scholar]
- Status of trace metals in surface seawater of the Gulf of Aqaba, Saudi Arabia. Mar. Pollut. Bull.. 2014;86:582-590.
- [Google Scholar]
- Metal pollution records in core sediments of some Red Sea coastal areas, Kingdom of Saudi Arabia. Environ. Monit. Assessment. 2009;155(1-4):509-526.
- [Google Scholar]
- Heavy metals in seawaters, sediments and marine organisms in the Gulf of Chbahar, Oman Sea. J. Oceanogr. Mar. Sci.. 2014;5(3):20-29.
- [Google Scholar]
- Factors influencing variability of mercury input to the southern Baltic Sea. Mar. Pollut. Bull.. 2014;86(1-2):283-290.
- [Google Scholar]
- Barium and strontium concentrations in pacific and Mediterranean Sea water profiles by direct isotope dilution mass spectrometry. Earth Plan. Sci. Lett.. 1972;16:75-80.
- [Google Scholar]
- Cameron, R., 1992. Guide to site and soil description for hazardous waste site characterization. Metals, vol. 1. Environmental Monitoring Systems Laboratory, Office of Research and Development, U.S. Environmental Protection Agency, Las Vegas, NV.
- Canadian Water Quality Guidelines. Ottawa, Ontario: Canadian Council of Ministers of Resources and Environment; 1987.
- Trace elements in the oceans. In: Salbu B., Steinnes E., eds. Trace Elements In Natural Waters. Boca Raton: CRC Press; 1995. p. :247-292.
- [Google Scholar]
- Atmospheric transport of iron and its deposition in the ocean. Limnol. Oceanogr.. 1991;36:1715-1726.
- [Google Scholar]
- Assessment of toxic metals in coastal sediments of the Rosetta area, Mediterranean Sea, Egypt. Environ. Earth Sci.. 2016;75:398.
- [Google Scholar]
- Distribution and metal contamination in the coastal sediments of Dammam Al-Jubail area, Arabian Gulf, Saudi Arabia. Mar. Pollu. Bull.. 2018;128:8-16.
- [Google Scholar]
- Heavy metal, trace element and petroleum hydrocarbon pollution in the Arabian Gulf: Review. J. Asso. Arab Univ. Basic Appl. Sci.. 2015;17:90-100.
- [Google Scholar]
- Petrology of Sedimentary Rocks. Austin: Hemphill; 1974. p. :184.
- Marine molluscs as biomonitors for heavy metal levels in the Gulf of Suez, Red Sea. J. Mar. Sys.. 2006;60:220-234.
- [Google Scholar]
- Assessment of DNA integrity through MN bioassay of erythrocytes and histopathological changes in Wallago attu and Cirrhinus mrigala in response to freshwater pollution. Saudi J. Biol. Sci.. 2020;27(1):251-260.
- [Google Scholar]
- Total mercury distribution in surface sediments from the Arabian Gulf. Qatar Univ. Sci. J.. 1994;14:390-394.
- [Google Scholar]
- Environmental impact and impact assessment of seawater desalination. Desalination. 2008;220(1–3):1-15.
- [Google Scholar]
- Tissue metal distribution and risk assessment for important fish species from Saudi Arabia. Bullet. Environ. Cont. Toxicol.. 2014;92:61-66.
- [Google Scholar]
- Metal pollution in marine sediments of selected harbours and industrial areas along the Red Sea coast of Egypt. Ann. Naturhist Mus. Wien Ser. A. 2011;113:225-244.
- [Google Scholar]
- Heavy metal anomalies in coastal sediments of Oahu, Hawaii. Pac. Sci.. 1995;49(4):452-470.
- [Google Scholar]
- Distribution of heavy metals in marine bivalves, fish and coastal sediments in the Gulf and Gulf of Oman. Mar. Pollut. Bull.. 2004;49:410-424.
- [Google Scholar]
- Assessment and management of heavy metal pollution in the marine environment of the Arabian Gulf: a review. Mar. Pollu. Bull.. 2013;72:6-13.
- [Google Scholar]
- Selenium in sediments, pore waters and benthic infauna of Lake Macquarie, New South Wales, Australia. Mar. Environ. Res.. 1999;47:491-508.
- [Google Scholar]
- Metal pollution in coastal sediments. Curr. Pollut. Rep.. 2015;1:203-219.
- [CrossRef] [Google Scholar]
- Sharifuzzaman, S. Rahman, Md. H., Ashekuzzaman, S.M., Islam, M., Chowdhury, S. Hossain, M. S. 2016. Heavy Metals Accumulation in Coastal Sediments. 10.1007/978-4-431-55759-3_2.
- Manganese and cobalt. In: Alloway B.J., ed. Manganese and Cobalt. New York: John Wiley & Sons; 1990. p. :224-244.
- [Google Scholar]
- Influence of seawater Sr content on coral Sr/Ca and Sr thermometry. Coral Reefs. 2005;24:23-29.
- [Google Scholar]
- Sweden Environmental Protection Agency. 2000. Sweden Environmental Protection Agency code Ds 2000:61.
- Distribution characteristics and controlling factors of soluble heavy metals in the Yellow River Estuary and adjacent sea. Proc. Environ. Sci.. 2010;2:1193-1198.
- [Google Scholar]
- Uddin, S., Al Ghadban, A. N., & Behbahani, M. (2013). Baseline concentrations of strontium and 90Sr in seawater from the northern Gulf. Marine Pollution Bulletin, 75(2013), 301– 304.
- Wang, J., Liu, R., Ling, M., Yu, P., & Tang, A. (2010). Heavy metals contamination and its sources in the Luoyuan Bay. Procedia Environmental Sciences, 2(2010), 1188–1192.
- Toxic heavy metals in sediments, seawater, and molluscs in the eastern and western coastal waters of Guangdong Province, South China. Environ. Monitor. Assess.. 2016;188:313.
- [Google Scholar]


