

Translate this page into:
Assessment of genetic diversity of freshwater genus Labeo through DNA barcoding and phylogenetic analysis inhabited in the River Indus
⁎Corresponding author. farhatjabeen@gcuf.edu.pk (Farhat Jabeen)
-
Received: ,
Accepted: ,
This article was originally published by Elsevier and was migrated to Scientific Scholar after the change of Publisher.
Abstract
Objectives
Genus Labeo of family Cyprinidae comprising of important group of fish species are known for ornamental purpose, food, extracting oil, medicinal value and for potential viable aquaculture. The present study was conducted to assess the morphometric and molecular identification of freshwater fishes of genus Labeo including Catla catla, Labeo rohita, Labeo calbasu, Labeo gnius, Labeo bata from the three fish resources of River Indus, Punjab, Pakistan.
Methods
Out of 75, thirty fish specimen were amplified and sequenced with 650 bp of mitochondrial COI gene for the evaluation of fish biodiversity, management and conservation by using different bioinformatics techniques.
Results
Maximum and minimum genetic divergence between fishes of C. catla, L. calbasu, L. boga, L. gonius and L. rohita, were 0.052 to 0.105, respectively. Highest divergence was found between Labeo bata and Labeo rohita. Interspecific mean distance was found higher than intraspecific distance. In nucleotide base composition, AT contents was higher than GC contents indicated the clear pattern of anti-G bias. Transition rate was k1 = 8.84 for purines and transversional rate was k2 = 15.47 for pyrimidines with transition/transversion bias R = 5.62. Tajima D test and nucleotide diversity was measured D = 1.382883 and π = 0.049981 respectively. Positive value of D indicated a strong selective pressure and lack of population expansion. Thirty species were identified with e-value 0.0 and similar identity 99.85 %–100 % with maximum 600 bp length. Phylogenetic tree revealed two major clades with 95 % high bootstrap values identity showed closet relationship among these species.
Conclusions
Current study supported the efficacy of the COI gene for the species identification in River Indus and develop the concept for establishing Pakistani fish gene bank which is still needed.
Keywords
Morphology and DNA barcoding
Freshwater fish diversity
Phylogenetic analysis
Fish conservation
Genus Labeo

- COI
-
cytochrome oxidase I
- PCR
-
polymerase chain reaction
- ABGD
-
automated barcode gap discovery analysis
- K2P
-
kimura 2 parameter
- PrPecL
-
pre-pectoral length
- PrPevL
-
pre-pelvic length
Abbreviations
1 Introduction
River Indus is one of longest river system in Pakistan. It is recognized for its freshwater biodiversity, including fishes (Abro et al., 2020). In Pakistan, total 531 species have been recognized, of which 298 are marine and 233 are freshwater fish species. Economically 78 out of 233 have been recognized as “species of special importance” based on endemism (Ghouri et al., 2020). The knowledge about freshwater fish diversity of River Indus mainly focus on the identification for fish conservation and management.
The Cyprinidae family of freshwater fishes is the most varied, with 377 genera and more than 3038 known species (Alam et al., 2021). Maximum species of family cyprinidae can be found in North America, Asia, Europe and Africa (Kaur et al., 2021). In addition to their great value in the recreational fisheries, some fish species of family cyrinidae are economically significant in aquarium trade, aquaculture, angling and serve as a main source of proteins and food for Pakistan (Adeoba et al., 2018). Among species of family cyprinidae, Labeo bata, Catla catla, Labeo gonius, Labeo rohita and Labeo calbasu are appropriate for fish culture in Pakistan. These fishes are belongs to genus labeo and only occur in South East Asia and Africa.
After the Barbiinae, the second most vital group of fishes is Labeo lineage of family Cyprinidae. Cyprinid species represent 19.6 % occurrence in Asia (Sarma et al., 2017). Genus Labeo is the most dominating group of family Cyprinidae. Out of 105 fish species of Labeo genus around the word, 36 fish species of labeo genus are represented throughout the South and South East Asia and 69 occure in Africa (Sudha et al., 2015).
Fish is an essential aquatic organisms having high nutritional and protein value for human consumption (Selamoglu, 2018; Kakoolaki et al., 2013). Labeo rohita is favored for its public preference and taste. This is a candidate specie for aquaculture practices in Pakistan, Myanmar, Bangladesh, and India. Researchers have created genetically modified rohu for critical qualities including growth and disease resistance due to consumer interest in this species (Rasal and Sundaray, 2020). Catla catla is considered an ideal dietetic food and an important source of calcium, protein and low fatty acid. Therefore, in composition of animal taxa, fish constitute an essential component of biodiversity and have economical values and are significant source of protein for humans (Hossain et al., 2015).
However, the River Indus's diversity and abundance of these freshwater fishes become more susceptible due to human involvement. Annually almost 400 species have been defined over past 20 years (Fricke et al., 2021). Anthropogenic effects such as habitat degradation, overfishing, water pollution from plastics, poaching, ports, pollution of water, noise, household wastage and water withdrawal have resulting the loss of fish diversity. Comprehensively, taxonomic study of fish species are key to conserving and managing biodiversity (Sheraliev and Peng, 2021; Selamoglu, 2021a,b). Freshwater fishes of the genus Labeo are traditionally identified through their visual morphology characteristics such as, features, shape, size, number of fin raysand different body measurements. This system is quite valuable for gathering details about an organism’s shape.
Classifications and identifications, moreover, can be time consuming and challenging based on the morphological features; although species documentations usually require significant taxonomic data (Bilgin et al., 2014). Thus, accurate specimen identification at the species level in necessary for environmental studies and conservation. The inherent boundaries of traditional taxonomy and minimum nmber of taxonomists need genetic techniques for fish species identifications (Sheraliev and Peng, 2021).
The most used molecular identification technique is DNA barcoding, which is based on the mitochondrial COI gene. This technique is effective for identification at the level of larvae that can’t be identified through traditional morphological approaches. This technique has potential to reveal the misidentification of species that happened by means of traditional identification ways (Jaonalison et al., 2022).
This region received certification at the first international conference on DNA Barcode Life (Trivediet et al., 2016). Different studies revealed that the sequences diversity in the range of approximately 650 bp from the 5′ area of the COI provides great resolution for various animal groups at species level (Cermakova et al., 2023). To identify the eggs, larvae and broken specimens by traditional method cannot be done properly but the DNA barcoding method makes it easier and authentic (Jaonalison et al., 2022). Fishes are the most diverse and largest vertebrate class as well as easiest group to create DNA barcode records. By the use of DNA barcode method, it is estimated that species number was exceeding at the rate of 300 new species per year (Weigt et al., 2012).
The efficacy of this method has been verified by various studies, it is possible to correctly identify more than 90 % species at the species. It can expose cryptic diversity and alsoidentify fish specimens when morphometric characters cannot, like treated commercial products. Furthermore, DNA barcoding suggests the occurance of species in any given area by evaluating ambient DNA. This method is known as DNA meta-barcoding (Tsoupas et al., 2022).
Environmental factors and human exploitation have created significant impacts on structure and biodiversity of fish community in River Indus. Decline in genetic variations in any population reduces fish capability to adapt the environmental variations and also decrease the species chances of long term survival (Tickner et al., 2020). However,to support sustainability, improved control and management of fishes should be applied. Still, one of the most crucial and fundamental issues in fisheries management is the identification of species. The goal of current study was to check the biodiversity of commercially important fishes of labeo genus for conservation from three different populations of River Indus Punjab, Pakistan and to provide new information on its genetic diversity by analyzing additional samples from previously studied areas as well as by studying new and unexplored population. In this study, DNA barcoding records will be available to investigators and researchers to conserve and monitor the biodiversity of fishes in these studied areas.
2 Materials and methods
2.1 Ethic statement
Fish specimens utilized in this study were treated and handled after the approval from Ethics Review Committee of the Government College University Faisalabad, Pakistan (Ref. No. GCUF/ERC/19/017 dated 04-2-2019).
2.2 Study area
The current research was carried out from the three different sites Mianwali (upstream), kallurKot(midstream) and Dera Ghazi Ghaat (downstream) of riverine system of River Indus, Punjab, Pakistan in October 2020 to February 2022. Basic data, such as the location's latitude and longitude, were noted at each site (Fig. 1).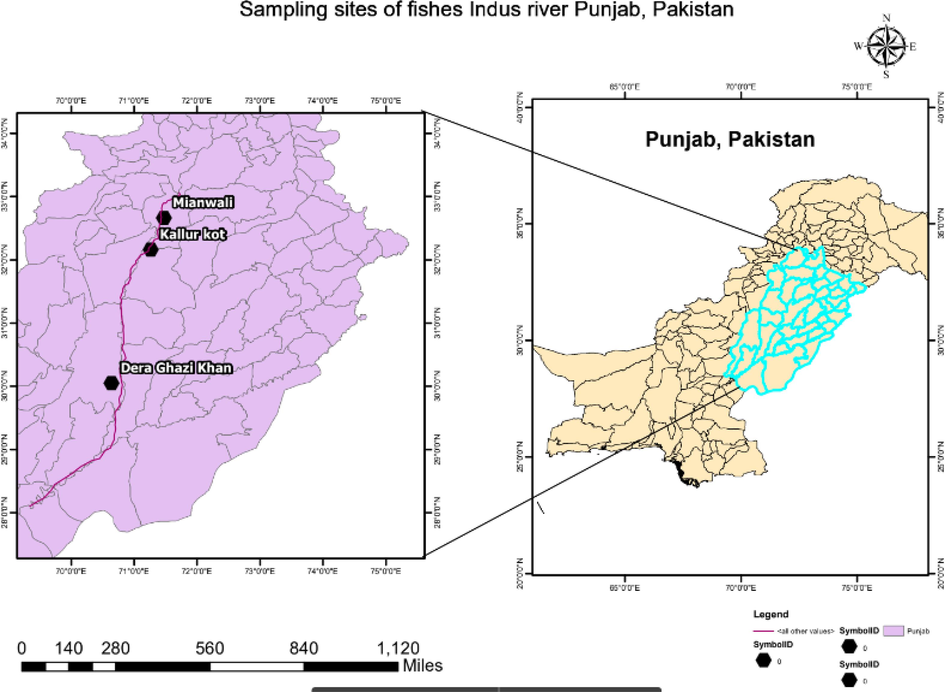
Map of Sampling sites. Map showing three different locations (Mianwali, KallurKot, Dera Ghazi Khan) for collecting five species of labeo genus. River Indus are marked with purple and sitesfrom which samples were collected are marked with black symbol. (For interpretation of the references to color in this figure legend, the reader is referred to the web version of this article.)
2.3 Fish sampling
Total 75 specimens of fish species were collected from three different sampling areas that cover the main course of River Indus, Punjab, Pakistan. The fish samples were collected randomly with casting net, gill nets, and basketswith the help of fisher man. Samples were labelled and packed in polyethylene bags. Then fish samples were photographed and preserved as voucher specimen to fisheries laboratory, GC University Faisalabad. For DNA barcoding, at least two individual per common species according to available number of each species were preserved in alcohol.
2.4 Morphological analysis
Morphological identification of fish samples was done with help of morphological characters and standard taxonomic keys provided by Punjab Fisheries Department (Mirza and Sandhu, 2007). The morphometric measurements, standard length, total length, forked length, head length, body depth, snout length, pre-pectoral length, pre-pelvic length, pre-dorsal length and pre-anal length of Labeo calbasu, Labeo gonius, Labeo rohita, Labeo bata and Catla catla were measured in (mm) with help of measuring board, measuring tape, vernier caliper and divider (Table 1).
Family
Genus
Species
Common name
Commercial value
Sample size
Distribution
IUCN status
Cyprinidae
Labeo
Labeo rohita
Rahu
Very high
15
AJK, Baluchistan, Punjab, Sindh
LC
Labeo calbasu
Calbans, Dahi
High
15
KP, Punjab, Sindh
LC
Labeo gonius
Sereha
High
15
Punjab, Sindh
LC
Labeo bata
Bata
High
15
KP, Punjab, Sindh
LC
Catla catla
Thaila
High
15
AJK, Baluchistan, Punjab, Sindh
LC
2.5 DNA extraction
After morphological measurements, fin tissue of each specimens were dissected and then preserved at −20 °C in 95 % ethanol. Fin tissues of voucher specimens were cut with the help of sterilized scissor and total genomic DNA was extracted according to manufacturer’s protocol of Tissue Kit method (QIAamp™ DNA Extraction Mini Kit). DNA extraction consists of three steps: lyses, precipitation, and purification of DNA.
2.6 DNA visualization
After the DNA extraction, purity and quality of DNA specimens were checked with NanoDrop values (ND- 1000 spectrophotometer). Samples were viewed on 0.8 % agarose gel to prevent degradation possibility and set final concentration to 50 ng/ml to prevent PCR inhibition because of excessive quantity of template DNA.
2.7 PCR amplification
The polymerase chain reaction amplification process was then utilized with DNA samples. The universal primers FishF1 and FishR1 were used to amplify a nearly 650 bp sequence of cytochrome c oxidase subunit I from the 5/.
FishF1: 5/TCAACCAACCACAAAGACATTGGCAC3/
Fish R1: 5/TAGACTTCTGGGTGGCCAAAGAATCA3/
Mitochondrial COI marker was selected because of its well-known sequence, quick primer construction and higher interspecies variability than intraspecies. The mitochondrial gene COI is one of the most useful markers for wide range of fish species identification. Its 650 bp segment serves as the foundation for taxonomic fish differentiation using DNA barcoding (Cermakova et al., 2023). The Bio-Rad I-CyclerTM Thermo cycler (Bio-Rad Inc., Waltham, MA) was used to carry out the PCR amplification reaction. The COI gene is amplified by initial denaturation at 95 °C for 3.00 min, 36 cycles at 95 °C for 0.30 s, annealing at 58 °C for 0.45 s, and extension at 72 °C for 0.45 s. A final expansion lasting 10 min at 72 °C was noticed before being recorded at 4 °C. Prior to sanger sequencing, amplified PCR products were sized and observed on a 0.8 % agarose gel, and the COI gene containing products were chosen.
2.8 Mitochondrial COI region sequencing
Polymerase chain reaction Using a genetic analyzer (ABI PRISM 3730XL Analyzer 96 capillary type), sequencing was carried out. The Big Dye (R) Terminator v3.1 Cycle Sequencing Kit (Applied Biosystems) was used for the cycle sequencing. Fish species from all habitats were used in the current investigation, and mitochondrial DNA was used to amplify and sequence the CO1 gene. These sequences were analyzed to determined genetic diversity and evolutionary history of the L. rohita, L. calbasu, L. gonius, L. bata, and C. catla species.
3 Statistical analysis
Morphological data was statistically analyzed measuring mean and standard deviation by plotting data on Excel sheet. Sequence with their accession number were submitted to GeneBank Barcode database. Consensus sequence of studied fishes were generated and submitted in NCBI than these sequence along with voucher sequence from GenBank and reference sequence from BOLD were aligned and compared by using ClusterW program of MEGA. 11. Accession number of studied fishes and reference sequence number were used to generate multiple sequence alignment for Labeo rohita, Labeo bata, Labeo gonius, Labeo calbasu and Catla catla.
Using MEGA11.0, pairwise genetic distances were calculated for sequence comparisons based on the Kimura 2-parameter (K2P) distance model. The species of L. rohita, L. calbasu, L. gonius, L. bata, and C. catla that were examined here are represented graphically by a UPGMA tree. For intraspecific and interspecific divergence, automated barcode gap discovery (ABGD) was used with K2P model with transition and tranversion ratio (TS/TV) set to 1.5, relative gap width (x) = 1.0, recursive steps 10, and remaining parameters set to default value with pmax = 0.1, pmin = 0.001 and Nb bins = 20 ABGD (https://bioinfo.mnhn.fr/abi/public/abgd/). QR code generator (aspose.app/barcode/generate) was used to generate unique codes when species gets separated.
4 Results
4.1 Morphometric identification
In Labeo rohita, back was black and sides became brownish when preserved in formalin. Fins were dark gray and iris rims was red. The edge of each scale has a dark brown tinge. In Catla catla, dorsal side (back) was dirty greenish and ventral side was silvery brown. Fins color was black with light base color. Labeo bata has a narrow mouth with no lateral lobe and has two minute maxillary barbels. Body color was dark gray to orange and fins with reddish tinge. The body color of Labeo calbasu was blackish with lighter on ventral side. It has four pairs of barbels with very minute gill rakers. The mouth was narrow with depressed snout and has thick lips. In Labeo gonius, body color was reddish golden to orange with convex dorsal profile than abdomen. The mouth is narrow with short barbels. Fins color wasreddish brown and pectrol fin was as long as head.
Total 75 fishes of Labeo rohita, Catla catla, Labeo bata, Labeo calbasu and Labeo gonius were collected from three different sites Mianwali, KallurKot and Dera Ghazi Ghat of River Indus, Puanjab, Pakistan (Fig. 1).At taxonomic level, samples were morphological identified by measuring total length (TL), standard length (SL), fork length (FL), body depth (BD), head length (HL), snout length (SnL), pre-dorsal length (PrDL), pre-pectoral length (PrPecL), pre-pelvic length (PrPevL) and pre-anal length (PrAL).Within species maximum mean value ofTL, SL, FL, BD, HL, SnL, PrDL, PrPecL, PrPevL and PrALwas observed in Catla catla, Labeo calbasu, Labeo gonius and Labeo rohita from Mianwali populations which shows statistically significant difference (p ≤ 0.05) when compared with the mean values of Kallur Kot and Dera Ghazi Ghat fish populations (Table 2). Maximum mean values of morphometric characters were observed in KallurKot populations of Labeo bata except head length which has maximum mean valueamong fishes of Dera Ghazi Ghat population. Among all fish populations maximum mean values were observed in L. rohita which showed statistically significance difference when compared with other species of genus labeo (Table 2).
Morphometric characters
Catla catla
Labeo calbasu
Labeo gonius
Labeo bata
Labeo rohita
MW
KK
DGG
MW
KK
DGG
MW
KK
DGG
MW
KK
DGG
MW
KK
DGG
TL
215.33 ± 6.51a
105.02 ± 1.77
95.19 ± 0.78
223.33 ± 9.5 a
183.03 ± 6.38
160.79 ± 3.23
172.08 ± 2.12 a
162.57 ± 4.72
154.61 ± 1.71
224.77 ± 12.59
278.45 ± 2.0 a
241.1 ± 1.65
286.66 ± 10.97 a
255.1 ± 7.45
226.81 ± 6.01
SL
167.3 ± 6.35 a
85.00 ± 5.69
73.03 ± 0.53
173.7 ± 12.85 a
139.01 ± 3.77
132.28 ± 1.2
135.47 ± 2.53 a
128.05 ± 3.27
120 ± 2.44
170 ± 5
215.67 ± 5.86 a
189 ± 3
218.93 ± 12.28 a
191.72 ± 6.86
179.78 ± 3.33
FL
186.66 ± 6.0 a
91.83 ± 3.13
78.07 ± 0.72
195.45 ± 12.2 a
158.13 ± 5.68
145.58 ± 2.23
150.23 ± 3.42 a
139.33 ± 4.04
130.9 ± 1.83
187.74 ± 3.26
238.68 ± 12.72 a
207.92 ± 2.88
249.6 ± 15.75 a
225.5 ± 6.01
203.09 ± 6.97
BD
54.87 ± 4.22 a
20.47 ± 0.74
20.5 ± 0.67
58.89 ± 6.05 a
45.27 ± 1.43
46.74 ± 0.5
40.66 ± 2.71 a
35.9 ± 1.96
37.17 ± 0.3
48.07 ± 2.54
51.28 ± 1.36 a
50.73 ± 1.17
68.77 ± 4.06 a
61.47 ± 1.75
57.02 ± 2.42
HL
51.54 ± 2.39 a
28.70 ± 2.13
26.41 ± 0.39
41.24 ± 2.73 a
35.19 ± 1.36
29.87 ± 1.84
29.56 ± 1.68 a
27.42 ± 0.51
27.56 ± 0.07
38.05 ± 3.35
41.02 ± 11.48
42.77 ± 0.87 a
62.77 ± 5.22 a
56.88 ± 3.69
49.97 ± 1.18
SnL
23.11 ± 0.68 a
11.26 ± 0.86
10.06 ± 0.07
20.62 ± 0.87 a
19.7 ± 0.42
17.28 ± 0.78
13.15 ± 1.04 a
11.71 ± 1.35
13.19 ± 0.17 a
17.87 ± 2.96
20.97 ± 0.68 a
20.31 ± 0.65 a
29.23 ± 2.22 a
26.47 ± 0.77
23.74 ± 0.46
PrDL
80.3 ± 2.36 a
36.19 ± 0.99
35.46 ± 0.42
85.05 ± 1.71 a
74.18 ± 3.27
66.15 ± 2.69
61.71 ± 2.3 a
55.89 ± 2.72
51.76 ± 0.92
75.35 ± 3.82
91.36 ± 0.31 a
82.79 ± 0.52
115.24 ± 3.46 a
102.23 ± 1.22
91.55 ± 7.07
PrPecL
54.23 ± 1.22 a
26.23 ± 1.74
23.76 ± 0.27
43.08 ± 1.33 a
35.48 ± 2.3
28.79 ± 2.24
30.59 ± 2.04 a
28.24 ± 1.54
29.65 ± 0.4
40.05 ± 2.09
44.37 ± 2.46 a
42.55 ± 0.64
62.17 ± 2.91 a
55 ± 1.57
47.64 ± 2.86
PrPevL
91.67 ± 2.62 a
38.87 ± 2.45
35.61 ± 0.09
83.44 ± 3.13 a
76.71 ± 1.9
64.51 ± 3.47
68.47 ± 0.15 a
65.7 ± 0.25
65.1 ± 0.17
84.25 ± 7.64
97.87 ± 0.42 a
94.03 ± 0.9
118.29 ± 4.34 a
103.5 ± 1.99
91.68 ± 4.76
PrAL
136.82 ± 2.1 a
58.36 ± 1.51
55.87 ± 0.29
124.62 ± 3.66 a
111.23 ± 2.67
96.44 ± 2.42
105.69 ± 0.75 a
98 ± 4.07
94.8 ± 0.38
135.24 ± 7.14
158.35 ± 2.08 a
147.27 ± 0.72
184.69 ± 2.33 a
147.58 ± 1.23
133.22 ± 5.82
4.2 DNA barcoding for fish species identification
Total 30 mitochonderial COI barcodes sequence were successfully obtained and analyzed from fishes of family cyprinidae and amplified using two primers in PCR (Table 3). All sequences were 650 bp in length after aditing and trimming, and sequences had no stop codons, insertions and deletions. The length of almost all analyzed sequences were greater than 600 bp.
Query sequence ID
Accession No.
Query Length
Percentage similarity
E-value
Accession No. of best match
Query cover
Catla catla
OP536010
623
99.84 %
0.0
KC757310.1
100 %
Catla catla
OP536108
401
100 %
0.0
MK416162.1
100 %
Catla catla
OP536113
401
100 %
0.0
KX946601.1
100 %
Catla catla
OP536142
657
99.85 %
0.0
JX074196.1
100 %
Catla catla
OP536585
630
100 %
0.0
JX083155.1
98 %
Catla catla
OP536587
612
100 %
0.0
KJ406530.1
100 %
Labeo bata
OP737758
629
100 %
0.0
MT492421.1
100 %
Labeo bata
OP737886
642
100 %
0.0
OP737886.1
100 %
Labeo bata
OP737975
628
100 %
0.0
MN083094.1
100 %
Labeo bata
OP738086
627
100 %
0.0
OP738086.1
100 %
Labeo bata
OP738176
624
100 %
0.0
KT353105.1
100 %
Labeo bata
OP738298
614
99.84 %
0.0
MT492421.1
100 %
Labeo calbasu
OP709361
590
100 %
0.0
MN395836.1
100 %
Labeo calbasu
OP709370
615
100 %
0.0
MN178274.1
100 %
Labeo calbasu
OP710249
633
100 %
0.0
OP710249.1
100 %
Labeo calbasu
OP711819
628
100 %
0.0
KT364767.1
100 %
Labeo calbasu
OP711820
589
100 %
0.0
KX946689.1
100 %
Labeo calbasu
OP712184
600
100 %
0.0
MK238493.1
99 %
Labeo gonius
OP558489
626
100 %
0.0
OP558489.1
100 %
Labeo gonius
OP558529
610
100 %
0.0
MN200474.1
100 %
Labeo gonius
OP558530
628
99.84
0.0
MK572282.1
100 %
Labeo gonius
OP679801
576
100 %
0.0
OP679801.1
100 %
Labeo gonius
OP680014
605
100 %
0.0
HQ645092.2
100 %
Labeo gonius
OP680528
634
100 %
0.0
KC757287.1
99 %
Labeo rohita
OP550321
606
100 %
0.0
MN605503.2
100 %
Labeo rohita
OP550421
622
100 %
0.0
MK732922.1
100 %
Labeo rohita
OP550423
620
100 %
0.0
OP550423.1
100 %
Labeo rohita
OP550426
481
100 %
0.0
MN964133.1
100 %
Labeo rohita
OP550442
609
100 %
0.0
MN964135.1
100 %
Labeo rohita
OP550553
635
100 %
0.0
MK572283.1
100 %
4.3 Nucleotide base composition analysis
The average nucleotides base frequencies of entire dataset observed were C (27.67 %), T (28.38 %), A (27.17 %) and G (16.78 %). The nucleotide base composition analysis of the COI gene sequence showed that the average G content was lowest and the highest T content, indicating that the AT content (55.55 %) was higher than the GC content (44.45 %) (Fig. 2) exhibiting a anti-G bias pattern. The rate of transition/transversion ratios were k1 = 8.84 and k2 = 15.47.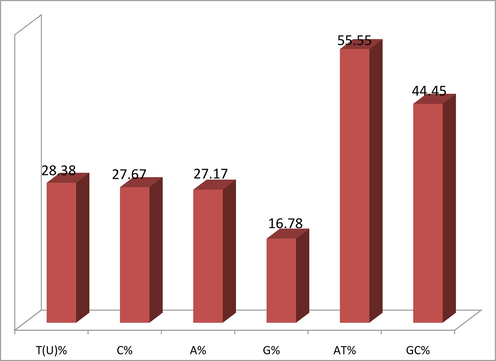
Average nucleotide bases, AT content and GC content percentage of cytochrome oxidase 1 (COX1) genes: T = thymine, A = adenine, C = cytosine, G = guanine.
The overall transition/transversion bias was R = 5.62, where R = [A*G*k1 + T*C*k2]/[(A + G)*(T + C)]. These biases of COI gene substitution were measured by using a K2P model (Kimura 1980).Tajima neutrality test statisticand nucleotide diversity was also measured as Tajima D = 1.382883 and π = 0.049981 respectively. The transitional substitution ratio was shown in bold while transversional substitution ratio was shown in italics. The transitional substitution ratios from A to G, T to C, C to T and G to A were 16.49, 29.22, 28.30 and 10.43 respectively. While the transversional substitution ratios from A to T, A to C, T to A, T to G, C to A, C to G, G to T and G to C were2.10, 2.10, 2.21, 2.21, 2.14, 2.14, 1.33 and 1.33, respectively (Table 4). Different transitional substitutions rates are shown in bold and transversionsal substitutions rates are shown in italics.
A
T
C
G
A
–
2.21
2.14
10.42
T/U
2.10
–
28.30
1.33
C
2.10
29.22
–
1.33
G
16.49
2.21
2.14
–
Nucleotide base pair frequency analysis of entire data set evaluated 571 out of 681 conserved sites, 99 out of 681 variable sites, 91 out of 681 parismony sites and 7 of 681 singleton sites were observed. In this study genetic distance within and between fishes of Catla catla, Labeo calbasu, Labeo bata, Labeo gonius and Labeo rohita were measured using the Kimura 2-P model. The genetic distance within species were found to be 0 for all fishes. While the mean distance between species ranged from 0.052 to 0.105. The genetic variations between species is greate than mean distance within species which is also less than 1 %. The overall mean distance among all fishes of L. rohita, C. catla, L. calbasu, L. bata, and L. gonius was calculated as 0.07.
The data also shows that K2P distance increased with taxonomic level but above species level were smaller. In this study genetic distance were found to be less between C. catla, L. calbasu, L. gonius, L. bata, and L. rohita. For species level identification, a total of 30 COI barcode sequences from 5 distinct species were used. Identification of species were done by using GenBank and BOLD database. The GenBank and BOLD based identification of all specimens were ranged from 98.9 to 100 %. While the GenBank based identification of studied fishes of genus labeo ranged from 99.85 to 100 %.The evolutionary divergence estimation between COI gene sequences at species level were determined by using K2P model. The lowest and highest values of evolutionary divergence were found between 0.04 and 0.11. The highest estimates was observed in Labeo rohita (0.110) (Table 5).
♦♦
1
1
1
1
1
1
2
2
2
2
2
2
3
3
3
3
3
3
4
4
4
4
4
4
5
5
5
5
5
5
1
1
0.00
1
0.00
0.00
1
0.00
0.00
0.00
1
0.00
0.00
0.00
0.00
1
0.00
0.00
0.00
0.00
0.00
2
0.10
0.10
0.10
0.10
0.09
0.09
2
0.10
0.10
0.10
0.10
0.09
0.09
0.00
2
0.10
0.10
0.10
0.10
0.09
0.09
0.00
0.00
2
0.10
0.10
0.10
0.10
0.09
0.09
0.00
0.00
0.00
2
0.10
0.10
0.10
0.10
0.09
0.10
0.00
0.00
0.00
0.00
2
0.10
0.10
0.10
0.10
0.10
0.10
0.00
0.00
0.00
0.00
0.00
3
0.07
0.07
0.07
0.07
0.07
0.07
0.08
0.08
0.08
0.08
0.08
0.08
3
0.07
0.07
0.07
0.06
0.06
0.06
0.08
0.08
0.08
0.08
0.08
0.08
0.00
3
0.07
0.07
0.07
0.06
0.06
0.06
0.08
0.08
0.08
0.08
0.08
0.08
0.00
0.00
3
0.07
0.07
0.07
0.06
0.06
0.06
0.08
0.08
0.08
0.08
0.08
0.08
0.00
0.00
0.00
3
0.07
0.07
0.07
0.07
0.06
0.06
0.08
0.08
0.08
0.08
0.08
0.08
0.00
0.00
0.00
0.00
3
0.07
0.07
0.07
0.07
0.07
0.06
0.08
0.08
0.08
0.08
0.08
0.08
0.00
0.00
0.00
0.00
0.00
4
0.07
0.07
0.07
0.07
0.07
0.07
0.09
0.09
0.09
0.09
0.09
0.09
0.05
0.05
0.05
0.05
0.05
0.05
4
0.08
0.07
0.07
0.07
0.07
0.07
0.09
0.09
0.09
0.09
0.09
0.09
0.05
0.05
0.05
0.05
0.05
0.05
0.00
4
0.07
0.07
0.07
0.07
0.07
0.07
0.09
0.09
0.09
0.09
0.09
0.09
0.05
0.05
0.05
0.05
0.05
0.05
0.00
0.00
4
0.08
0.07
0.07
0.07
0.07
0.07
0.09
0.09
0.09
0.09
0.09
0.09
0.05
0.05
0.05
0.05
0.05
0.05
0.00
0.00
0.00
4
0.07
0.07
0.07
0.07
0.07
0.07
0.08
0.09
0.08
0.09
0.08
0.08
0.05
0.05
0.05
0.05
0.05
0.05
0.00
0.00
0.00
0.00
4
0.07
0.07
0.07
0.07
0.07
0.07
0.09
0.08
0.09
0.09
0.09
0.09
0.05
0.04♦
0.05
0.05
0.05
0.05
0.00
0.00
0.00
0.00
0.00
5
0.07
0.07
0.07
0.06
0.06
0.06
0.10
0.10
0.10
0.10
0.10
0.10
0.07
0.07
0.07
0.07
0.07
0.07
0.06
0.06
0.06
0.06
0.06
0.06
5
0.07
0.07
0.07
0.06
0.06
0.06
0.10
0.10
0.10
0.10
0.10
0.10
0.07
0.07
0.07
0.07
0.07
0.07
0.05
0.06
0.05
0.06
0.06
0.06
0.00
5
0.07
0.07
0.07
0.07
0.07
0.07
0.10
0.10
0.10
0.10
0.10
0.11♦
0.07
0.07
0.07
0.07
0.07
0.07
0.06
0.06
0.06
0.06
0.06
0.06
0.00
0.00
5
0.07
0.07
0.07
0.07
0.07
0.07
0.10
0.10
0.10
0.10
0.10
0.10
0.07
0.076
0.07
0.07
0.07
0.07
0.06
0.06
0.06
0.06
0.06
0.06
0.00
0.00
0.00
5
0.07
0.07
0.07
0.07
0.07
0.07
0.10
0.10
0.10
0.10
0.10
0.10
0.07
0.06
0.069
0.06
0.07
0.07
0.06
0.06
0.05
0.06
0.06
0.05
0.00
0.00
0.00
0.00
5
0.07
0.07
0.07
0.06
0.07
0.07
0.10
0.10
0.10
0.10
0.10
0.10
0.07
0.07
0.070
0.06
0.07
0.07
0.05
0.06
0.05
0.06
0.06
0.06
0.00
0.00
0.00
0.00
0.00
4.4 Barcode gap analysis
Automated barcode gap discovery analysis was used for species identification and delimitation. Morphological identified fish species were accurately delimited between 7 and 9 putative species partition with prior maximal intraspecific divergence = 0.001668 and p = 0.001000. Each delimited species were classified into a distinct group (Table 6). Although four fish species with accession number (Catla catla OP536010, Labeo bata OP738298, Labeo calbasu OP712184, Labeo rohita OP550423) were assigned into separate groups with single sequence. Every other groups of each species contained sequences of the same species.
Partition
Groups
Prior maximal distance (P)
Partition 1
9
P = 0.001000
Partition 2
7
P = 0.001668
Partition 3
5
P = 0.002783
Partition 4
5
P = 0.004642
Partition 5
5
P = 0.007743
Partition 6
5
P = 0.012915
Partition 7
5
P = 0.021544
Partition 8
5
P = 0.035938
4.5 Phylogenetic analysis
Phylogenetic tree was constructed to establishethe relationships among species. UPGMA Tree was constructed among 30 species belongs to family cyrinidae with all haptotypes and 15 species from NCBI used as reference sequence which is provided in Fig. 3. The branch length of Phylogenetic reconstruction was 0.02 of with the bootstrap test 1000 replicates in which associated sequence clustered together. This phylogenetic analysis divided cyprinidae fishes into five major clades that shown a complex relationship among fishes.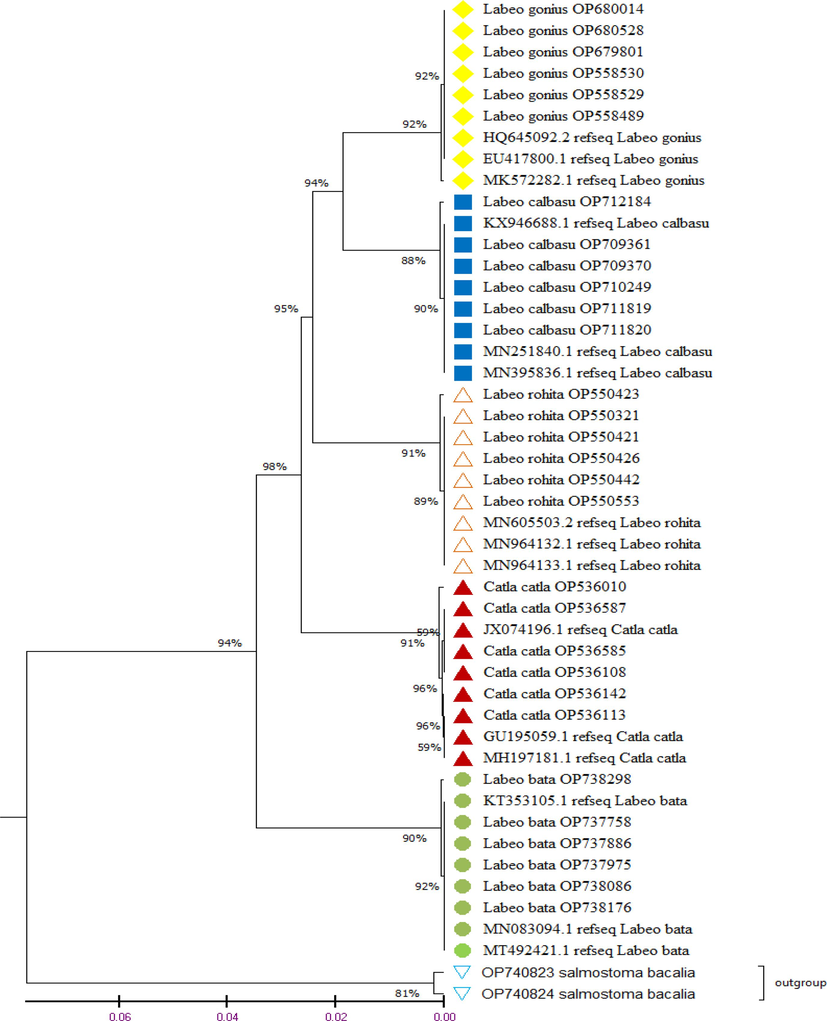
Phylogenetic relationship of fishes of family Cyprinidae from three different locations of River Indus, Pakistan by using UPGMA tree method based on the COI partial gene sequences. Adjacent numbers of the branches of tree shows ≥ 50 % bootstrap values and different colored symbols represents each identified fish species.
Specimens of the same species clustered under the same node while the different species formed separate nodes. Species of L. gonius along with reference sequence form one cluster upside-down, L. calbasu form second cluster along with reference sequence, L. rohita form third cluster along with their reference sequence, C. catla form fourth cluster and above out group, L. bata form separate cluster along with their reference sequence. These nodes were supported by bootstrap values lies between 59 % and 98 %. Salmostoma bacalia belongs to a separate genus was used as outgroup to understand the evolutionary relationship among fishes of genus labeo. The primary goal of the barcode analysis was to distinguish between the various species, even those that exhibit a high degree of taxonomic similarity. Barcode approach revealed the accurate and authentic identification of the examined species.
4.6 DNA based QR code generation
In the present study, COI-based sequences of studied labeo species were encoded in a QR code generator (aspose.app/barcode/generate) for the first time to generate QR codes for precise species identification. Each specimen has an own QR code that may be scanned using a mobile application (Fig. 4). For accurate and quick identification of fish in the Labeo genus, a DNA based QR code is produced. These barcode images make it possible for technical and scientific applications to use a QR code reader to retrieve information.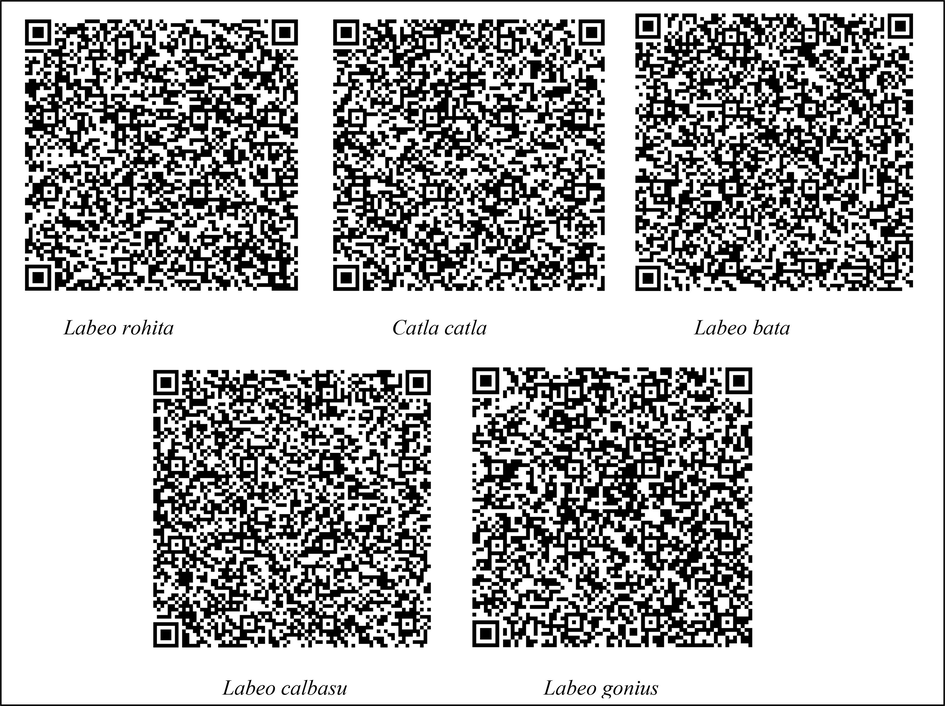
DNA based QR code of Labeo rohita, Catla catla, Labeo bata, Labeo calbasu, Labeo gonius.
5 Discussion
Total 75 fish species were recorded from the three populations of theRiver Indus Punjab, Pakistan and these belongs to family Cyprinidae. Due to high protein contents, fish is an essential organisms of aquatic ecosystem (Gulhan and Selamoglu, 2016). Fishes shows high degree of variations within and among fish population than other vertebrate and are more liable to morphological variations induced by local habitats (Biswas et al., 2018). Such variation particularly occurs due to separation of small portions of a population within habitat may cause notable genetic and phenotypic differentiation among populations within species (Turan et al., 2004). The abundance of fishes has been dropped due to alterations in the ecosystem of rivers and overharvesting which is caused by anthropogenic factors. Fish species that are specific and native to a particular region could improve both native species conservation and production (Sheraliev and Peng, 2021). The assessment of fish stock conformation is a useful tool for conserving and managing natural group’s population.
Different morphometric characters were also measured for labeo genus fishes. Morphometric differences are expected within and among species because fishes can adapt quickly themselves by changing required morphometric due to environmental changes. When the average measurements of Labeo rohita from the three population sites was compared with other four species (Table 2), it was found that L. rohita (MW) has highest TL, SL, FL, BD, HL,SnL, PrDL, PrPecL, PrPevL, PrAL than other four species. When the mean values within species was compared which found highest in Mianwali population except Labeo bata which was found higher in KallurKot population. It is difficult to determine and explain the reasons of morphological variations among different fish population. It has been recommended that morphology of fish species are determined by genetics, environment and interaction among them. Meanwhile, a fish shows higher plasticity in morphometric parameters to environmental fluctuations (Barman and Sharma, 2017).
Identification of animal species through DNA barcoding is a methodological technique based on a specific gene of mtDNA helps in the accurate identification and discrimination of unknown species (Elsaied et al., 2021). Molecular barcodes approach are useful for overlapped species discrimination, unidentified fish species identification and also for comparing with traditional taxonomy to define species limitations (Elsaied et al., 2021). For species identification, genetic barcodes method with cytochrome oxidase I gene has been well documented and acknowledged particularly in fishery. Approximately 650 bp of Cytochrome oxidase I gene (CO1) is considered to be the most effective barcoding gene. Because of various reasons such as hypermutation, absence of introns, maternal inheritance, lack of fast nucleotide substitution, slow rate of variations in amino acid sequence of COI gene as compare to other mtDNA genome (Cermakova et al., 2023). Through this approach, we can detect endangered and invasive species. Barcoding was helpful in phylogenetic analysis and identifying the diversity of the cryptic species (Ghouri et al., 2020). Almost 31,000 fish species are presents globally, out of which 25 % species have been administered experimentally with at least one fish species has been barcode from each of all 89 % fish families (Bhattacharya et al., 2016).
In the current study, five freshwater fish species of genus labeo, belonging to family Cprinidae were studied for the generation of DNA barcoding (Table 3). For all fish samples, two primers Fish F1 and Fish R1 were used to generate the sequence with the average length of 650 bp of COI gene. There were 571 consered sites, 99 variables sites, 91 parismony sites and 7 singleton sites in the barcode sequence generated. No deletion, pseudogenes, and stop codons in analyzed sequences were observed. All these views supports the amplified sequences constitute the functional COI gene sequences of mtDNA. This study is in agreement with the work of barcoding of freshwater fishes from Pakistan reported by Karim et al. (2016). Transitional substitute (si = 84.43) were found to be high than transversional substitute (sv = 15.46). Similar nucleotide pair frequency was reported in the studies of fishes in Turkey. The transitional and transversional bias in this study was R = 5.62.
The nucleotide base analysis of COI gene sequence investigated that AT contents (55.55 %) was higher than GC contents (44.45 %). Similar average nucleotide composition (AT = 55.5, GC = 44.5) was found in previous study of snow trout fishes from Kashmir valley, India (Bashir et al., 2016). These base composition indicated clear pattern of the anti-G bias and same patter has also been reported in Cyprinidae (Alam et al., 2021). Changes in codon positions of mitochondrial gene are due to vary degree of selection pressure of base mutation and base usage bias in codon position may be due to base mutation pressure.Tajima neutrality test was identified as D = 1.382883 for all species. Positive value of D indicated a strong selective pressure and lack of population expansion within examined species. That’s why we consider the hypothesis of selective neutrality. In this study nucleotide diversity among five species of family Cyprinidea was also found π = 0.049981 which is higher than the nucleotide diversity was reported in 68 species of Sicyopuszo sterophorum π = 0.0039 by Taillebois et al. (2013).
The accuracy of DNA barcodes for the identification of fish depends on the and interspecific and intraspecific divergence. To delineate species, barcode analysis was used to identify fish boundaries which parallels to divergence between the closet species within groups. Still there is a no universal threshold defined for the interspecies delineation. To define barcoding gap, lowest congeneric and highest conspecific divergence were used. This genetic difference was the more accurate than mean of intraspecific and the interspecific gene sequence variability (Bhattacharjee et al., 2012).
The mean distance within species was calculated as 0.00. The minimum genetic distance (0.04 %) was measured between two closely related taxa Labeo gonius and Labeo calbasu which was compatible with the study of Esa et al. (2012) where he reported the minimum genetic divergence (0.05 %) betweem two cyrinid fish species. Maximum evolutionary divergence (0.11 %) was found between Labeo rohita and Labeo bata. These values varies from species to species and low among closely related species but relatively higher among different ancentral species indicating the relationship between species.The overall mean distance among all fishes of L. rohita, C. catla, L. bata, L. calbasu and L. gonius was calculated as 0.07.
According to the Pereira et al. (2013), minimum values of congeneric divergence indicates minimum numbers of congeneric species of few genera with three or more species were analyzed. In present study, only one genus was studied, that’s why low values of congeneric divergence was estimated. However, low values of congeneric divergence possibily due to recent radiation of congeneric species like in Labeo genus.
Automated barcode gap discovery investigated the number of species between 7 and 9 which is based on morphological and DNA barcode identification by constructing asscession number. However, the placement of four species Catla catla OP536010, Labeo bata OP738298, Labeo calbasu OP712184, Labeo rohita OP550423) into 4 different ABGD groups revealed the presence of four different species. (Ali et al., 2020) also reported ABGD analysis to check the freshwater fish biodiversity of Egypt. Tree was constructed by using Kimura-2 Model to investigate the heirarchial relationships between species alomg with outgrop. Phylogenetic tree showed different lineage and each lineage further divided into different genus. These further divided into their corresponding species which formed a monophyletic group. Phylogenetic results showed two major clades at ≥90 % bootstrap value in Labeo genus which describing the clear cut resolution and diagnostic use of cytochrome oxidase I gene as earlier reported (Ude et al., 2020).
One clade contained four species C. catla, L. rohita, L. calbasu and L. gonius and second clade contained L. bata. These results showing close relationship among species of C. catla, L. rohita, L. calbasu and L. gonius (Fig. 3). Thus, the use of DNA barcoding was considered the most efficient and accurate for identification of species due to 100 % success rate which is recored in various study (Ude et al., 2020). Some study showed the success rate from 90 % to 99.8 % (Iyiola et al., 2018). But our study revealed the success rate 99.85 % to 100 % among species.These five species was also identified by phylogenetic analysis. However, morphometric and DNA barcoding clearly support each other for species identification and phylogeny of Labeo genus species from River Indus, Punjab Pakistan. In the current study, first time QR code generator was used for generating DNA based QR codes barcodes of studied species for the fast and precise identification of labeo species (Fig. 4). Which help to increase the consumer awareness about food quality. Because fish and fishery products are among the most internationally traded products which are at forefront for food safety (Selamoglu, 2021a,b).This is the first study to create QR codes for the molecular approaches-based identification of the examined labeo species. A DNA barcode was previously created by Yang et al. (2019) as an illustration for the accurate identification of Teleost fish species. In contrast to Yang et al. (2019), our strategy generated the DNA sequence-based QR codes rather than employing a Bio-Rad DNA barcode generator to produce barcodes.
Globally, there is a major threat to fish variety. Along with the detrimental effects of studied species, limited natural factors to native species are also getting worse (Tickner et al., 2020). Many toxic chemicals, pesticides and other inorganic compounds cause many genetic alteration in fishes species (Orun and Erdogan, 2014; Orun et al., 2005). As a result of organic waste and other human activities, the aquatic ecosystem may be greatly contaminated (Caglar et al., 2019). That’s why the numbr of biological important species is decline annually (Tickner et al., 2020). Thererfore DNA barcoding is a versatile and accurate approach to assess fish biodiversity, to manage fish resources and for fish conservation (Jaonalison et al., 2022). Unfortunately, fish diversity of Indus River in these areas has been decreased in recent years due to various purpose. In recent flood situation has also creat imbalance in fish diversity. In Pakistan vast numbr of studied fishes has used for various purpose like eating, medicinal, decoration and for research laboratory purposes. Traditional monitoring for fish management is usually expensive, time consuming. However barcode database for the conservation and assessment of fish diversity becoming the more efficient and helpful for misidentification. Molecular study for conservation of studied fishes was developed in River Indus and these data in this region will become more readily available than ever.
6 Conclusion
DNA barcoding is a beneficial and accurate approach for the species identification as compared to traditional method. The current study was first designed approach for freshwater fishes conservation and management of River Indus, Pakistan through DNA barcoding. Phylogenetic tree analysis with other published cytochrome oxidase I sequence revealed clear identity of five studied species of Labeo genus. Lack of fish species coverage at BOLD and NCBI created essential difficulties in accurate identification if used solely. Therefore different identification methods are recommended for proper and clear species identification. Thus morphometric and DNA barcoding data support each other in species identification of these studied fishes from River Indus, Pakistan.
Future research should utilize a larger sample size of fish to evaluate genetic diversity more thoroughly for the use of nuclear genes and other molecular markers to confirm the boundaries of these species. In conclusion, the fish species in these area can be accurately identified by combining morphological methods with DNA delimitation methods.
CRediT authorship contribution statement
Saba Zafar: Formal analysis, Investigation, Methodology, Validation, Writing – original draft. Farhat Jabeen: Conceptualization, Funding acquisition, Project administration, Supervision, Visualization, Writing – review & editing. Muhammad Ali: Conceptualization, Funding acquisition, Writing – review & editing. Aiman sajjad: Formal analysis, Investigation.
Acknowledgements
The authors are grateful to Higher Education Commission of Pakistan for funding this research project under grant number 5698/PUNJAB/NRPU/R&D/HEC/2016 and the Punjab Fisheries Department for helping sample collection.
Declaration of competing interest
The authors declare that they have no known competing financial interests or personal relationships that could have appeared to influence the work reported in this paper.
References
- Diversity of freshwater fish in the lower reach of Indus River, Sindh province section, Pakistan. Egypt. J. Aqua. Biol. Fish.. 2020;24(6):243-265.
- [CrossRef] [Google Scholar]
- Re-evaluation of the discriminatory power of DNA barcoding on some specimens of African Cyprinidae (subfamilies Cyprininae and Danioninae) ZooKeys. 2018;746:105.
- [CrossRef] [Google Scholar]
- Phylogenetic relations of the cyprinid fishes (Cyprinidae) in Bangladesh inferred from morphological traits and cytochrome b gene sequences. AACL Bioflux. 2021;14:1631-1644.
- [Google Scholar]
- DNA barcoding to characterize biodiversity of freshwater fishes of Egypt. Mol. Bio. Repor.. 2020;47:5865-5877.
- [CrossRef] [Google Scholar]
- Morphometric study of Labeonandina, the fresh water endangered cyprinid from Brahmaputra River, Assam and a comparative analysis with four locally available Labeo species. J. Biol. Sci.. 2017;3(5):9.
- [CrossRef] [Google Scholar]
- Morphometric variation and molecular characterization of snow trout species from Kashmir valley. India. Mit. DNA PartA. 2016;27(6):4492-4497.
- [CrossRef] [Google Scholar]
- Identification and re-evaluation of freshwater catfishes through DNA barcoding. PlosOne. 2012;7(11)
- [CrossRef] [Google Scholar]
- DNA barcoding to fishes: current status and future directions. Mitochondrial DNA PartA. 2016;27(4):2744-2752.
- [CrossRef] [Google Scholar]
- DNA barcoding of twelve shrimp species (Crustacea: Decapoda) from Turkish seas reveals cryptic diversity. Medit. Mar. Sci.. 2014;16(1):36-45.
- [CrossRef] [Google Scholar]
- Morphometric variations and meristic counts of Clupisomagarua: an approach for assessing stock structure in the River Ganga. J. Exp. Zool. India. 2018;21:813-822.
- [Google Scholar]
- Determination of some heavy metal levels in three freshwater fish in Keban Dam Lake (Turkey) for public consumption. Iran. J. Fish. Sci.. 2019;18(1):188-198.
- [CrossRef] [Google Scholar]
- Identification of fish species and targeted genetic modifications based on DNA analysis: state of the art. Foods. 2023;12(1):228.
- [CrossRef] [Google Scholar]
- Applications and challenges of DNA barcoding and metabarcoding in African fisheries. Egypt. J. Aqua. Res.. 2021;47(1):1-12.
- [CrossRef] [Google Scholar]
- Phylogenetic relationships among several freshwater fishes (Family: Cyprinidae) in Malaysia inferred from partial sequencing of the cytochrome b mitochondrial DNA (mtDNA) gene. Pertanika J. Trop. Agric. Sci.. 2012;35(2):307-318.
- [Google Scholar]
- Fricke, R., Eschmeyer, W.N., Fong, J.D., 2021. Eschmeyer's Catalog of Fishes: enera/Species by Family/Subfamily. http://researcharchive.calacademy.org/research/ichthyology/catalog/SpeciesByFamily.asp.
- Identification of edible fish species of Pakistan through DNA barcoding. Front. Mar. Sci.. 2020;7
- [CrossRef] [Google Scholar]
- Comparison of the effects of propolis and pollen extracts in the same concentrations on some biochemical and hematological parameters in rainbow trout (Oncorhynchus mykiss) J. Surv. Fish. Sci.. 2016;3(1):1-8.
- [CrossRef] [Google Scholar]
- Threatened fishes of the world: Cirrhinusreba (Cypriniformes: Cyprinidae). Croatian J. Fish. Ribarstvo. 2015;73(1):40-42.
- [CrossRef] [Google Scholar]
- DNA barcoding of economically important freshwater fish species from north-central Nigeria uncovers cryptic diversity. Ecol. Evol.. 2018;8(14):6932-6951.
- [CrossRef] [Google Scholar]
- Application of DNA barcoding for monitoring Madagascar fish biodiversity in coastal areas. Diversity. 2022;14(5):377.
- [CrossRef] [Google Scholar]
- Role of propolis on oxidative stress in fish brain. Basic Clin. Neurosci.. 2013;4(2):153.
- [Google Scholar]
- Barcoding of fresh water fishes from Pakistan. Mitochondrial DNA Part.. 2016;27(4):2685-2688.
- [CrossRef] [Google Scholar]
- Study on biometric parameters and genetic diversity of Labeo rohita from harike wetland-a ramsar site. Indian J. Animal Res.. 2021;55:617-623.
- [CrossRef] [Google Scholar]
- Role of propolis on biochemical and hematological parameters of Oncorhynchus mykiss exposed to cypermethrin. J. Surv. Fish Sci.. 2014;1(1):21-35.
- [CrossRef] [Google Scholar]
- Effects of various sodium selenite concentrations on some biochemical and hematological parameters of rainbow trout (Oncorhynchus mykiss) Fresenius Environ. Bull.. 2005;14(1):18-22.
- [Google Scholar]
- Can DNA barcoding accurately discriminate megadiverseNeotropical freshwater fish fauna? BMC Gen.. 2013;14(1):1-14.
- [CrossRef] [Google Scholar]
- Status of genetic and genomic approaches for delineating biological information and improving aquaculture production of farmed rohu, Labeorohita (Ham, 1822) Rev. Aquacul.. 2020;12(4):2466-2480.
- [CrossRef] [Google Scholar]
- Sarma, K.J., Prajapati, M., Mankodi, P.C., 2017. Morphological description and taxonomic account of Labeo species (Cypriniformes, Family: Cyprinidae) from Gujarat, India. J. Entoml. Zool. Stud. 5, 1120-1125. Corpus ID: 217180949.
- Selenium compounds for fish health: an update. J. Survey Fish. Sci.. 2018;4(2):1-4.
- [CrossRef] [Google Scholar]
- Importance of the cold chain logistics in the marketing process of aquatic products: an update study. J. Surv. Fish. Sci.. 2021;8(1):25-29.
- [CrossRef] [Google Scholar]
- The effects of the Ports and water transportation on the Aquatic ecosystem. Op Acc J Bio Sci & Res.. 2021;10(1)
- [CrossRef] [Google Scholar]
- Molecular diversity of Uzbekistan’s fishes assessed with DNA barcoding. Scientific Rep.. 2021;11(1):1-12.
- [CrossRef] [Google Scholar]
- Morphological identification and DNA barcoding study of Labeo calbasu (hamilton, 1822) from lower anicut, Tamil nadu, India. Indo – Asian J. Multidiscipl. Res.. 2015;1:355-364.
- [Google Scholar]
- Contrasting genetic structure among populations of two amphidromous fish species (Sicydiinae) in the Central West Pacific. PLoS One. 2013;8(10):e75465.
- [Google Scholar]
- Bending the curve of global freshwater biodiversity loss: an emergency recovery plan. BioSci.. 2020;70(4):330-342.
- [CrossRef] [Google Scholar]
- DNA barcoding identification of Greek freshwater fishes. PlosOne. 2022;17(1):e0263118.
- [Google Scholar]
- Morphometric structuring of the anchovy (Engraulisencrasicolus L.) in the black, Aegean and Northeastern Mediterranean seas. Turk. J. Vet. Anim. Sci.. 2004;28:865-871.
- [Google Scholar]
- DNA barcoding for identification of fish species from freshwater in Enugu and Anambra States of Nigeria. Conserv. Gen. Resour.. 2020;12(4):643-658.
- [CrossRef] [Google Scholar]
- DNA barcoding fishes. In: DNA Barcodes. Totowa, NJ: Humana Press; 2012.DNA. p. :109-126.
- [CrossRef] [Google Scholar]
- Decision theorybased COI-SNP tagging approach for 126 Scombriformes species tagging. Front. Gen.. 2019;10:259.
- [CrossRef] [Google Scholar]


