

Translate this page into:
Assessment of diversity and relative abundance of insect fauna associated with Triticum aestivum from district Sialkot, Pakistan
⁎Corresponding author. amnaghani55@gmail.com (Amna Ghani)
-
Received: ,
Accepted: ,
This article was originally published by Elsevier and was migrated to Scientific Scholar after the change of Publisher.
Peer review under responsibility of King Saud University.
Abstract
Biodiversity is variation of life. In agro-ecosystems, biodiversity is usually the calculation of comparative numbers and species of organisms. Insects are the largest and most diverse group of organisms in the world. During present study, different wheat fields of district Sialkot were sampled for the assessment of diversity and relative abundance of insect fauna. Collection of insects was carried out by the sweep net technique. A total of 896 specimens of insect fauna belonging to 15 species and 9 families were collected. Overall, maximum species diversity was observed during the month of April followed by the month of March. Highest relative abundance of sampled fauna was recorded in March (37.05%) followed by April (34.37%) while it was least in June (5.80%). This variation is probably due to temporal fluctuations observed in different months during which sampling was carried out. Overall, Schizaphis graminum (Rondani) or aphids was the most dominant species (17.52%) followed by Coccinella septempunctata (L.) (11.83%). The highly captured predator was C. septempunctata and prey was S. graminum. Simple linear regression showed the highest association between C. septempunctata (larva) and Diuraphis noxia (Kurdjumov) (R2 = 0.945). The Shannon diversity index represented the significant results regarding Diversity (H’= 2.64), Evenness (E = 0.82) and Dominance (D = 0.08) of insect fauna sampled in 2017. The Canonical Correspondence Analysis (CCA) showed the significant effect of rainfall and temperature on most of the sampled species. The current study would be helpful in future for the application of species-specific biological control in wheat field that will lead towards sustainability of agro-ecosystem.
Keywords
Biodiversity
Wheat
Insect fauna
Predator prey ratio
Biological control

1 Introduction
Biodiversity is variation of life. Species rich ecosystems are more stable than poor ecosystems. Widespread practices can cause changes in average environmental conditions that change the performance of an agro-ecosystem. Persistent association between constancy and biodiversity shows significant outcomes for the long-term viability of an area that support a variety of natural and human ecosystem (Minor, 2005; Schoowalter, 2006; Inayat et al., 2010).
The most widely utilized staple food in the world is Triticum aestivum L. Macro-invertebrate pests are generally accountable for reduced wheat yield. The major insect pests related to wheat are aphids, thrips, dipterans etc. Insecticides are sprayed in agriculture systems to control pests which encompass undesirable effects on non-target organisms and to the environment. This escalates the probability of growing different options of pest control (Eisley and Hammond, 2007; Abbas et al., 2014).
Up till now, the best method to control pests is biological control that is environment friendly, self-perpetuating and secure for non-target group of insects. Evaluation of the feeding network of generalist enemies is essential before implementation of predators for the pest management since the predator prey association can be collaborative, harmful or beneficial. The outcome will offer baseline data for more studies that will assist in their application as biological control mediators in agricultural system. (Inayat et al., 2011).
In Pakistan these studies have recently been taken into consideration (Nasir et al., 2011; Abbas et al., 2012). The current research has three study objectives. (1) the Collection and identification of flying insect fauna from wheat crop. (2) to determine the diversity and relative abundance of sampled fauna. (3) to determine feeding links of sampled fauna.
2 Materials and methods
2.1 Study area
The Sialkot is a city in the north east of Punjab, Pakistan. It has a population of 2.7 million that lives in an area of 3016 sq. km, thus, having an estimated density of 903/sq. km. With the help of meteorological center, data regarding average temperature, average rainfall and relative humidity were gathered during 2017 as 25.6 °C, 36 mm and 44.8% respectively (Table 1). The sampling period was from the beginning of January 2017 to June 2017. Selection of sampling site was carried out by considering GC Women University, Sialkot Pakistan as zero point and fixing an area of up to 50 km from this point. Four sampling sites Sambriyal, Dallowali, Wario and Kanpur were selected randomly within 50 km from GC Women university, Sialkot on any side (Fig. 1). The wheat variety MILLAT-2011 was used in these fields. Sampling was conducted fortnightly during this period and each sampling session comprised of three hours in the afternoon until sunset. Data regarding irrigation system, fertilizers, fungicides, herbicides and pesticides was collected and record was kept for further analysis (Table 2).
Months
Temperature C
% Relative Humidity
Rain fall (mm)
Wind (m/hr)
Feb 2017
16
65
44
6.3
Mar 2017
20
54
54
6.5
Apr 2017
26.65
43
30.1
6.9
May 2017
30.8
37
28
6.0
June 2017
30.8
52
65.6
6.5
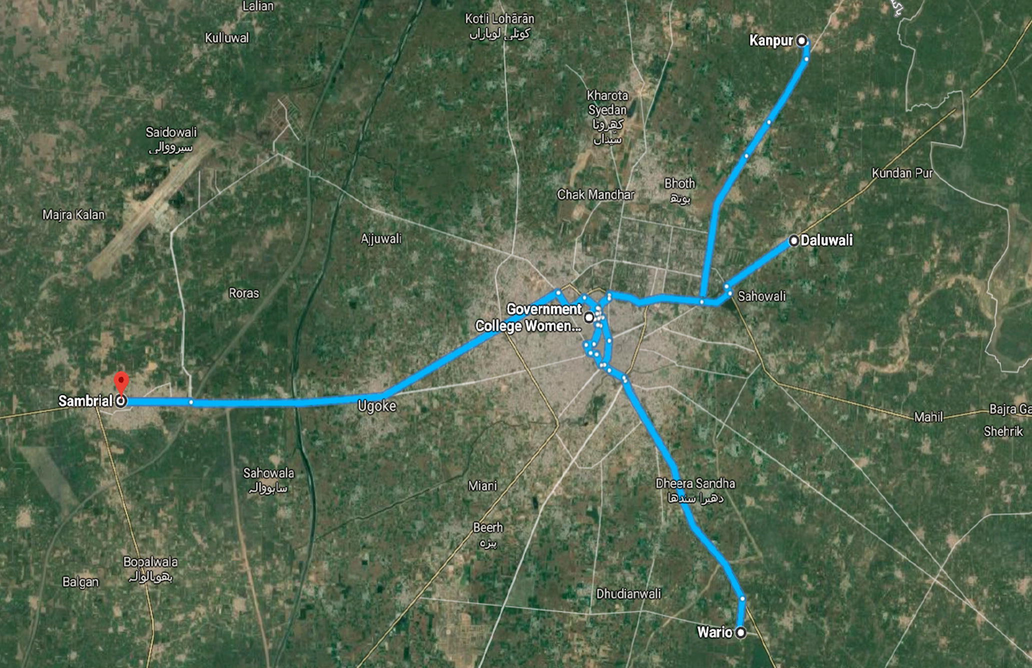
Map of sampling locations of district Sialkot, Pakistan.
Site
Fertilizers
Herbicides
Insecticides
Fungicides
Irrigation
Sambriyal
DAP-P
75–100 Kg/AcreAgro/Sona Urea
50 Kg/AcreChopper, 1l/Acre
Lambda, 1l/Acre
Tilt, 1 l/Acre
Tube Well
Kanpur
DAP
50 Kg/AcreAgro/Sona Urea
50 Kg/AcreAxial, 1 l/Acre
Lambda, 1l/Acre
_____
Tube Well
Wariyo
DAP
75 kg/Acre_____
_____
_____
Tilt, 1 l/Acre
Tube Well
Dallowali
DAP
50 Kg/AcreAgro/Sona Urea
50 Kg/AcreAxial, 1 l/Acre
_____
Tilt, 1 l/Acre
Tube Well
Timing
At Seed Sowing
After 40 Days
After 40 Days
After 100 Days
After 120 Days
_____
2.2 Collection and preservation of insects
Two fields of wheat crops were selected at each sampling site. Insects were collected by sweep net method. This method was used towards length of the field and from the center of the field by making the figure of eight on one-acre field (Maalik et al., 2013). A total of 50 sweeps were selected while moving in field 20 horizontally and 30 diagonally. Collected specimens were preserved in glass vials containing 70% alcohol as preservative with few drops of glycerin. Labeling was done with date, time of sampling, location, field number and number of samples (Inayat et al., 2011).
2.3 Identification of collected specimen
The collected specimens were identified up to species level by consulting available, classification-based information in the “Fauna of British India” by Talbot (1978), Borror and Delong (2005). This was also confirmed from online electronic keys present on different web sites, Museum of the Department of Agri-Entomology, UAF (University of Agriculture Faisalabad) and Entomological Research institute, Jhang road Faisalabad. All the institutes were taken into consideration for the purpose of identification. Sampled insects were classified as a predator or a prey after verification from the literature (Inayat et al., 2010).
2.4 Statistical analysis
The collected data was subjected to Microsoft Office 2007 at the level of significance α < 0.05. Relative abundance of sampled data was calculated using Microsoft Excel 2007. Following tests were carried out to find results at different levels.
2.4.1 Simple linear regression
Simple linear regression and R2 values were calculated which explain the significance of association between predator and prey (Inayat et al., 2011). After verification sampled insects were grouped either as predator or a prey (Inayat et al., 2010). Ratio of each predator was calculated with their all present preys. Graph was plotted by taking predator on y-axis against its prey taken on x-axis by means of Microsoft Excel 2007.
2.4.2 Shannon diversity index
Species diversity, richness and evenness were calculated performing Shannon diversity index (H′) given in Magurran (1988) to the sampled data. Month wise diversity was also recorded and t-test analysis (Abbas et al., 2012) was made to record significant differences between different months.
2.4.3 Canonical correspondence analysis
The Canonical correspondence analysis (CCA) of Kovach (1999) was also applied on the sampled data. It (CCA) permits ecologists to narrate the species abundance to the environmental variables and the significance of relationship among them.
3 Results
3.1 Diversity and relative abundance of various species
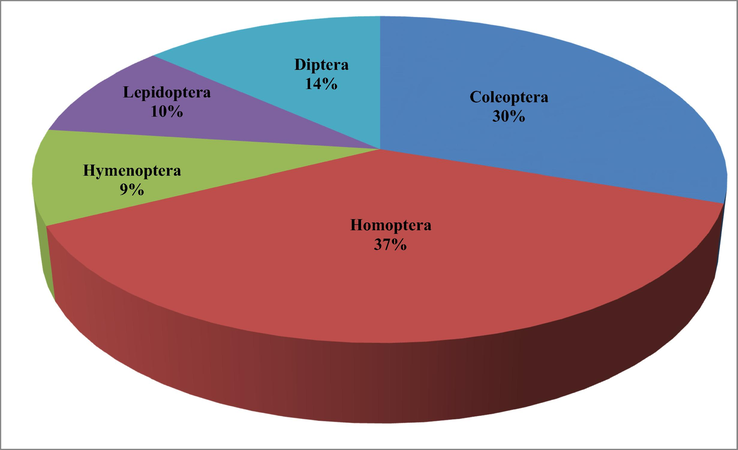
A total of 896 specimens were sampled from wheat field of district Sialkot. The pooled-up data of 2017 showed insect fauna comprising 15 (predator and preys/pests) species belonging to 9 families and 5 orders (Table 3). Collected insects belong to Homoptera (37%), Coleoptera (30%), Diptera (14%), Lepidoptera (10%) and Hymenoptera (9%) (Fig. 2). Overall, highest number of specimen (37%) belonged to family Aphididae while Chrysomelidae showed lower number of specimens (3%) (Fig. 3). S. graminum (157 specimens), C. septempunctata (106 specimens), Rhopalosiphum padi (L.) (96 specimens) and D. noxia (82 specimens) were dominant species, whereas, Ischiodon scutellaris (Fabricius) (27 specimens), Chrysolina hyperici (Forster) (26 specimens) and Coccinella hieroglyphica (L.) (17 specimens) were minimum recorded species.
Order
Family
Species
Total
Coleoptera
Coccinellidae
Coccinella septempunctata
106
Coccinella undecimpunctata
34
Coccinella hieroglyphica
17
Cheilomenes sexmaculata
38
Coccinella septempunctata(larva)
35
Coccinella septempunctata(pupa)
15
Chrysomelidae
Chrysolina hyperici
26
Homoptera
Aphididae
Schizaphis graminum
157
Diuraphis noxia
82
Rhopalosiphum padi
96
Hymenoptera
Apidae
Apis cerana
41
Vespidae
Polistes olivaceus
43
Lepidoptera
Noctuidae
Spodoptera exigua
45
Spodoptera litura
41
Diptera
Culicidae
Culex pipiens
40
Muscidae
Musca domestica
53
Syrphidae
Ischiodon scutellaris
27
Total:
896
Percentage proportion of insect sampled from wheat field by sweep method of district Sialkot, Pakistan.
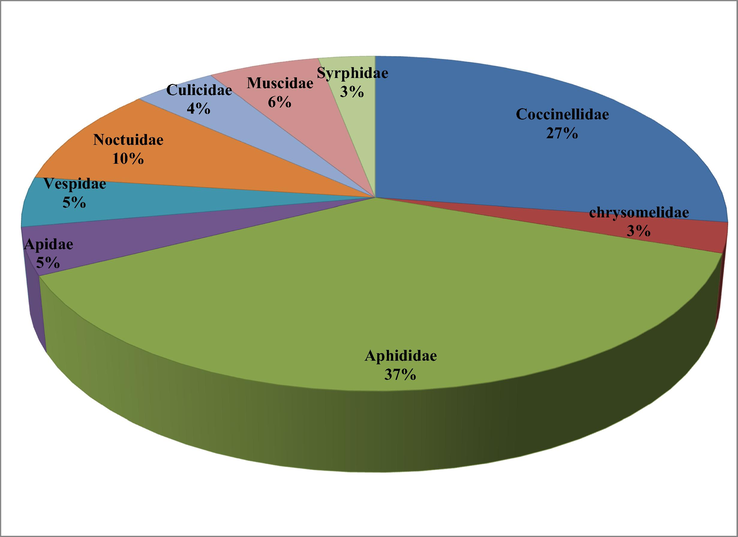
Families of insect sampled from wheat field by sweep method of district Sialkot, Pakistan.
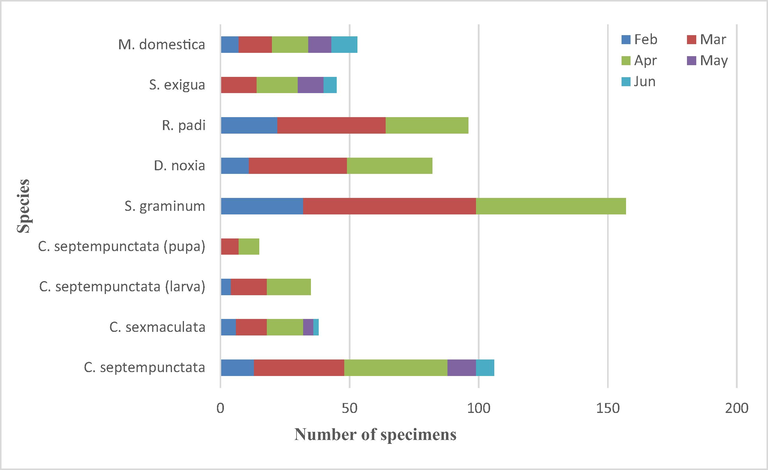
Number of insects increases from February (125 specimens) to March (332 specimens) which gradually decreases in April (308 specimens) followed by May (79 specimens) and June (52 specimens), whereas, they were absent in January (Table 4). Overall, maximum aphids were recorded in March but remained low in April. Aphids vanished from fields during May and June. A variation in number of Musca domestica (L.) and Culex pipiens (L.) was recorded from February to June. The number of beetles was at its peak in April but least number was recorded in June (Fig. 4).
Species
Feb
Mar
Apr
May
Jun
Total
Coccinella septempunctata
13
35
40
11
7
106
Coccinella undecimpunctata
7
14
8
3
2
34
Coccinella hieroglyphica
2
5
8
2
0
17
Cheilomenes sexmaculata
6
12
14
4
2
38
Coccinella septempunctata (larva)
4
14
17
0
0
35
Coccinella septempunctata (pupa)
0
7
8
0
0
15
Chrysolina hyperici
0
10
7
5
4
26
Schizaphis graminum
32
67
58
0
0
157
Diuraphis noxia
11
38
33
0
0
82
Rhopalosiphum padi
22
42
32
0
0
96
Apis cerana
6
18
9
5
3
41
Polistes olivaceus
8
14
10
7
4
43
Spodoptera exigua
0
14
16
10
5
45
Spodoptera litura
0
11
17
9
4
41
Culex pipiens
4
7
9
12
8
40
Musca domestica
7
13
14
9
10
53
Ischiodon scutellaris
3
11
8
2
3
27
Total
125
332
308
79
52
896
Month-wise diversity of selected insect fauna sampled from wheat field by sweep method of district Sialkot, Pakistan.
The highest relative abundance of collected fauna was recorded in March (37.05%) followed by April (34.37%) while it was least in June (5.80%). Relatively, S. graminum was the most dominant species (17.52%) followed by C. septempunctata (11.83%). The most abundant order was Homoptera contributing 37.38% in the collected data followed by Coleoptera 30.23%, Diptera 13.38%, Lepidoptera 9.59% and Hymenoptera 9.37% (Table 5).
Species
Feb
Mar
Apr
May
Jun
Total
Coccinella septempunctata
10.4
10.54
12.99
13.92
13.46
11.83
Coccinella undecimpunctata
5.6
4.22
2.60
3.80
3.84
3.79
Coccinella hieroglyphica
1.6
1.51
2.60
2.53
0
1.90
Cheilomenes sexmaculata
4.8
3.62
4.54
5.06
3.84
4.24
Coccinella septempunctata (larva)
3.2
4.22
5.52
0
0
3.91
Coccinella septempunctata (pupa)
0
2.12
2.60
0
0
1.67
Chrysolina hyperici
0
3.01
2.27
6.33
7.69
2.90
Schizaphis graminum
25.6
20.18
18.83
0
0
17.52
Diuraphis noxia
8.8
11.44
10.71
0
0
9.15
Rhopalosiphum padi
17.6
12.65
10.39
0
0
10.71
Apis cerana
4.8
5.42
2.92
6.33
5.77
4.57
Polistes olivaceus
6.4
4.22
3.24
8.87
7.69
4.80
Spodoptera exigua
0
4.22
5.19
12.66
9.62
5.02
Spodoptera litura
0
3.31
5.52
11.39
7.69
4.57
Culex pipiens
3.2
2.11
2.92
15.19
15.38
4.46
Musca domestica
5.6
3.92
4.54
11.39
19.23
5.91
Ischiodon scutellaris
2.4
3.31
2.59
2.53
5.77
3.01
Total
13.95
37.05
34.37
8.82
5.80
3.2 Trophic guilds
Identified insect fauna were assigned as carnivore, herbivore and omnivore based on their food habits (Table 6). The carnivorous guild was dominated by the orders Coleoptera followed by Hymenoptera and Diptera. Sampled data showed that C. septumpuctata was the most dominant predator. Other collected predators/carnivores were C. hieroglyphica, Coccinella undecimpunctata (L.), Cheilomenes sexmaculata (Fabricius), Polistes olivaceus (De Geer) and I. scutellaris. The herbivorous guild was dominated by order Homoptera followed by Lepidoptera. The numerically most captured preys/herbivores in the wheat fields were S. graminum, D. noxia and R. padi.
Specie Name
Feeding Link
Status
Coccinella septempunctata L.
Aphids, insects
(Rana et al., 2012)Carnivore/Predator
Coccinella septempunctata L. (larva)
Aphids, insects
(Abbas et al., 2012)Carnivore/Predator
Coccinella undecipunctata L.
Aphids, insects
(Cabral et al., 2009)Carnivore/Predator
Coccinella hieroglyphica L.
Aphids, insects
(Borror and Delong, 2005)Carnivore/Predator
Cheilomenes sexmaculata Fabricius
Aphids, insects
(Borror and Delong, 2005)Carnivore/Predator
Chrysolina hyperici Forster
Plant parts
(Borror and Delong, 2005)Herbivore/Prey
Diuraphis noxia Kurdjumov
Suck sap of plants(
Voothuluru et al., 2006)Herbivore/Prey/pest
Schizaphis graminum Rondani
Suck sap of plants
(Inayat et al., 2011)Herbivore/Prey/Pest
Rhopalosiphum padi L.
Suck sap of plants
(Borror and Delong, 2005)Herbivore/Prey/Pest
Apis cerana Fabricius
Pollen, nectar, honey
(Borror and Delong, 2005)Omnivores/Predator
Polistes olivaceus De Geer
Small insects, caterpillar
(Borror and Delong, 2005)Carnivore/Predator
Spodoptera exigua Hubner
Nectar, leaves, flowers
(Borror and Delong, 2005)Herbivore/Prey
Spodoptera litura Fabricius
Variety of plants
(Maalik et al., 2013)Herbivore/Prey
Culex pipiens L.
Suck blood
(Rana et al., 2012)Omnivore/Vector of Disease
Musca domestica L.
Human food, animal dung(
Iqbal et al., 2014)Omnivore/Prey
Ischiodon scutellaris Fabricius
Aphids, thrips, caterpillars(
Ghahari et al., 2008)Carnivore/Predator
3.3 Predator prey association
Presence of prey and their predators are interdependent on each other. Highest Predator prey interaction was observed between C. septempunctata (larva) and D. noxia (R2 = 0.945) followed by S. graminum (R2 = 0.895) and R. padi (R2 = 0.819) C. septempunctata showed significant association with most of its preys like D. noxia (R2 = 0.912) followed by S. graminum (R2 = 0.872) and R. padi (R2 = 0.793) (Fig. 5). C. undecimpunctata showed strongest association with R. padi (R2 = 0.806). C. sexmaculata was also significantly associated with S. graminum (R2 = 0.741) (Table 7).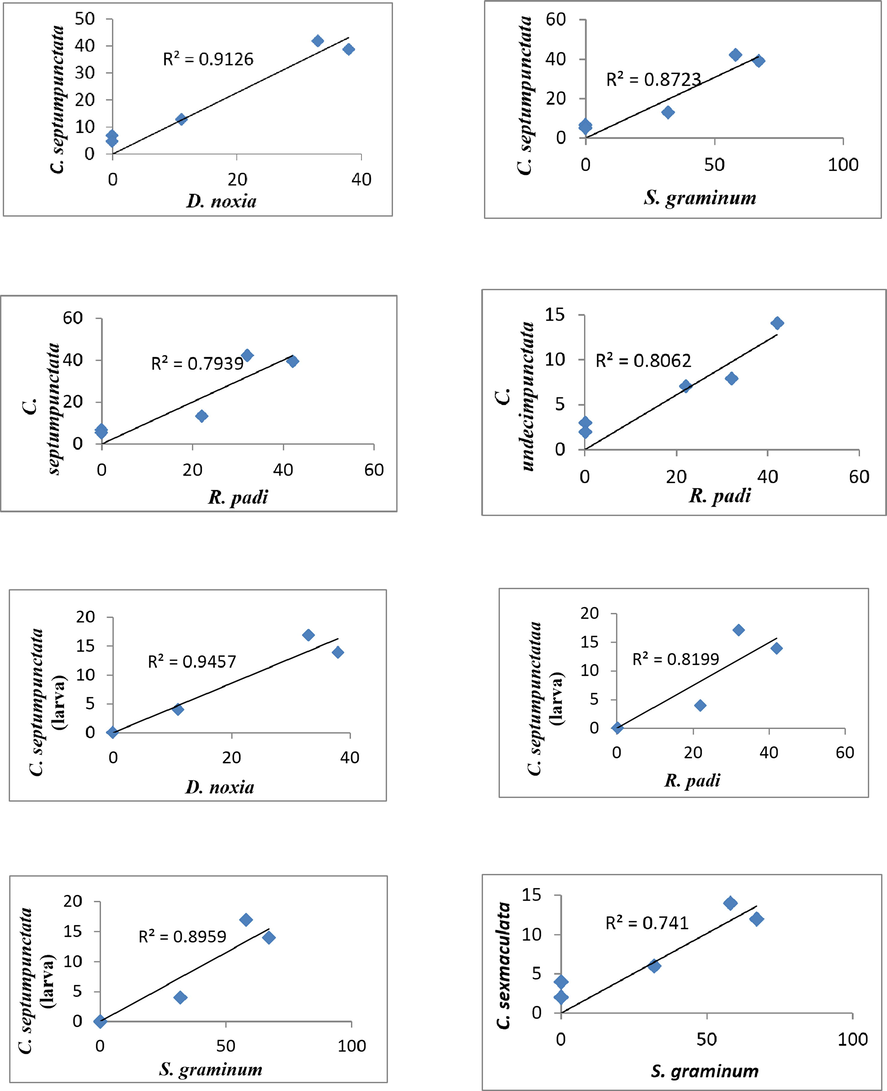
Simple linear regression showing predator prey association between selected species of insects.
Predator species
Prey species
R2 values
Coccinella septempunctata
Schizaphis graminum
0.872
Diuraphis noxia
0.912
Rhopalosiphum padi
0.793
Coccinella undecimpunctata
Schizaphis graminum
0.733
Diuraphis noxia
0.616
Rhopalosiphum padi
0.806
Coccinella hieroglyphica
Schizaphis graminum
0.665
Diuraphis noxia
0.703
Rhopalosiphum padi
0.553
Cheilomenes sexmaculata
Schizaphis graminum
0.741
Diuraphis noxia
0.709
Rhopalosiphum padi
0.656
Coccinella septempunctata (larva)
Schizaphis graminum
0.895
Diuraphis noxia
0.945
Rhopalosiphum padi
0.819
Ischiodon scutellaris
Schizaphis graminum
0.714
Diuraphis noxia
0.765
Rhopalosiphum. Padi
0.687
3.4 Shannon diversity index
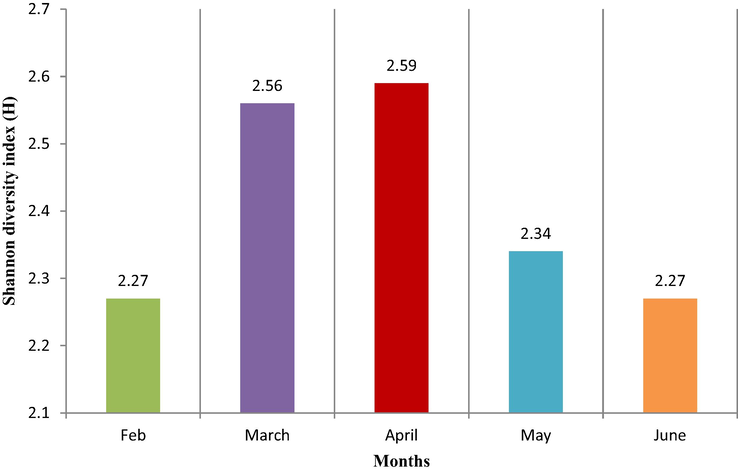
Significant results were recorded for Diversity (H′ = 2.64), Evenness (E = 0.822) and Dominance (D = 0.08) of insect fauna of wheat fields (Table 8). Comparatively, results showed the highly significant diversity in April (H′ = 2.592) followed by March (H′=2.566), May (H′=2.343), June (H′=2.272) and February (H′=2.270) (Table 9, Fig. 6). N1: Total number of species. H1: Shannon diversity index. E1: Evenness. P value for the given factor < 0.05.
Type
N1
H1
E1
Wheat
896
2.64
0.822
Months
N1
H1
E1
N2
H2
E2
t-Test
DF
P-Value
Feb Vs March
125
2.270
0.744
332
2.566
0.765
−3.630
>120
0.0001***
Feb Vs April
125
2.270
0.744
308
2.592
0.785
−3.951
>120
0.0001***
Feb Vs May
125
2.270
0.744
79
2.343
0.867
−0.776
>120
0.438
Feb Vs June
125
2.270
0.744
52
2.272
0.881
−0.016
>120
0.987
March Vs April
332
2.566
0.765
308
2.592
0.785
−0.442
>120
0.658
March Vs May
332
2.566
0.765
79
2.343
0.867
3.003
>120
0.001**
March Vs June
332
2.566
0.765
52
2.272
0.881
3.245
>120
0.001**
April Vs May
308
2.592
0.785
79
2.343
0.867
3.352
>120
0.001**
April Vs June
308
2.592
0.785
52
2.272
0.881
3.533
>120
0.0001***
May Vs June
79
2.343
0.867
52
2.272
0.881
0.698
>120
0.486
Analysis of diversity of five months of wheat crop by applying Shannon diversity index.
3.5 Canonical correspondence analysis (CCA)
Maximum number of species were significantly associated with rainfall and temperature (Fig. 7). C. sexmaculata and C. undecimpunctata were significantly associated with rainfall. Temperature was significantly associated with C. sexmaculata, Spodoptera exigua (Hubner) and Spodoptera litura (Fabricius).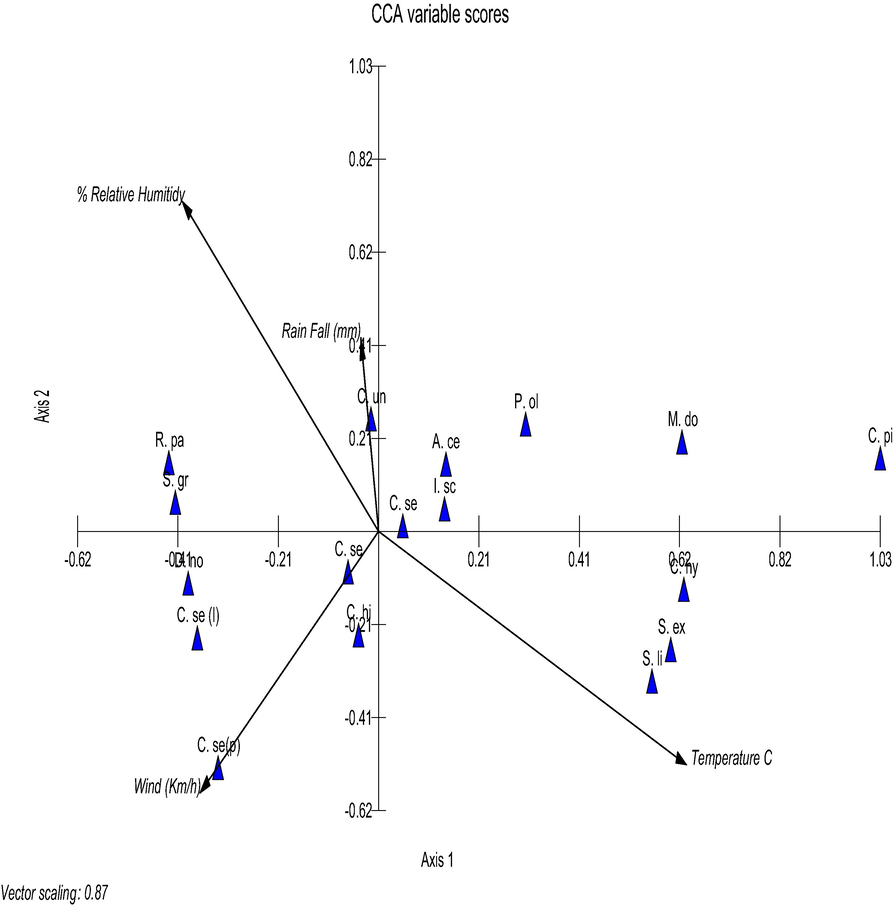
Canonical correspondence analysis (CCA) showing association of insect species (cones) with environmental factors (arrows) in the wheat fields of district Sialkot, Pakistan. Key to species: C. se (C. septempunctata), C. un (C. undecimpunctata), C. hi (C. hieroglyphica), C. se (C. sexmaculata), C. hy (C. hyperici), S. gr (S. graminum), R. pa (R. padi), D. no (D. noxia), A. ce (A. cerana), P. ol (P. olivaceus), S. ex (S. exigua), S. li (S. litura), C. pi (C. pipiens), M. do (M. domestica), I. sc (I. scutellaris).
4 Discussion
4.1 Diversity and relative abundance of various species
This study highlights the richness, abundance and diversity of the insect fauna in Sialkot. The number of sampled insects showed numerical variations in different months. Identified orders were also reported by Ruby et al. (2010) in district Faisalabad. Aphid suppression was recorded which was due to the predatory action of beetles. Rana et al. (2012) also supported the suppression of S. graminum and D. noxia due to beetles. Relative abundance of insects and diversity over the sampling period was not consistent which was primarily because of increased application of chemicals that frequently alter the ratios of pest, predator and parasitoid in an agricultural system. This was also in line with the findings of Siddiqui et al. (2005). Insects were not present in the fields in January which was due to foggy weather and harsh environmental conditions. The variations were observed in the number of aphids (Homoptera) from March to April which was due to temporal fluctuations. Kutschbach-Brohl et al. (2010) reported the parallel temporal discrepancy in diversity and abundance of a variety of insect groups such as Hemiptera and Orthoptera. Abbas et al. (2014) also explained the seasonal fluctuations such as temperature as the cause of difference in the activity of different insect species.
4.2 Trophic guilds
Generally, it is assumed that predator-prey ratios obtained from abundance data of two species clearly indicates cyclic functioning of complex food web structure. Rana et al. (2012) also supported ecological agitation as a significant aspect for ecological collapse of fundamental group from an agricultural system.
4.3 Predator prey association
Omkar et al. (1997) found that many insect predators share the same prey species, but some prey species are preferred over other species. Similarly, in present study, C. septempunctata was significantly associated with all its preys, thus, acting as a general predator, but prefers D. noxia over S. graminum. Rana et al. (2012) also quoted the status of C. septempunctata as a general predator. In wheat, D. noxia and S. graminum was preferred prey species of most of the predators as compared to other prey species. C. septempunctata and C. hieroglyphica showed higher association with aphids (D. noxia). Different predator species showed significant feeding affinities towards single prey species that seemed to confirm the reduction of other prey species as a result of use of pesticides. Inayat et al. (2011) also reported the reduction of species due to the use of pesticides. This may be because of difference in handling of the prey species by the predators. Most of the predators-prey association trend observed in current study showed constant, significant relationship.
4.4 Shannon diversity index
Significant results regarding Diversity (H′ = 2.64), Evenness (E = 0.82) and Dominance (D = 0.08) of insect fauna sampled in 2017 was recorded (Table 8). These results were in line with the findings of Inayat et al. (2010) during her research in 2007–2008 in cropland of Faisalabad. Comparatively, faunal diversity of Faisalabad (2014) was higher than the diversity of Sialkot due to excessive use of insecticides in Sialkot. The pesticide application alters the pest and predator or parasitoid ratios in the agro-ecosystems causing more harm than good. Increased use of pesticides was also supported by Tariq et al. (2007) and Siddiqui et al. (2005).
4.5 Canonical correspondence analysis (CCA)
The CCA was performed on insects to check the effect of environmental factors like rainfall, wind speed, relative humidity and temperature. Most of the species showed strong association with temperature and rainfall. Maalik et al. (2013) and Mbapila et al. (2002) reported temperature as a primary factor for development and mortality of some insects (such as Lepidopterans).
Coccinellids and aphids are significantly related to each other. Ruby et al. (2010) also reported similar results related to the predatory action of Coccinellids (C. septempunctata, C. sexmaculata, Hippodamia convergens (Guerin-meneville) and Hippodamia variegate (Goeze)) on aphids in her study in Faisalabad. Therefore, selected Coccinellids can be introduced as biocontrol agents against aphids. Dixon, (2000) also highlighted the successful introduction of C. undecimpunctata for aphid biocontrol in New Zealand. These results are in conformance with the current findings. Thus, the current study will provide essential base line information of the insect fauna to agronomists in the area. They can take steps to sustain croplands in more efficient manner, which not only lead to increases in crop yield but also stabilize the food webs in the agro-ecosystems of Central Punjab.
5 Conclusions
In this study, Significant Diversity (H′ = 2.64), Evenness (E = 0.82) and Dominance (D = 0.08) of insect faunal species were recorded from wheat crops. The most abundant species of predator was C. septempunctata and pest group was S. graminum. Maximum diversity was observed in March while minimum in June. Inconsistency in species richness and diversity could be due to temporal variation and extensive use of pesticides. Temperature and rainfall were probably the main factors among others that support the growth and development of insects. Significant R2 values showed the association of most of selected beetles with their prey species. The highest association was observed between C. septempunctata (larva) (beetles) and D. noxia (aphids) (R2 = 0.945). The predaceous Coccinellids have promising future in biological pest control. It could bring a wide shift towards farming with minimal use of pesticides that would be helpful in establishing a more stable agricultural ecosystem.
Acknowledgements
The authors thank the Museum of the Department of Agri-Entomology, UAF (University of Agriculture Faisalabad) and Entomological Research institute, Jhang road Faisalabad for helping in research. We also thank the Pakistan Meteorological Department for providing the data related to the research.
Declaration of Competing Interest
The authors declared that there is no Conflict of Interest.
References
- Status of trophic guild of invertebrates utilizing weeds of wheat and sugarcane fields of Faisalabad. Pak. J. Agr. Sci.. 2012;49(2):189-198.
- [Google Scholar]
- Biodiversity and dynamics of macro-invertebrate populations in wheat-weeds agro-ecosystem of Punjab. J. Anim. Plant Sci.. 2014;24(4):1146-1156.
- [Google Scholar]
- Predation by Coccinella undecimpunctata L. (Coleoptera: Coccinellidae) on Myzus persicae Sulzer (Homoptera: Aphididae): effect of prey density. Biological Control. 2009;50(1):25-29.
- [Google Scholar]
- Insect Predator-prey Dynamics Ladybird Beetles and Biological Control. Cambridge, United Kingdom: Cambridge University Press; 2000.
- Control of Insect Pests in Field Crops. The Ohio State University; 2007.
- Hover flies (Diptera: Syrphidae) from rice fields and around grasslands of Northern Iran. Munis Enyomology & Zoology. 2008;3(1):275-284.
- [Google Scholar]
- Diversity of insect fauna in croplands of district Faisalabad. Pak. J. Agr. Sci.. 2010;47(3):245-250.
- [Google Scholar]
- Predator-prey relationship among selected species in the croplands of central Punjab, Pakistan. Pak. J. Agr. Sci.. 2011;48(2):153-157.
- [Google Scholar]
- Role of housefly (Musca domestica, Diptera; Muscidae) as a disease vector; a review. Journal of Entomology and Zoology Studies. 2014;2(2):159-163.
- [Google Scholar]
- MVSP — A MultiVariate Statistical package for Windows, ver 3.0. Pentreath, Wales, UK: Kovach Computing Services; 1999.
- Arthropods of semi-natural grassland in an urban environment: the John F. Kennedy International Airport, New York. J. Insect Conserv.. 2010;14(1):347-358.
- [Google Scholar]
- Diversity and abundance of lepidopteran populations from selected crops of district Faisalabad, Pakistan. Pak. J. Agr. Sci.. 2013;50(1):95-101.
- [Google Scholar]
- Ecological Diversity and Its Measurement. Princeton, NJ: University Press; 1988.
- Comparative development and population growth of an exotic stemborer, Chilo partellus (Swinhoe), and an ecologically similar congener, C. orichalcociliellus (Strand) (Lepidoptera: Crambidae) Insect Sci. Appl.. 2002;22(1):21-27.
- [Google Scholar]
- Categories and inheritance of resistance to Russian wheat aphid (Homoptera: Aphididae) biotype 2 in a selection from wheat cereal introduction 2401. Journal of Economic Entomology. 2006;99(5):1854-1861.
- [Google Scholar]
- Minor, M. 2005. Soil biodiversity under different land uses in New York State. The SUNY College of Environmental Sciences and Forestry in Syracuse, Moscow State University.
- Biodiversity of staphylinids in cropped area of the Punjab (Pakistan) Pak. J. Agr. Sci.. 2011;48(1):125-128.
- [Google Scholar]
- Prey preference of a ladybeetle, Coccinella septempunctata Linnaeus (Coleoptera: Coccinellidae) J. Adv. Zool.. 1997;18(1):96-97.
- [Google Scholar]
- Predator-prey relationship among selected arthropod species in the cropland of mixed-crop zone (MCZ) and cotton-wheat zone (CWZ) J. Anim. Plant Sci.. 2012;22(4):1019-1023.
- [Google Scholar]
- Biodiversity of foliage arthropods in the mixed crop zone and cotton-wheat zone in Punjab Province, Pakistan. Int. J. Agr. Biol.. 2010;12(1):861-866.
- [Google Scholar]
- Insect ecology: An ecosystem approach. Burlington, MA: Academic Press; 2006. p. :2.
- Biodiversity of insects in high and low input wheat fields agroecosystems of Punjab. Pak. Entomol.. 2005;27(2):25-28.
- [Google Scholar]
- Talbot, G., 1978. The Fauna of British India, including Ceylon and Burma. Butterflies. Today and tomorrow’s printers and publishers, New Delhi, India. Vol.1. pp. 660.


