

Translate this page into:
Assessing the synergistic effect of acidified carbon, inorganic fertilizer, and biofertilizer on fenugreek antioxidant levels, and quality traits
⁎Corresponding authors. Qianls@ahstu.edu.cn (Lisheng Qian), niaz.ahmad@bzu.edu.pk (Niaz Ahmed),
-
Received: ,
Accepted: ,
This article was originally published by Elsevier and was migrated to Scientific Scholar after the change of Publisher.
Peer review under responsibility of King Saud University.
Abstract
The use of inorganic fertilizers has become increasingly necessary due to the depletion of soil fertility. Inadequate nutrient levels in both plants and soil can be remedied with the application of fertilizers. However, to achieve optimal results, it is recommended to supplement inorganic fertilizers with organic alternatives such as biochar. Despite its benefits, the high pH of activated carbon presents a significant challenge to its use in alkaline soil. Recent studies have shown that acidified carbon can be used instead of alkaline activated carbon. Moreover, the use of biofertilizers is crucial for maintaining soil quality. The purpose of the current study was to investigate the effects of using biofertilizers, inorganic nitrogen fertilizer, and acidified carbon fertilizer in combination on fenugreek growth and chlorophyll concentrations. A pot experiment was conducted using calcium ammonium nitrate (CAN) and three levels of acidified carbon (BC) at 0, 0.75, and 1.50%, with and without the addition of biofertilizer (BF). The results revealed that 1.50CANBC + BF was the most effective supplement for improving soil characteristics such as pH, EC, and overall organic matter. The application of 0.75CANBC + BF was found to be a successful treatment for promoting fenugreek growth and enhancing nitrogen absorption. To achieve better fenugreek quality by reducing electrolyte leakage and MDA, and increasing chlorophyll levels, gardeners are advised to use 1.50CANBC + BF. However, to establish 1.50CANBC + BF as the optimal method for fenugreek growth in poor fertility and high pH soils, further experimental studies in various agro-climatic conditions are necessary.
Keywords
Acidified carbon
Inorganic fertilizer
Biofertilizer
Fenugreek
Chlorophyll concentration
Growth characteristics

1 Introduction
Most medicinal plants are utilized in traditional and modern medicines (Jabborova et al., 2019). Fenugreek (Trigonella foenum-graecum L.), is one of such medicinal plants which belongs to Fabaceae (Gaber et al., 2020). It is also utilized as a forest legume and traditional spice. Many diseases can be cured using fenugreek. Some of the major diseases include diabetes, head colds, cancer, influenza, bronchial complaints, constipation, asthma, pneumonia, emphysema, pleurisy, sore throat, tuberculosis, and fever (Smith and others, 2003). The consumption of fenugreek seeds played a positive role in the regulation of blood cholesterol and sugar levels (Acharya et al., 2006). Furthermore, it is an important source of Vitamins B1, A, and C. Fenugreek also provides a sufficient amount of carbohydrates (40 to 60%), protein (20 to 30%), and fixed oil (5 to 10%) (El-Gawad et al., 2021). That's why it is widely cultivated as a diet for humans. However, the growth and yield of fenugreek are adversely affected due to the limited availability of nutrients especially nitrogen and poor soil health.
Intensification in the cultivation of crops at the global level is one of major factor which has depleted soil fertility (Quddus et al., 2022). Under such critical situation, inorganic fertilizers have provided a great support to replenish the depleted nutrients in soil (Quddus et al., 2022). Among variable fertilizers, nitrogen (N) fertilizers are dominant that usually growers applied for the cultivation of crops (Yang et al., 2004). It played an imperative role in the enhancement of amylose, starch contents, and chlorophyll formations in plants (Wang et al., 2021). The role of nitrogen in the formation of adenosine triphosphate is also vital which provides a significant amount of energy to the cells for metabolic action (Bassi et al., 2018). Being a part of DNA, nitrogen is considered one of the important components of the existence of life on the earth (Minchin and Lodge, 2019). On the other hand, nitrogen also played an important role in the improvements in the quality attributes of cultivated crops (Kichey et al., 2006). However, the main problem associated with the use of N fertilizers includes their potential losses in the form of leaching and volatilization (Rahman et al., 2020). Such a decrease in the availability of N as a result of their losses not only deteriorates the soil health but also played a significant role in decreasing crops productivity (Quddus et al., 2022).
Biochar is one such organic amendment that can decrease the volatilization and leaching losses of N fertilizers when applied to the soil as an amendment (Ibrahim et al., 2021; Mazhar et al., 2020). It is produced by the process of pyrolysis under a limited supply of oxygen (Lehmann et al., 2011). Different types of agricultural waste can be utilized for the manufacturing of biochar (Thies and Rillig, 2009). The nature and quality of biochar are dependent on the pyrolysis feedstock and temperature (Thies and Rillig, 2009). The high surface area and nutrient holding capacity of biochar made it the most feasible organic amendment for soil (Hashmi et al., 2019). However, the high pH of biochar made it a less feasible amendment for alkaline soils (Aslam et al., 2021; Jahan et al., 2022). To overcome this problem some this scientist suggests incorporating the acidified carbon into the soil the improvement of soil organic carbon and decreasing the soil pH (Ahmed et al., 2022; H. Sultan et al., 2020a). Acidified carbon has the potential to improve the soil organic matter and increase the bioavailability of nutrients through improvement in soil chemical attributes (Ahmed et al., 2021; H. Sultan et al., 2020a).
While significant research has been conducted on the use of biochar and inorganic nitrogen fertilizers, there is a paucity of literature exploring the efficacy of acidified carbon in conjunction with calcium ammonium nitrate (CAN). CAN was selected for this study because it contains both ammonical and nitrate forms of nitrogen, which are subject to potential losses via ammonical volatilization and nitrate leaching during crop cultivation. This study aimed to investigate the effectiveness of acidified carbon in improving the growth, chlorophyll content, nitrogen uptake, and quality of fenugreek. To address this knowledge gap, the current study aimed to investigate the performance of biofertilizer (BF) in the presence of acidified carbon (BC) and CAN on fenugreek growth, chlorophyll content, and nutrient uptake. It is hypothesized that variable application rates of BC in combination with recommended levels of CAN and BF could improve fenugreek production in low fertility and high pH soils.
2 Materials and methods
2.1 Experimental site
A pot experiment was conducted in the research area (30°15′34.9″N 71°30′52.6″E) of the department of Soil Science Faculty of Agricultural Sciences and Technology Bahauddin Zakariya University Multan. The climate of the experimental site was arid to semi-arid.
2.2 Design of experiment
The experimental design was completely randomized design (CRD). All the treatments were applied in three replicates.
2.3 Seeds collection and sowing
Fenugreek seeds were collected from the certified seed dealer of the local market. Manual screening of healthy seeds was done initially before sowing. Sowing of seeds was done manually by hand. A total of 20 seeds were sown in each pot. After germination of seeds, thinning was performed to maintain 10 seedlings per pot (Younis et al., 2015). For the soil of seeds soil was collected from research area having characteristics i.e., sand (30%), silt (30%), clay (40%), texture (clay loam), pHs (8.51), ECe (2.75 dS/m), organic matter (0.65%), total N (0.0325%), available P (3.21 mg/kg) and extractable K (114 mg/kg).
2.4 Acidified carbon manufacturing and application
Acidified carbon was manufactured according to the methodology of Sultan et al. (2020). For the acidification of carbon concentrated sulphuric acid was utilized. After that this carbon was mixed with granules of Calcium Ammonium Nitrate (CAN) (recommended application rate 8 kg N /acer) in 0.75 and 1.50% (w/w of soil) application rate. The physiochemical attribute of acidified carbon includes pH (3.42), EC (5.96 dS/m), volatile matter (25.54%), ash content (6.87%), fixed C (67.59%), total N (0.47%), total P (0.11%), total K (0.21%), total Na (0.07%) and total Ca (0.17%).
2.5 Biofertilizer
The biofertilizer was purchased from the local company. As per ingredients, the biofertilizer was enriched with the Bacillus sp. According to the application rate of the biofertilizer, 5 ml was applied on 100 g of seeds by using sugar solution (10%) as coating material. In the control, the same sugar solution was applied in the same amount on seeds to eliminate the factor of sugar.
2.6 Fertilizer application
The application of fertilizer was done at the rate of 5 kg nitrogen and 8 kg P2O5 per acre as per the requirement rate provided by the government of Punjab Pakistan. Calcium Ammonium Nitrate was purchased from a certified dealer in the local market to provide nitrogen. The fertilizer was composed of 26% ammoniacal + nitrate forms of nitrogen.
2.7 Irrigation
In each pot, irrigation was provided at the rate of 60% water holding capacity of the soil. On a weight basis, this moisture level was maintained in each throughout the experiment.
2.8 Harvesting and morphological attributes
Harvesting was done after 27 days of germination. Morphological growth i.e., attributes were examined soon after the harvesting. Assessment of shoot and root fresh weight was done on the analytical balance.
2.9 Root and shoot dry weight
For the determination of dry weight root and shoot samples were packed in a paper bag and kept in an oven at 60 ˚C for 12 h.
2.10 Chlorophyll contents
Examination of chlorophyll content in the fresh leaves was done by using acetone as extracting reagent. fresh leaf samples were ground in the acetone (80%) and after that extract was filtered from Whatman filter paper number 42. Finally, the equations of Arnon (1949) were utilized for the assessment of chlorophyll a, chlorophyll b, and total chlorophyll contents in the leaves.
2.11 Nitrogen in roots and leaves
Assessment of Nitrogen concentration in roots and leaves, samples were digested by using concentrated sulphuric acid (98%) and a digestion mixture. After digestion of samples, distillation was done on Kjeldhal’s distillation apparatus for the final assessment of total nitrogen in the roots and leaves (Bremner, 1996).
2.12 Electrolyte leakage
For the assessment of electrolyte leakage in the leaves, small discs were cut of equal in size. After that one gram of discs was dipped in a test tube having 15 ml of deionized water. Incubation was them at 25C for 2 h and initial electrical conductivity was assessed on an EC meter. After that samples were again autoclaved at 105C for 2 h and the second electrical conductivity was determined by using a pre-calibrated EC meter (Lutts et al., 1996).
2.13 Malondialdehyde (MDA)
Thiobarbituric acid (TBA) methodology was utilized for examination of MDA in leaves tissue (Cakmak and Horst, 1991). First, plant leaves were harvested and stored in a cool environment. Then, the leaves were cut into small pieces and approximately 0.1 g of fresh weight was weighed into a microcentrifuge tube. Next, 1 ml of 0.1% (w/v) TBA reagent was added to the tube. The tube was placed in a boiling water bath for 30 min to allow for the reaction between TBA and MDA to occur. After boiling, the tube was removed from the water bath and quickly transferred to an ice bath to cool the sample down. The tube was then centrifuged at 12,000 g for 10 min at 4 °C to pellet any remaining leaf debris. A 200 μl aliquot of the supernatant was taken and transferred to a new microcentrifuge tube. To this, 800 μl of n-butanol was added, the tube was vortexed vigorously, and then centrifuged at 12,000 g for 10 min at 4 °C. A 200 μl aliquot of the top layer was taken and transferred to a 96-well plate. The absorbance of the sample was then measured at 532 nm using a spectrophotometer. This methodology is commonly used to evaluate lipid peroxidation, which is an indicator of oxidative stress, in plant tissues.
2.14 Amino acid
The total amino acids were assessed as per methodology of Hamilton and Van Slyke (1943). Initially, the plant samples were homogenized using a mortar and pestle. Then, approximately 0.2 g of the homogenized sample was weighed and transferred to a test tube. Next, 1 ml of 10% (w/v) trichloroacetic acid was added to the test tube containing the sample. The mixture was then centrifuged at 5000 g for 10 min at room temperature. After centrifugation, 0.5 ml of the supernatant was transferred to a new test tube and 2.5 ml of 0.02 M sodium carbonate and 0.25 ml of 2,4-dinitrophenylhydrazine were added. The mixture was then incubated in a water bath at 37 °C for 2 h. After incubation, 5 ml of 5% (v/v) sodium hydroxide was added to the mixture to stop the reaction. The absorbance of the resulting solution was then measured at 440 nm using a spectrophotometer.
2.15 Total soluble protein
For quantification of total soluble proteins, 200 mg of fresh leaves were mixed with phosphate buffer (4 ml). Centrifugation was done for 5 min at 6,000 g. Finally supernatant absorbance was taken at 595 nm on a spectrophotometer. Total soluble protein was evaluated by using the formulae of Bradford (1976).
2.16 Statistical analysis
Standard statistical procedures were used for the analysis of data (Steel and Torrie, 1996). Two factorial analysis of variance was applied for the distinction of significance among treatments. Each treatment was compared with other treatments by Fisher's LSD test. Origin 2021 software was used for the development of graphs. Chord diagrams were made to examine the average share of each treatment for bringing changes in respective attributes.
3 Results
3.1 Soil pH, EC and OM
Results showed that under 0, 0.75 and 1.50CANBC, inoculation of biofertilizer (BF) caused significant decline in soil pH. Furthermore, soil pH was significantly lower in 0.75CANBC + BF and 1.50CANBC + BF compared to 0CANBC + BF. Similar kind of results regarding significant decrease in soil pH was also noted in 0.75CANBC and 1.50CANBC over 0CANBC (Fig. 1A). Chord diagram showed that 1.50CANBC was the best treatment for decline in soil pH compared to 0CANBC with and without BF (Fig. 1B).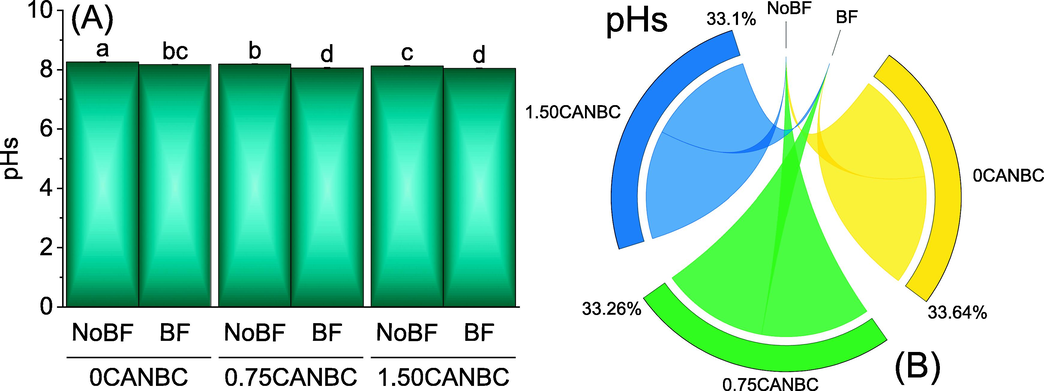
Effect of CANBC different application rates with and without biofertilizer on soil pHs. Bars are average (n = 3) ± SE. Letters on bars are showing significant changes at p ≤ 0.05 compared by Fisher LSD (A). Chord diagram is showing the percentage contribution of each CANBC treatment for soil pHs with and without BF (B). CANBC = biochar coated calcium ammonium nitrate; BF = Biofertilizer.
It was noted that that under 1.50CANBC, treatment BF caused significant enhancement in soil EC from sole application of 1.50CANBC. No significant change in soil EC was noted where 0 and 0.75CANBC were applied with and without BF. Furthermore, increasing rate of CANBC i.e., 0.75 and 1.50% also caused significant increase in soil EC over 0CANBC (Fig. 2A). Chord diagram showed that 1.50CANBC gave maximum shared for enhancement in soil EC over 0CANBC (Fig. 2B).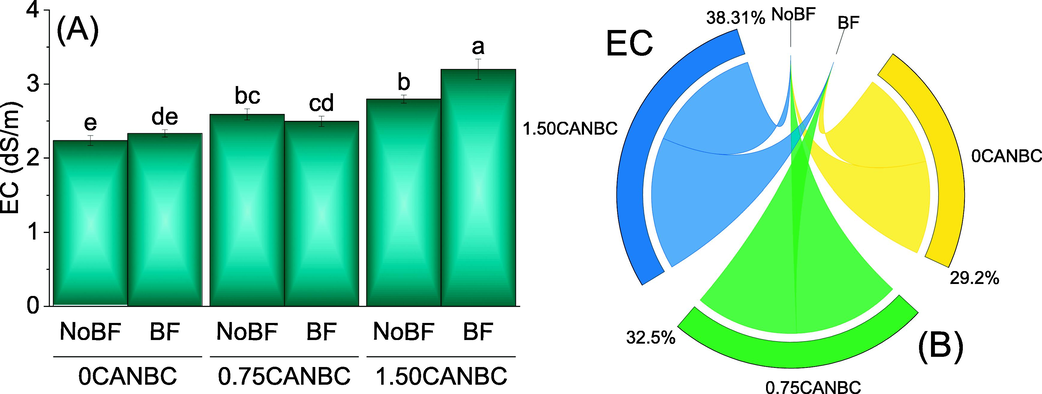
Effect of CANBC different application rates with and without biofertilizer on soil EC. Bars are average (n = 3) ± SE. Letters on bars are showing significant changes at p ≤ 0.05 compared by Fisher LSD (A). Chord diagram is showing the percentage contribution of each CANBC treatment for soil EC with and without BF (B). CANBC = biochar coated calcium ammonium nitrate; BF = Biofertilizer.
Results showed that treatments 0.75 and 1.50CANBC, caused significant enhancement in soil OM from 0CANBC with and without BF. No significant change in soil OM was observed among BF and without BF where 0 and 1.50CANBC was applied. Furthermore, a significant increase in soil OM was noted at 0.75CANBC + BF over 0.75CANBC + NoBF (Fig. 3A). Chord diagram showed that 1.50CANBC gave maximum shared for enhancement in soil OM over 0CANBC (Fig. 3B).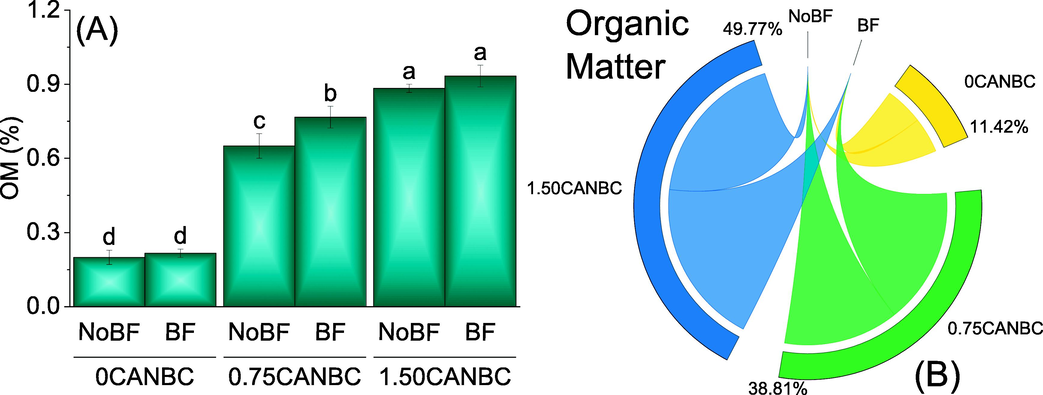
Effect of CANBC different application rates with and without biofertilizer on soil OM. Bars are average (n = 3) ± SE. Letters on bars are showing significant changes at p ≤ 0.05 compared by Fisher LSD (A). Chord diagram is showing the percentage contribution of each CANBC treatment for soil OM with and without BF (B). CANBC = biochar coated calcium ammonium nitrate; BF = Biofertilizer.
3.2 Fresh and dry weight of shoot and root
Inoculation of BF caused significant enhancement in SFW over No BF under 0, 0.75 and 1.50CANBC. Increasing rate of CANBC i.e., 0.75 and 1.50 also induced significant improvement in SFW compared to 0CANBC with BF. No significant change in SFW was observed where 0.75 and 1.50CANBC were applied without BF. However, sole application of 0.75 and 1.50CANBC remained significantly better for the enhancement in SFW compared to 0CANBC (Fig. 4A). Chord diagram showed that 1.50CANBC gave maximum shared for enhancement in SFW over 0CANBC (Fig. 4B).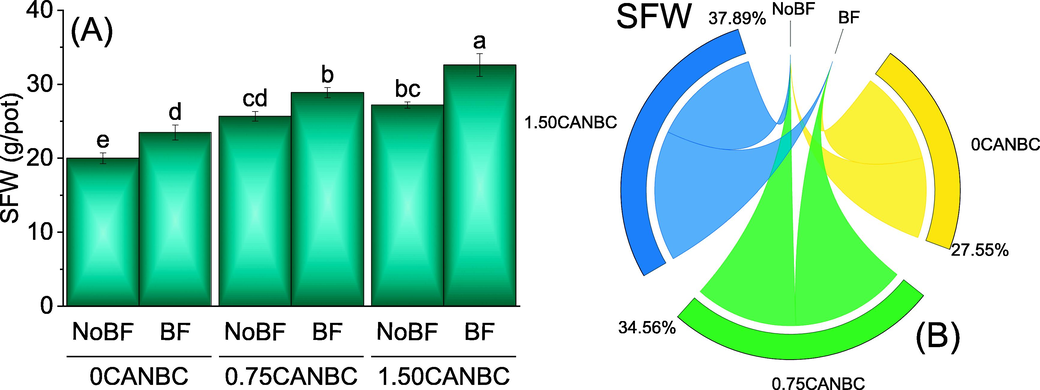
Effect of CANBC different application rates with and without biofertilizer on shoot fresh weight. Bars are average (n = 3) ± SE. Letters on bars are showing significant changes at p ≤ 0.05 compared by Fisher LSD (A). Chord diagram is showing the percentage contribution of each CANBC treatment for shoot fresh weight with and without BF (B). CANBC = biochar coated calcium ammonium nitrate; BF = Biofertilizer.
A significant improvement was noted in the RFW where BF is supplied as compared to NoBF. It was also noted that an increase in the concentration of CANBC (0.75 and 1.50%) also differed significantly for the improvement in the RFW. Treatment 1.50CANBC + BF performed significantly best for enhancement in RFW over 0CANBC + NoBF (Fig. 5A). Chord diagram showed that 1.50CANBC gave maximum shared for enhancement in RFW over 0CANBC (Fig. 5B).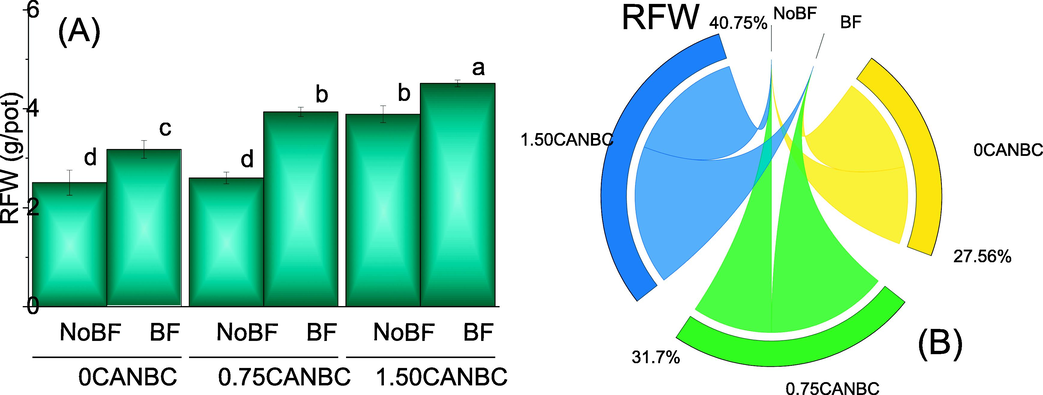
Effect of CANBC different application rates with and without biofertilizer on root fresh weight. Bars are average (n = 3) ± SE. Letters on bars are showing significant changes at p ≤ 0.05 compared by Fisher LSD (A). Chord diagram is showing the percentage contribution of each CANBC treatment for root fresh weight with and without BF (B). CANBC = biochar coated calcium ammonium nitrate; BF = Biofertilizer.
It was noted that 0.75 and 1.50CANBC + NoBF performed significantly better as over 0CANBC + NoBF for SDW. Application of 1.50CANBC + BF performed significantly best over 0 and 0.75CANBC + BF for increase in SDW. Furthermore, 0.75CANBC + BF also differed significantly for the enhancement in SDW compared to 0CANBC + BF (Fig. 6A). Chord diagram showed that 1.50CANBC gave maximum shared for enhancement in SDW over 0CANBC (Fig. 6B).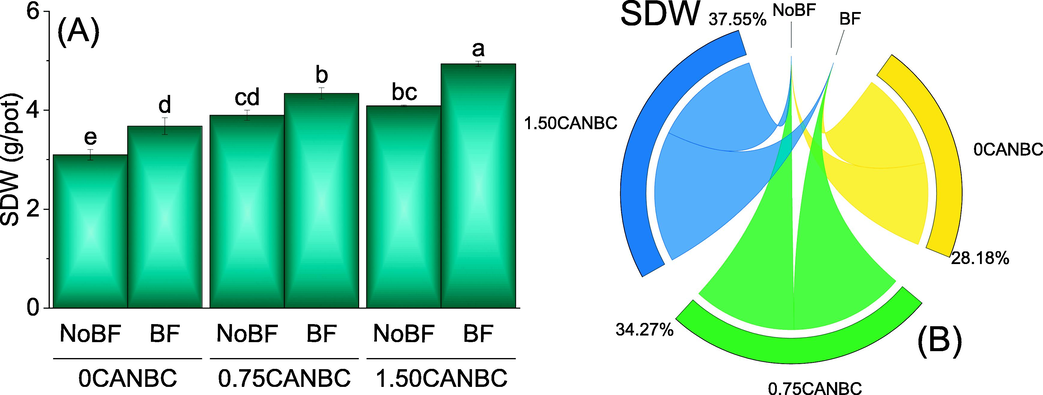
Effect of CANBC different application rates with and without biofertilizer on shoot dry weight. Bars are average (n = 3) ± SE. Letters on bars are showing significant changes at p ≤ 0.05 compared by Fisher LSD (A). Chord diagram is showing the percentage contribution of each CANBC treatment for shoot dry weight with and without BF (B). CANBC = biochar coated calcium ammonium nitrate; BF = Biofertilizer.
Results showed that 1.50CANBC + NoBF remained significantly better over 0CANBC + NoBF for RDW. No significant change was observed between 0.75CANBC + NoBF over 0CANBC + NoBF for RDW. Addition of 1.50CANBC + BF differed significantly compared to 0 and 0.75CANBC + BF for improvement in RDW. In addition to above, 0.75CANBC + BF was also significantly different for the increase in RDW over 0CANBC + BF (Fig. 7A). Chord diagram showed that 1.50CANBC gave maximum shared for enhancement in RDW over 0CANBC (Fig. 7B).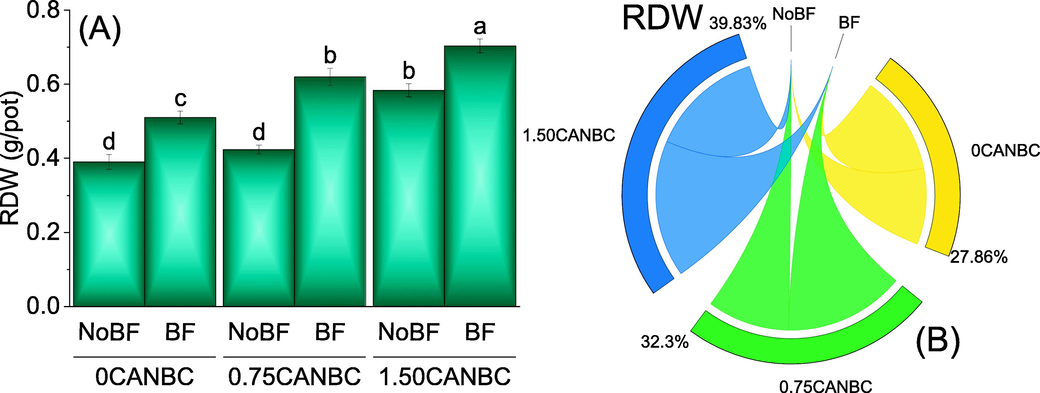
Effect of CANBC different application rates with and without biofertilizer on root dry weight. Bars are average (n = 3) ± SE. Letters on bars are showing significant changes at p ≤ 0.05 compared by Fisher LSD (A). Chord diagram is showing the percentage contribution of each CANBC treatment for root dry weight with and without BF (B). CANBC = biochar coated calcium ammonium nitrate; BF = Biofertilizer.
3.3 Chlorophyll contents
Results disclosed that both 0.75 and 1.50CANBC + NoBF were significantly different from 0CANBC + NoBF for chl. a. No significant change was noted between 0.75CANBC + NoBF and 1.50CANBC + NoBF for chl. a. Treatments 1.50CANBC + BF was significantly different from 0CANBC + BF for enhancement in Chl. a. Besides that, 0.75CANBC + BF was also significant for the increment in Chl a. over 0CANBC + BF (Fig. 8A). A significant change was also existed between 0.75CANBC + NoBF and 1.50CANBC + NoBF for chl. b. Treatments 1.50CANBC + BF was significantly better from 0CANBC + BF for increment in Chl. b. Besides that, 0.75CANBC + BF was also significant for the enhancement in Chl. b. over 0CANBC + BF (Fig. 8B). It was noted that treatment 0.75 and 1.50CANBC + NoBF caused significant improvement over 0CANBC + NoBF for T. chl. No significant variation existed between 0.75CANBC + NoBF and 1.50CANBC + NoBF for T. chl. Treatments 0.75 and 1.50CANBC + BF were significantly different from 0CANBC + BF for increment in T. Chl. (Fig. 8C).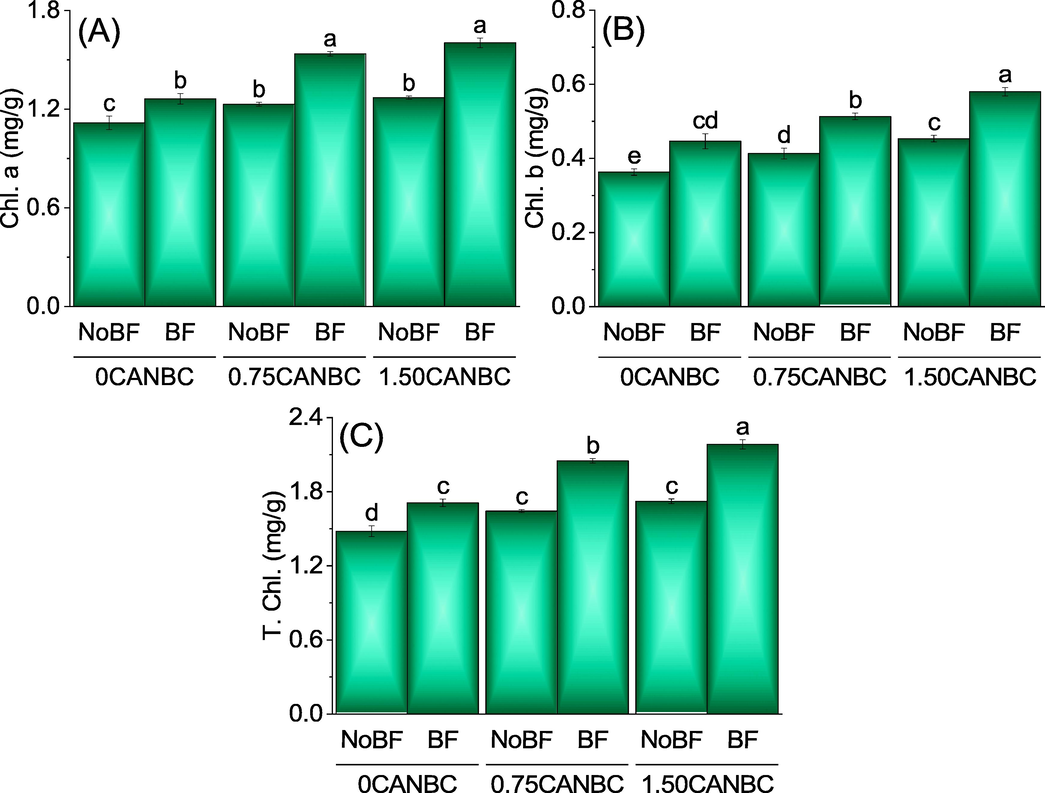
Effect of CANBC different application rates with and without biofertilizer on chlorophyll a (A), chlorophyll b (B) and total chlorophyll (C). Bars are average (n = 3) ± SE. Letters on bars are showing significant changes at p ≤ 0.05 compared by Fisher LSD (A).
3.4 Stress indicators and quality attributes
Both treatments 0.75 and 1.50CANBC + NoBF induced significant decrease over 0CANBC + NoBF in EL. No significant variation was found between 0.75CANBC + NoBF and 1.50CANBC + NoBF for EL. Treatments 1.50CANBC + BF differed significantly from 0CANBC + BF for decline in EL. However, 0.75CANBC + BF was statistically alike to 0CANBC + BF for EL. Chord diagram showed that 0CANBC gave maximum shared for decline in EL over 1.50CANBC (Table 1). Addition of 1.50CANBC + NoBF caused significant decline over 0CANBC + NoBF for AsA. No significant variation was found between 0.75CANBC + NoBF and 0CANBC + NoBF for AsA. Treatments 0.75 and 1.50CANBC + BF differed significantly from 0CANBC + BF for decrease in AsA (Table 1). Chord diagram showed that 0CANBC gave maximum shared for decline in AsA over 1.50CANBC. Results showed that addition of 0.75 and 1.50CANBC + NoBF induced significant decrease over 0CANBC + NoBF in MDA. A significant change of decline was noted between 0.75CANBC + NoBF and 1.50CANBC + NoBF for MDA. Addition of 1.50CANBC + BF remained significantly different from 0CANBC + BF for decline in MDA. Chord diagram showed that 0CANBC gave maximum shared for decline in MDA over 1.50CANBC. Addition of 0.75 and 1.50CANBC + NoBF induced significant increase over 0CANBC + NoBF in amino acid. A non-significant change of increment was noted between 0.75CANBC + NoBF and 1.50CANBC + NoBF for amino acid. Addition of 1.50CANBC + BF remained significantly different from 0CANBC + BF for enhancement in amino acid. Chord diagram showed that 1.50CANBC gave maximum shared for enhancement in amino acid over 0CANBC. Results showed that addition of 1.50CANBC + NoBF induced significant increase over 0CANBC + NoBF in protein contents. A non-significant change of increment was noted between 0.75CANBC + NoBF and 0CANBC + NoBF for protein contents. Addition of 1.50CANBC + BF remained significantly different from 0CANBC + BF for enhancement in protein contents. Chord diagram showed that 1.50CANBC gave maximum shared for improvement in protein contents over 0CANBC. Means are showing average of 3 replicates. Letters on bars are showing significant changes at p ≤ 0.05 compared by Fisher LSD. CANBC = biochar coated calcium ammonium nitrate; BF = Biofertilizer.
CANBC
Bio-fertilizer
EL
(%)AsA
(mg/g)MDA
(µg/g)Amino Acid (mg/g)
Protein (mg/g)
Mean
Label
Mean
Label
Mean
Label
Mean
Label
Mean
Label
0CANBC
NoBF
32.33
a
1.28
a
1.52
a
0.33
d
14.33
d
0CANBC
BF
20.33
cd
1.18
bc
1.33
c
0.35
cd
18.00
bc
0.75CANBC
NoBF
26.00
b
1.24
ab
1.42
b
0.38
bc
16.33
cd
0.75CANBC
BF
17.33
d
1.10
de
1.27
d
0.43
ab
21.67
a
1.50CANBC
NoBF
23.67
bc
1.14
cd
1.26
d
0.40
abc
19.33
b
1.50CANBC
BF
13.00
e
1.04
e
1.18
e
0.44
a
22.67
a
3.5 Nitrogen in leaves and roots
Application of 0.75 and 1.50CANBC + NoBF caused significant increase over 0CANBC + NoBF in leaves N. A non-significant variation was observed between 0.75CANBC + NoBF and 1.50CANBC + NoBF for leaves N. Addition of 0.75 and 1.50CANBC + BF differed significantly from 0CANBC + BF for improvement in leaves N. (Fig. 9A). Treatments 0.75 and 1.50CANBC + NoBF induced significant enhancement over 0CANBC + NoBF in roots N. A non-significant variation was observed between 0.75CANBC + NoBF and 1.50CANBC + NoBF for roots N. Addition of 0.75 and 1.50CANBC + BF were statistically alike to each other but differed significantly from 0CANBC + BF for enhancement in roots N. (Fig. 9B).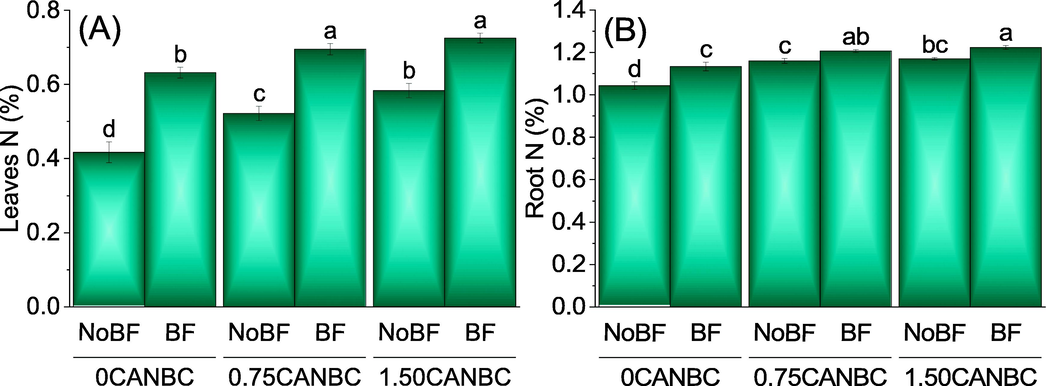
Effect of CANBC different application rates with and without biofertilizer on leaves nitrogen (A) and root N (B). Bars are average (n = 3) ± SE. Letters on bars are showing significant changes at p ≤ 0.05 compared by Fisher LSD (A).
4 Discussion
In current study, 0.75CANBC + BF and 1.50CANBC + BF performed significantly best for the enhancement in growth attributes i.e., root fresh and dry weight, chlorophyll contents and nitrogen uptake in roots and leaves. This improvement was due to improvement in soil organic matter, decrease in soil pH and better growth of roots as a results of BF inoculation along with CANBC application. Inoculation of growth promoting rhizobacteria improved the root length of plants (Hussain et al., 2022; Khan et al., 2022). Improvement in the root length played important role in increasing the water and nutrients uptake which eventually caused improvement in root and shoot fresh and dry weight (Danish et al., 2020; Hussain et al., 2022; Zafar-ul-Hye et al., 2021). Nitrogen is building components of amino acids in the plants (The et al., 2021). These amino acids act as elemental units for the manufacturing of enzymes and proteins. Nitrogen played an important role in the biosynthesis of chlorophyll and primary metabolism. Proteins are involved in a wide range of plant functions, such as enzymatic reactions, cell division, and plant defense mechanisms. When plants have access to adequate levels of amino acids, they can synthesize proteins more efficiently, leading to better growth and development. Proteins also play an important role in stress responses in plants. During periods of stress, such as drought or high temperatures, plants undergo changes in protein synthesis, resulting in the accumulation of stress-specific proteins. These proteins help plants to tolerate the stress by protecting cellular structures and maintaining cellular homeostasis (The et al., 2021). In current study, improvement in amino acids and protein was due to better uptake N in leaves and roots.
Furthermore, change in soil pH also regulates the soil nutrients. This regulation in the soil nutrients via microbial proliferation or change in soil chemical attributes enhanced the bioavailability of immobilized nutrients (Sultan et al., 2020). Better uptake of nitrogen also aids in improvement of vegetative growth in the plants. It provides energy to the plants which is required for better growth. Many plants enzymes and proteins are also manufactured by the uptake of N. This N provided the basic building block i.e., amino acid to the plants which in return improves the protein contents of plants. In current study, similar kind of findings were also noted where improvement in the nitrogen concentration also caused a significant enhancement in the amino acids and protein contents of fenugreek where 0.75CANBC + BF and 1.50CANBC + BF were applied compared to control. It was also observed that MDA and electrolyte leakage were significantly higher in the control treatment. This fact validated that fenugreek plants were subjected to stress conditions when grown in control treatment. MDA is a byproduct of lipid peroxidation, which occurs when there is an overproduction of reactive oxygen species (ROS) in plant cells under stress conditions. When MDA accumulates in plant tissues, it can cause damage to cellular membranes, which can lead to a decrease in cell function and plant growth. However, plants have developed mechanisms to detoxify MDA, including the production of enzymes such as peroxidases and catalases, which can break down MDA into harmless products (Li et al., 2022). Ascorbic acid, also known as vitamin C, is an antioxidant that can protect plant cells from damage caused by ROS. Under stress conditions, plants can increase their production of ascorbic acid to scavenge ROS and prevent oxidative stress. Ascorbic acid can also regenerate other antioxidants, such as tocopherols and glutathione, which further helps to reduce oxidative stress in plants (Dolatabadian et al., 2009). Similar kind of results were also noted in current study where chlorophyll contents were significantly decrease in control treatment fenugreek plants. Furthermore, the addition of 0.75CANBC + BF and 1.50CANBC + BF decrease the stress conditions as a result of better nitrogen and water availability which eventually caused decline in MDA and electrolyte leakage. Better uptake of N in the plants decreases the cell membrane damage via regulating the osmosis process. Such conditions decreases the synthesis of reactive oxygen species (ROS) which also minimize the MDA synthesis in the plants (Li et al., 2020). Similar results were also noted in current study where MDA was highest in control while applied treatments decrease MDA concentrations. Under abiotic conditions, stress ethylene becomes significantly high in the plants. This stress ethylene when become in contact with cell it degrades the lipid layers which provide a change to ethylene to become in direct contact with chlorophyllase (chlase) gene. Connection of ethylene activates the chlorophyllase which degrades the chloroplast and plants suffer from chlorosis (Matile et al., 1997).
5 Conclusions
Based on the findings of this study, it can be concluded that the application of 1.50CANBC + BF is an effective technique for improving soil properties, such as soil pH, soil EC, and soil organic matter, and enhancing the growth and nitrogen uptake of fenugreek. Furthermore, the addition of 0.75CANBC + BF is also an efficacious treatment for the enhancement of fenugreek growth and nitrogen uptake. However, the application of 1.50CANBC + BF is a better treatment for the improvement of quality attributes, such as protein and amino acid contents, in fenugreek. Growers are recommended to apply 1.50CANBC + BF to achieve better fenugreek growth by decreasing electrolyte leakage and MDA, and increasing chlorophyll contents.
Acknowledgement
This work was supported by the project of ‘Intelligent data acquisition and feedback system for Rapid Screening Based on Microfluidic’ and the project of ’Construction and Development of Intelligent Detection Platform for Foodborne Pathogenic Bacteria Based on Lateral-flow Biosensor’.
The authors extend their appreciation to the Researchers Supporting Project number (RSP2023R98), King Saud University, Riyadh, Saudi Arabia for financial support.
Declaration of Competing Interest
The authors declare that they have no known competing financial interests or personal relationships that could have appeared to influence the work reported in this paper.
References
- Improvement in the nutraceutical properties of fenugreek (Trigonella foenum-graecum L.) Songklanakarin J. Sci. Technol.. 2006;28:1-9.
- [Google Scholar]
- Immobilization of Cd in soil by biochar and new emerging chemically produced carbon. J. King Saud Univ. - Sci.. 2021;33:101472
- [CrossRef] [Google Scholar]
- Mitigation of lead (Pb) toxicity in rice cultivated with either ground water or wastewater by application of acidified carbon. J. Environ. Manage.. 2022;307:114521
- [CrossRef] [Google Scholar]
- Copper enzymes in isolated chloroplasts. Polyphenoloxidase in Beta vulgaris. Plant Physiol.. 1949;24:1.
- [Google Scholar]
- Effects of biochar and zeolite integrated with nitrogen on soil characteristics, yield and quality of maize (Zea mays L.) Pakistan J. Bot.. 2021;53:2047-2057.
- [Google Scholar]
- Nitrogen supply influences photosynthesis establishment along the sugarcane leaf. Sci. Rep.. 2018;8:1-13.
- [Google Scholar]
- A rapid and sensitive method for the quantitation of microgram quantities of protein utilizing the principle of protein-dye binding. Anal. Biochem.. 1976;72:248-254.
- [CrossRef] [Google Scholar]
- Bremner, M., 1996. Nitrogen-Total, in: Sumner, D.L., A.L., S., P.A., P., R.H., H., N., L.P., A., S.M., T., T.C., E., J.M. (Eds.), Methods of Soil Analysis Part 3. Chemical Methods-SSSA Book Series 5. John Wiley & Sons, Inc., Madison, WI, USA, pp. 1085–1121.
- Effect of aluminium on lipid peroxidation, superoxide dismutase, catalase, and peroxidase activities in root tips of soybean (Glycine max) Physiol. Plant.. 1991;83:463-468.
- [CrossRef] [Google Scholar]
- Mitigation of drought stress in maize through inoculation with drought tolerant ACC deaminase containing PGPR under axenic conditions. Pakistan J. Bot.. 2020;52:49-60.
- [Google Scholar]
- Alleviation of Water Deficit Stress Effects by Foliar Application of Ascorbic Acid on Zea mays L. J. Agron. Crop Sci.. 2009;195:347-355.
- [CrossRef] [Google Scholar]
- Exogenous γ-aminobutyric acid (GABA)-induced signaling events and field performance associated with mitigation of drought stress in Phaseolus vulgaris L. Plant Signal. & Behav.. 2021;16:1853384.
- [Google Scholar]
- Novel papaverine metal complexes with potential anticancer activities. Molecules. 2020;25:5447.
- [Google Scholar]
- The gasometric determination of free amino acids in blood filtrates by the ninhydrin-carbon dioxide method. J. Biol. Chem.. 1943;150:231-250.
- [Google Scholar]
- Pongamia pinnata L. leaves biochar increased growth and pigments syntheses in Pisum sativum L. exposed to nutritional stress. Agric.. 2019;9
- [CrossRef] [Google Scholar]
- Comparative effectiveness of plant growth promoting rhizobacteria and various organic carriers on wheat growth, physiology, antioxidative activities and rhizosphere properties. Pakistan J. Bot.. 2022;54:317-324.
- [Google Scholar]
- Mitigation effect of biochar on sorghum seedling growth under salinity stress. Pakistan J. Bot.. 2021;53:387-392.
- [Google Scholar]
- Jabborova, D., Davranov, K., Egamberdieva, Dilfuza, 2019. Antibacterial, antifungal, and antiviral properties of medical plants, in: Egamberdieva, D., Tiezzi, A. (Eds.), Medically Important Plant Biomes: Source of Secondary Metabolites. Springer Nature, Singapore, pp. 51–65.
- Evaluating the effects of biochar amendments on drought tolerance of soybean (Glycine max L.) using relative growth indicators. Pak. J. Bot.. 2022;54:1629-1641.
- [Google Scholar]
- Evaluation of plant growth promoting rhizobacteria (PGPR) for the control of charcoal rot of Mung bean. Pakistan J. Bot.. 2022;54:285-289.
- [Google Scholar]
- Combined agronomic and physiological aspects of nitrogen management in wheat highlight a central role for glutamine synthetase. New Phytol.. 2006;169:265-278.
- [Google Scholar]
- Biochar effects on soil biota – A review. Soil Biol. Biochem.. 2011;43:1812-1836.
- [CrossRef] [Google Scholar]
- Exogenous melatonin mitigates cadmium toxicity through ascorbic acid and glutathione pathway in wheat. Ecotoxicol. Environ. Saf.. 2022;237:113533
- [CrossRef] [Google Scholar]
- Nitrogen supply enhances the physiological resistance of Chinese fir plantlets under polyethylene glycol (PEG)-induced drought stress. Sci. Rep.. 2020;10:1-8.
- [Google Scholar]
- NaCl-induced senescence in leaves of rice (Oryza sativa L.) cultivars differing in salinity resistance. Ann. Bot.. 1996;78:389-398.
- [CrossRef] [Google Scholar]
- Localization of chlorophyllase in the chloroplast envelope. Planta. 1997;201:96-99.
- [Google Scholar]
- Amelioration potential of biochar for chromium stress in wheat. Pakistan J. Bot.. 2020;52:1159-1168.
- [Google Scholar]
- Understanding biochemistry: structure and function of nucleic acids. Essays Biochem.. 2019;63:433-456.
- [Google Scholar]
- Modification of nutrient requirements for a four crop-based cropping system to increase system productivity, maintain soil fertility, and achieve sustainable intensification. Sustainability. 2022;14:7194.
- [Google Scholar]
- Feasibility of introducing four crops based cropping patterns in Kushtia area of Bangladesh. Agric.. 2020;18:94-102.
- [Google Scholar]
- Principles and procedures of statistics A biometrical approach (3rd ed). New York, USA: McGraw Hill Book Company Inc.; 1996. p. :334-381.
- Chemical production of acidified activated carbon and its influences on soil fertility comparative to thermo-pyrolyzed biochar. Sci. Rep.. 2020;10:595.
- [CrossRef] [Google Scholar]
- Targeting nitrogen metabolism and transport processes to improve plant nitrogen use efficiency. Front. Plant Sci.. 2021;11:628366
- [Google Scholar]
- Characteristics of biochar: Biological properties. In: Biochar for Environmental Management: Science and Technology. London: Earthscan; 2009.
- [Google Scholar]
- Effects of irrigation and nitrogen on chlorophyll content, dry matter and nitrogen accumulation in sugar beet (Beta vulgaris L.) Sci. Rep.. 2021;11:1-9.
- [Google Scholar]
- Activities of key enzymes in sucrose-to-starch conversion in wheat grains subjected to water deficit during grain filling. Plant Physiol.. 2004;135:1621-1629.
- [Google Scholar]
- Growth, survival, and heavy metal (Cd and Ni) uptake of spinach (Spinacia oleracea) and fenugreek (Trigonella corniculata) in a biochar-amended sewage-irrigated contaminated soil. J. Plant Nutr. Soil Sci.. 2015;178
- [CrossRef] [Google Scholar]
- Compost mixed fruits and vegetable waste biochar with ACC deaminase rhizobacteria can minimize lead stress in mint plants. Sci. Rep.. 2021;11:6606.
- [Google Scholar]


