

Translate this page into:
Application of the improved parabola-based method in delineating lineaments of subsurface structures: A case study
⁎Corresponding author. mfnais@ksu.edu.sa (Mohammed S. Fnais)
-
Received: ,
Accepted: ,
This article was originally published by Elsevier and was migrated to Scientific Scholar after the change of Publisher.
Peer review under responsibility of King Saud University.
Abstract
Identification of lateral boundaries for the subsurface structures is a popular topic in many applications of geoscience. For this purpose, many edge detection and enhancement methods have been introduced to determine the lineaments of subsurface structures. In this study, the improved parabola-based method has been applied to reveal the lineaments of subsurface structures of Nam Dinh province. The obtained results have shown that there are NW–SE trending structures in this region and most of the lineaments are in the depth range of 2 km to 8 km. These results provide a new perspective to help us better understand the structural framework and tectonic settings of the study area.
Keywords
Gravity data
Lateral boundaries
Improved parabola-based method

1 Introduction
The gravity method is one of the oldest methods used in geophysics exploration (Elhussein, 2021). The gravity exploration programs began from the first and third of the 20th Century and continues to this day as a small but significant element in several exploration areas (Nabighian et al., 2005). Interpreting the gravity anomalies can bring information on the depths and edges of the subsurface structures (Kafadar, 2017; Kafadar, 2019; Pham et al., 2020a; Pham et al., 2020b; Pham et al., 2021a; Pham et al., 2021b). Understanding the edges of gravity sources has an important effect on mapping the geology map. Several methods have been developed to extract the edges of the gravity data. Miller and Singh (1994), Wijns et al. (2005), Nasuti et al. (2018), Zareie and Moghadam (2019) have introduced balanced methods for extracting the boundaries of the deep and shallow structures simultaneously. However, these methods produce the secondary structures in edge maps (Eldosouky et al., 2020; Pham et al., 2021c; Pham et al., 2021d; Melouah and Pham, 2021; Oksum et al., 2021). Using the amplitude-based methods, this problem can be solved. These methods have been developed by Nabighian (1972), Cordell (1979), Fedi and Florio (2001), Beiki (2010), among others. Although the amplitude-based methods can avoid bringing false structures, they are dominated by the large-amplitude signals due to the shallow structures (Pham, 2021; Pham et al., 2021e). Some authors have developed peak locating methods to overcome this problem. The use of these methods has shown great success in determining the lateral boundaries of the subsurface structures in many areas (Paoletti et al., 2004; Nasuti et al. 2012; Tschirhart and Morris, 2014; Phillips et al., 2007; Fofie et al., 2019). The parabola-based method is the first method, developed by Blakely and Simpson (1986) to determine the peaks of the signals. Kha et al. (2018) improved the parabola-based method to bring more detail to the peak. However, both methods cannot detect all peak’s locations (Pham et al., 2021f). Recently, Pham et al. (2021g) have been introduced an improved method for locating the signal peaks. The method determines the maximum locations by fitting a parabola to three successive data points.
Nam Dinh province is located in the southeastern part of the Song Hong delta, Vietnam (Fig. 1). The area is covered by Quaternary sediments, and so its deep structures are not observed on the surface. Subsurface geological structures of the area can be determined quickly and economically by assessing gravity data.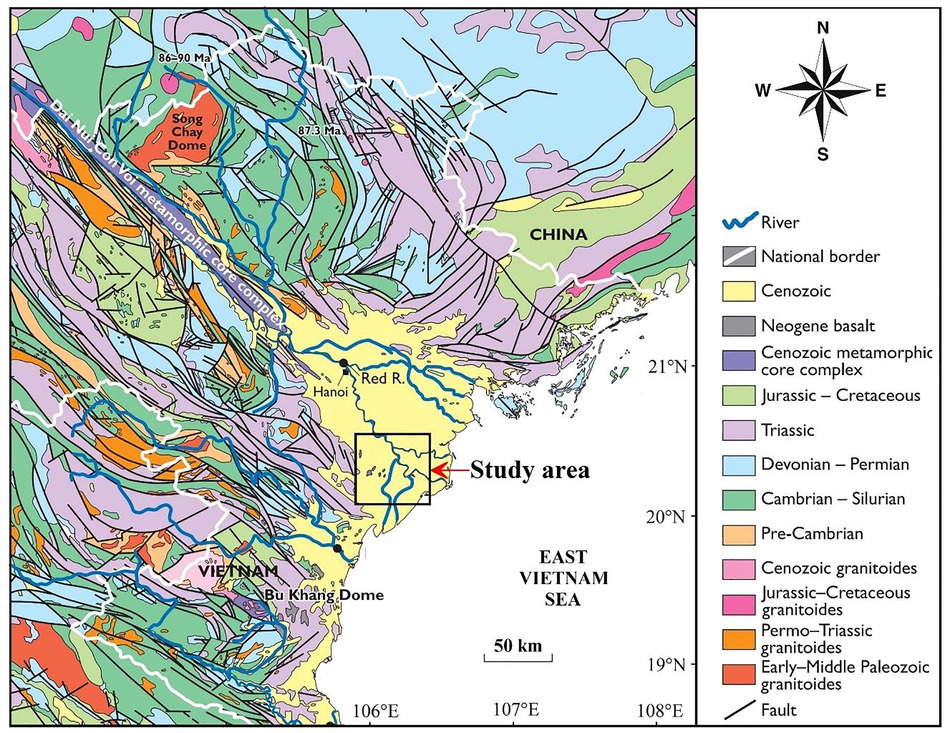
Location of the selected province on geological map (modified from Fyhn et al., 2019).
In this paper, we show the results of the improved parabola-based method (Pham et al., 2021g) applied to gravity data from Nam Dinh province (Vietnam) to extract lineaments. These results bring new information that is essential to improve the understanding of the structural framework and tectonic setting of the study area.
2 Geological setting
Nam Dinh province is located in the Northern region of Vietnam (Fig. 1) which is known as a significant part of the Tethyan orogenic belt, and is located between the Cenozoic Indochina and South China blocks (Hieu et al. 2012). It is bordered on the southeast by the Gulf of Tonkin, on the northwest by Ha Nam province, on the northeast by Thai Binh province, and on the southwest by Ninh Bình province. Nam Dinh province is a part of the Song Hong delta that is known as one of Asia's largest deltas (Tue et al., 2019; Pham, 2020). The delta formed during the Holocene as a result of the Red River sediment discharge into the East Vietnam sea (Tanabe et al., 2006). It is underlain by Cainozoic extensional basins (Fyhn and Phach, 2015) (Fig. 1). The location of the study area is shown in Fig. 1. This area extends from longitude 105°54′32″ to 106°26′19″ and latitude 20°6′59″ to 20°31′35″. It is covered by Quaternary sediments with a maximum thickness of 180 m (Phach et al., 2020).
3 Methodology
The improved parabola-based method is introduced by Pham et al. (2021g) for interpreting potential filed data. The method can be briefly introduced as follows:
Consider a 3 × 3 moving window consisting of a central grid point and its eight nearest neighbors in four directions (Fig. 2). If this window contains a maximum, it must satisfy at least one of the four following conditions:
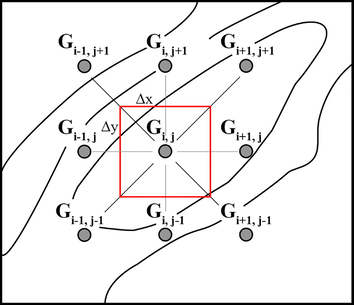
Schematic representation of locations of grid points. Curved lines display contours of the data (modified from Blakely and Simpson, 1986; Pham et al., 2021g).
A counter N is increased by one for each satisfied inequality. For each condition met, the value and location of the peak are found by fitting a quadratic polynomial moving within three consecutive data points. For the condition given below:
If number of satisfying inequality N is greater than 1, the location of the largest Gmax located inside the central grid cell (the box of size Δx × Δy) is assigned as a maximum of the window. If N is equal to 1, an acceptance criterion that is based on the curvature of the parabola at the maximum location and the maximum of the data are considered. The criterion is given by:
The acceptance criteria k is decided by the researcher. In general, k ≤ −0.04 will yield the best results. The flow diagram used to detect the maximum locations is shown in Fig. 3 (Pham et al., 2021g).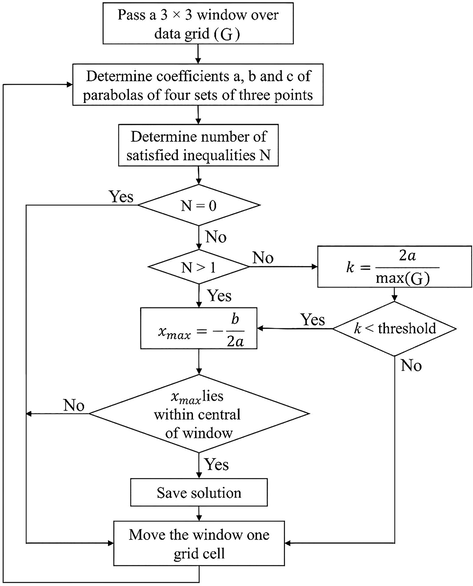
The flow chart of improved parabola-based method (Pham et al., 2021g).
Fig. 4a shows the 3D view of synthetic model that includes two prisms with the geometric and density parameters are presented in Table 1. Fig. 4b shows gravity anomalies of the model. Fig. 4c shows the gradient amplitude of the data in Fig. 4b. The maximum locations of the gradient amplitude are fully detected by the improved parabola-based method (Fig. 4d). The method brings all the information on the source edge locations.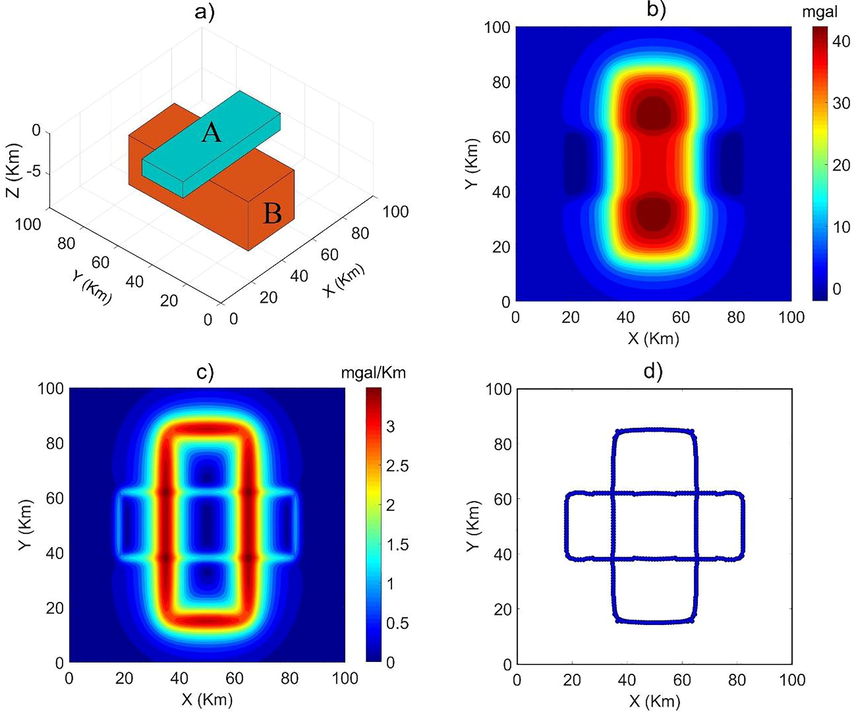
(a) 3D view of the gravity model, (b) gravity anomaly, (c) horizontal amplitude, (d) the peaks of horizontal amplitude obtained from the improved parabola-based method.
Parameters/Model label
A
B
x-coordinates of center (km)
50
50
y-coordinates of center (km)
50
50
Width (km)
12
15
Length (km)
32
35
Depth of top (km)
1
3
Depth of bottom (km)
3
9
Density contrast (g/cm3)
−0.1
0.25
4 Results and discussion
The gravity data used for extracting subsurface structures of this area were collected in 2011 by Department of Geology and Minerals of Vietnam (DGMV, 2011) (Fig. 5). In order to reduce the effect of high frequencies, an upward continuation of 1 km to the gravity data of Nam Dinh province was applied. Fig. 6a shows the upward continued Bouguer gravity map of the area. The data varies from −17 to 16 mgal with the appearance of a dominant NW–SE anomaly trend in the map. Fig. 6b shows the horizontal amplitude map of the gravity data. This map shows the presence of a dominant NW–SE structural trend, but it does not yield sharpened responses at the geological contacts. For this reason, the use of the peak locations of the horizontal amplitude brings a better estimation of lateral boundaries of the geological bodies than itself. Using the improved parabola-based method, the maximum locations of the horizontal amplitude are detected and shown in Fig. 6c. These maximum locations show subsurface structures of the study area. Fig. 6d shows the superposition of these locations on a gray-scale horizontal amplitude map. Obviously, this method can determine all peak locations of the amplitude of the horizontal gradient, and thus can be seen that most of the extracted structures are NW–SE trending lineaments. These trending lineaments are parallel to the structural trend in the Song Hong fault zone and the Red River basin (Fyhn and Phach, 2015). The results demonstrate the existence of many lineaments which are not outlined by geological mapping alone. For comparison, Fig. 7 displays the results obtained from CURVGRAV-GUI software that was developed by Kafadar (2017) using the curvature method (Phillips et al., 2007). Here, the curvature method has been applied to the gravity in Fig. 6a to detect gravity lineaments and to estimate their depth. The obtained result shows a major trend in NW–SE direction, and most of the lineaments are found to be located in the depth range of 2 km to 8 km. It is obvious that our result is in agreement with the lineaments estimated by the curvature method. Although the curvature method produces some new lineaments that are not determined by the improved parabola-based method, these lineaments may be false information, as pointed out by Pham et al. (2021f) and Pham et al. (2021g). The existence of the NW–SE trending lineaments in Fig. 6c and 7 indicates that the Red River basin appears to extend farther southeast beyond the border of the study area as the results reported by Phach et al. (2020). The obtained results can bring some references for further study within geology aims in Nam Dinh province. Also, these results suggest that the improved parabola-based method is a useful tool for delineating the lateral boundaries of the subsurface structures from gravity data.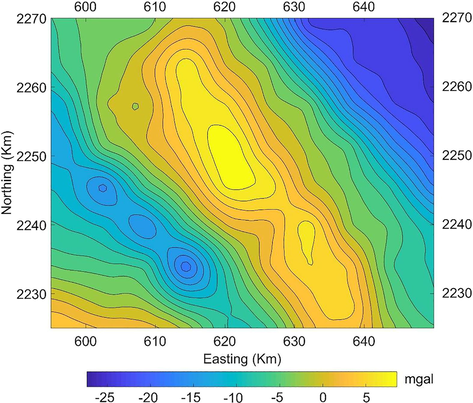
(a) Bouguer gravity map of Nam Dinh province.
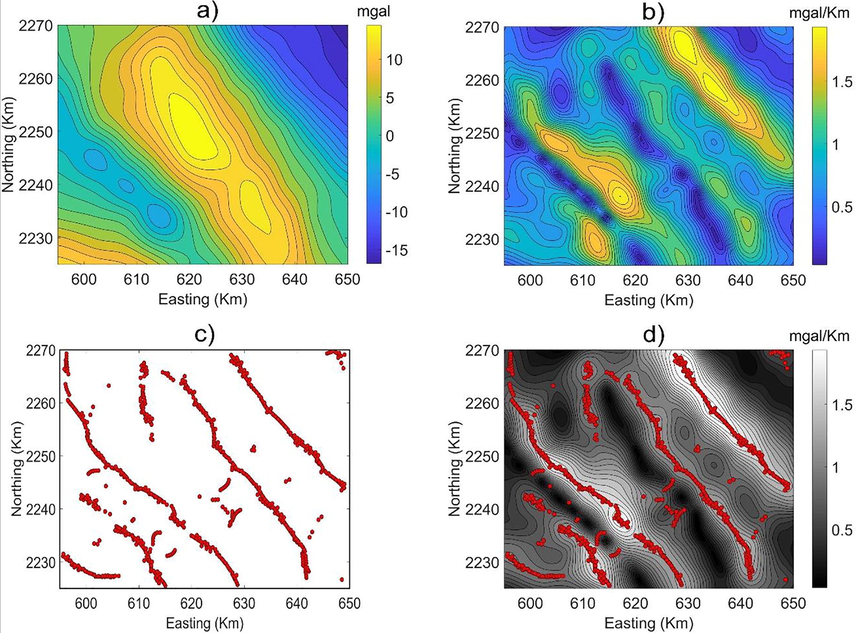
(a) Upward-continued Bouguer gravity map of the study province, (b) horizontal amplitude of data in Fig. 6a, (c) maximum locations of horizontal amplitude obtained from the improved parabola-based method, (d) maximum locations superimposed on gray-scale horizontal amplitude map.
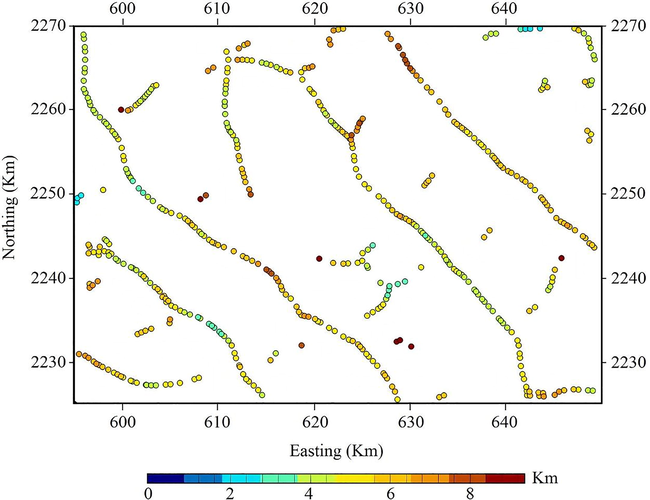
Maximum locations and depths obtained from the curvature method.
5 Conclusions
The improved parabola-based method has been applied to gravity dataset from Nam Dinh province (Vietnam) to detect lineaments of subsurface structures in the area. We have detected the maximum locations of the gradient amplitude of gravity data, which deal with lineaments of subsurface density structures. This study finds new information on the lineaments of subsurface structures of the study area. The structures in Nam Dinh are characterized by northwest-southeast tectonic trends, and most of the lineaments are found to be located in the depth range of 2 km to 8 km. The results determined by the improved parabola-based method can bring some references for further studies. The improved parabola-based method thus offers great promise for rapid mapping of subsurface structures without the assumptions on density contrasts.
Acknowledgements
Deep thanks and gratitude to the Researchers Supporting Project number (RSP-2021/351), King Saud University, Riyadh, Saudi Arabia for funding this research article.
Declaration of Competing Interest
The authors declare that they have no known competing financial interests or personal relationships that could have appeared to influence the work reported in this paper.
References
- Analytic signals of gravity gradient tensor and their application to estimate source location. Geophysics. 2010;75(6):I59-I74.
- [Google Scholar]
- Approximating edges of source bodies from magnetic or gravity anomalies. Geophysics. 1986;51(7):1494-1498.
- [Google Scholar]
- Gravimetric expression of graben faulting in Santa Fe country and the Espanola basin, New Mexico. In: New Mexico Geological Society Guidebook, 30th Field Conference. 1979. p. :59-64.
- [Google Scholar]
- DGMV, 2011. Bouguer gravity anomaly map for Northern Vietnam, Scale 1:250,000.
- A comparative study of THG, AS, TA, Theta, TDX and LTHG techniques for improving source boundaries detection of magnetic data using synthetic models: a case study from G. Um Monqul, North Eastern Desert, Egypt. J. Afr. Earth Sci.. 2020;170:103940.
- [Google Scholar]
- New inversion approach for interpreting gravity data caused by dipping faults. Earth Space Sci.. 2021;8 e2020EA001075
- [CrossRef] [Google Scholar]
- Detection of potential fields source boundaries by enhanced horizontal derivative method. Geophys. Prospect.. 2001;49(1):40-58.
- [Google Scholar]
- Lineament characteristics using gravity data in the Garoua Zone, North Cameroon: natural risks implications. Earth Planet. Phys.. 2019;3(1):33-44.
- [Google Scholar]
- Late Neogene structural inversion around the northern Gulf of Tonkin, Vietnam: effects from right-lateral displacement across the Red River fault zone. Tectonics. 2015;34(2):290-312.
- [Google Scholar]
- Detrital zircon ages and heavy mineral composition along the Gulf of Tonkin - Implication for sand provenance in the Yinggehai-Song Hong and Qiongdongnan basins. Mar. Petrol. Geol.. 2019;101:162-179.
- [Google Scholar]
- Zircon U-Pb ages and Hf isotopic compositions from the Sin Quyen Formation: the Precambrian crustal evolution of northwest Vietnam. Int. Geol. Rev.. 2012;54(13):1548-1561.
- [Google Scholar]
- CURVGRAV-GUI: a graphical user interface to interpret gravity data using curvature technique. Earth Sci. Inform.. 2017;10(4):525-537.
- [Google Scholar]
- Estimation of the Depth and Shape of the Source from Derivatives of Residual Gravity Data Using the Parametric Curves Technique: a Case Study from Erzincan-Çayırlı Region, Turkey. Erzincan Üniversitesi Fen Bilimleri Enstitüsü Dergisi. 2019;12(1):294-305.
- [Google Scholar]
- Improving a maximum horizontal gradient algorithm to determine geological body boundaries and fault systems based on gravity data. J. Appl. Geophys.. 2018;152:161-166.
- [Google Scholar]
- Improved ILTHG method for edge enhancement of geological structures: application to gravity data from the Oued Righ valley. J. Afr. Earth Sci.. 2021;177:104162
- [Google Scholar]
- Potential feld tilt a new concept for location of potential feld sources. J. Appl. Geophys.. 1994;32:213-217.
- [Google Scholar]
- The analytic signal of two-dimensional magnetic bodies with polygonal cross-section: its properties and use of automated anomaly interpretation. Geophysics. 1972;37:507-517.
- [Google Scholar]
- Historical development of the gravity method in exploration. Geophysics. 2005;70(6):63ND-89ND.
- [Google Scholar]
- Onshore–offshore potential field analysis of the Møre-Trøndelag Fault Complex and adjacent structures of Mid Norway. Tectonophysics. 2012;518-521:17-28.
- [Google Scholar]
- STDR: A novel approach for enhancing and edge detection of potential field data. Pure Appl. Geophys.. 2018;176(2):827-841.
- [Google Scholar]
- A novel approach based on the fast sigmoid function for interpretation of potential field data. Boll Geofis Teor Appl. 2021
- [CrossRef] [Google Scholar]
- Tectonic Activities and Evolution of the Red River Delta (North Viet Nam) in the Holocene. Geotectonics. 2020;54(1):113-129.
- [Google Scholar]
- The new integrated aeromagnetic map of the Phlegrean Fields volcano and surrounding areas. Ann. Geophys.. 2004;47(5):1569-1580.
- [Google Scholar]
- A comparative study on different filters for enhancing potential field source boundaries: synthetic examples and a case study from the Song Hong Trough (Vietnam) Arab. J. Geosci.. 2020;13:723.
- [Google Scholar]
- A high resolution edge detector for interpreting potential field data: a case study from the Witwatersrand basin, South Africa. J. Afr. Earth Sci.. 2021;178:104190.
- [Google Scholar]
- Enhancement of potential field source boundaries using an improved logistic filter. Pure Appl. Geophys.. 2020;177(11):5237-5249.
- [Google Scholar]
- A new high resolution fllter for source edge detection of potential field data. Geocarto Int. 2020
- [CrossRef] [Google Scholar]
- GRV_D_inv: A graphical user interface for 3D forward and inverse modeling of gravity data. Geofizicheskiy Zhurnal. 2021;43(1):181-193.
- [Google Scholar]
- Performance evaluation of amplitude- and phase-based methods for estimating edges of potential field sources. Iran. J. Sci. Technol. Trans. Sci.. 2021;45(4):1327-1339.
- [CrossRef] [Google Scholar]
- On the performance of phase-based filters for enhancing lateral boundaries of magnetic and gravity sources: a case study of the Seattle Uplift. Arab. J. Geosci.. 2021;14(2)
- [Google Scholar]
- Edge detection of potential field sources using the softsign function. Geocarto Int. 2021
- [CrossRef] [Google Scholar]
- Subsurface structural mapping from high-resolution gravity data using advanced processing methods. J. King Saud Univ. – Sci.. 2021;33(5):101488.
- [Google Scholar]
- An improved approach for detecting ridge locations to interpret the potential feld data for more accurate structural mapping: a case study from Vredefort dome area (South Africa) J. Afr. Earth Sci.. 2021;175:104099
- [Google Scholar]
- An improved approach for detecting the locations of the maxima in interpreting potential feld data. Arab. J. Geosci.. 2021;14:43.
- [Google Scholar]
- The use of curvature in potential-field interpretation. Explor. Geophys.. 2007;38(2):111-119.
- [Google Scholar]
- Holocene evolution of the Song Hong (Red River) delta system, northern Vietnam. Sediment. Geol.. 2006;187(1-2):29-61.
- [Google Scholar]
- Improved edge detection mapping through stacking and integration: a case study in the Bathurst Mining Camp. Geophys. Prospect.. 2014;63(2):283-295.
- [Google Scholar]
- Holocene environmental changes in Red River delta, Vietnam as inferred from the stable carbon isotopes and C/N ratios. J. Earth Syst. Sci.. 2019;128:15.
- [Google Scholar]
- The application of theta method to potential field gradient tensor data for edge detection of complex geological structures. Pure Appl.Geophys.. 2019;176(11):4983-5001.
- [Google Scholar]
Appendix A
Supplementary data
Supplementary data to this article can be found online at https://doi.org/10.1016/j.jksus.2021.101585.
Appendix A
Supplementary data
The following are the Supplementary data to this article:


