Translate this page into:
Application of the enhanced horizontal gradient amplitude (EHGA) filter in mapping of geological structures involving magnetic data in southeast Nigeria
⁎Corresponding author. ahmed.eldosouky@sci.suezuni.edu.eg (Ahmed M. Eldosouky)
-
Received: ,
Accepted: ,
This article was originally published by Elsevier and was migrated to Scientific Scholar after the change of Publisher.
Peer review under responsibility of King Saud University.
Abstract
Lineament detector and depth estimation method involving modern aeromagnetic data were employed to study parts of the Obudu Plateau and Lower Benue Trough (southeast Nigeria) with the aim of mapping thermo-tectonic geologic structures and estimating sediment thicknesses. In this investigation, the enhanced horizontal gradient amplitude (EHGA) (applied to both simulated and real data) and tilt depth approaches were operated. The simulated magnetic model employing the EHGA detector generated sharp and properly defined edges of magnetic bodies with the capacity to place peaks over source borders. The tilt depth technique showed thin and thick sedimentations that vary from ∼ 500 to ∼ 1000 m and ∼ 1500 to ∼ 2500 m, respectively. The observed geologic structures trend mainly in the NW and NE, as well as minor NS directions. These structures, generated by the Younger Mesozoic Granitic intrusions of calc alkaline ring complexes, and the Santonian Abakaliki Anticlinorium serve as paths for super enriched hydrothermal fluids migration and deposition. The applied methods can be used to decipher the geologic structures in alike zones around the world.
Keywords
Magnetic method
EHGA
Lower Benue Trough
Obudu Plateau
Southeast Nigeria
1 Introduction
Geophysical studies involving the potential field (PF) techniques detect the small variations in physical rock properties (density and magnetization) (Telford 1990). These physical properties can offer information on the Earth's crustal structure (Saada et al., 2022; Sehsah and Eldosouky, 2022; Ekwok et al., 2021a; Eldosouky et al., 2021a; Saada et al., 2021a, 2021b; Le et al., 2020; Pham et al., 2019, 2022a, 2022b), basement framework (Ekwok et al., 2021b, Pham et al., 2020a) as well as sediment thickness (Ekwok et al., 2021a). The magnetic method is a remarkably powerful tool for mapping geologic structures (Eldosouky et al., 2022; Ekwok et al., 2022a, 2022b; Eldosouky and Saada, 2020; Pham et al., 2020b) including regional geologic boundaries (Ekwok et al., 2019). These characteristic features make magnetic data an essential component of mineral assessment programs (Eldosouky and Elkhateeb, 2018). Furthermore, magnetic data can be effectively applied in hydrocarbon exploration, unexploded ordnance detection, archaeological studies, etc. (Telford, 1990; Essa and Elhussein, 2018; Hang et al., 2019; Saada et al., 2022).
Generally, the procedures of magnetic data reductions, enhancements, display, and interpretation have advanced considerably over the years (Essa and Elhussein, 2018). Edge enhancement techniques are commonly used to highlight geologic structures caused by magnetic variations (Pham et al., 2018, 2021a, 2021b). A lot of these advanced methodologies are available in many works of literature (e.g., Melouah and Pham, 2021; Melouah et al., 2021a, 2021b; Eldosouky and Mohamed, 2021; Pham et al., 2021c, 2021d, 2021e). Edge detection filters like the analytic signal (Roest et al., 1992), horizontal gradient amplitude (Cordell et al., 1985), theta (Wijns et al., 2005), tilt angle filter (Miller and Singh, 1994), normalized horizontal derivative (Cooper and Cowan, 2006), tilt angle of the horizontal gradient amplitude (Ferreira et al., 2013), etc., have been used by various researchers in their separate studies. Pham et al. (2021a) reported the fairly hazy limitations associated with these methods. To address these limitations, and effectively map geologic structures including subtle lineaments, advanced processing methods like the improved normalized horizontal tilt angle (Li et al., 2014), improved theta method (Yuan et al., 2016), enhanced tilt angle (Nasuti et al., 2019), total directional theta method and enhanced horizontal derivative amplitude (Zareie and Moghadam, 2019), were developed. The findings of this investigation which is expected to improve our experience of the pattern and distribution of geologic structures, involved aeromagnetic data and improved edge detectors like the tilt angle of the horizontal gradient amplitude (THGA), enhanced horizontal gradient amplitude (EHGA) involving 3D models, and Tilt depth method (TDM). The efficacy of the EHGA filter was tested using synthetic data and the results compare very favourably with synthetic data. In general, defining geologic structures in combination with hydrothermally altered rocks is necessary for mineral explorations (Ekwok et al., 2022a).
Previous magnetic studies in this region involved filtering methods like first and second vertical derivatives, total horizontal and tilt angle derivatives, downward continuation, source edge detection, and centre for exploration targeting (CET) including textural analysis and circular feature transform plugins (Ekwok et al., 2022a, 2020a, 2019). Mineralization is often connected with structural control and hydrothermal alteration caused by igneous intrusions (Duong et al., 2021; Dill et al., 2010). Tectonic processes generated faults, fractures, fissures, and dike swarms in the Cretaceous strata of the Obudu Plateau (OP) and Lower Benue Trough (LBT) (Ekwok et al., 2021c). Tectonic events influence the localization, intensity, and characteristics of hydrothermal deposits, moreover the tendency and character of groundwater moves (Ekwok et al., 2020b). Outlining the geologic structures and hydrothermal altered rocks is critical for mineral exploration (Sehsah et al., 2019).
2 The study area
2.1 Location
The area includes portions of the Cretaceous Lower Benue Trough (CLBT) and the Precambrian Obudu Plateau (POP). It is located within the southeastern Nigerian states of Enugu, Ebonyi, and Cross River. The area lies between longitudes 7°30′E and 9°00′E and latitudes 6°00′N and 6°30′N. Fig. 1 shows the topography (elevation) of the study area.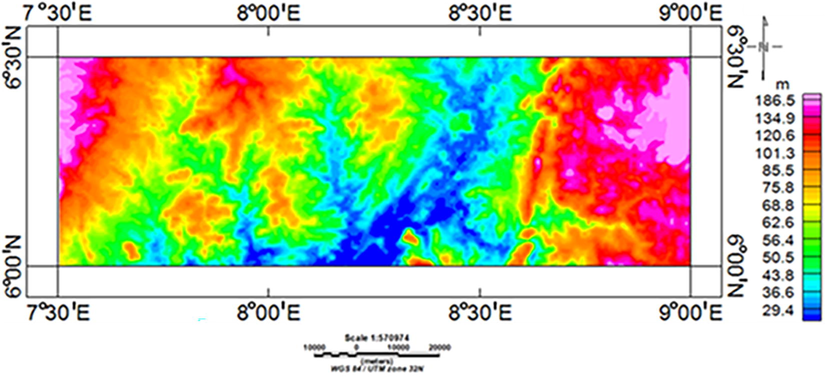
Elevation (Topography) map of the investigated area.
2.2 The geology
According to geologic age, the investigated region is placed in two of Nigeria's three geologic provinces, namely the POP and CLBT (Fig. 2).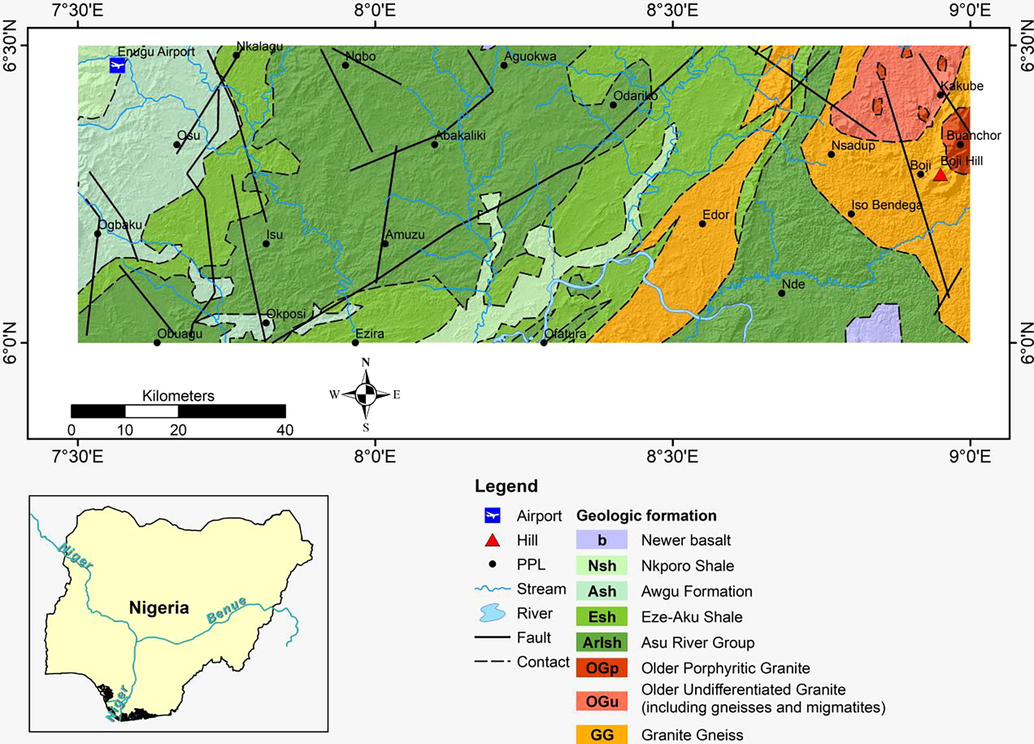
Geologic map of the study region (modified after Abraham et al., 2019).
2.2.1 Precambrian Obudu Plateau (POP)
The Nigerian Basement Complex (NBC) is assumed to have formed through time as a result of a sequence of tectono-thermal processes, with at least three phases of deformation described by Rahaman and Lancelot (1984). The lithologic groups in the basement complex include the migmatite gneiss complex, schist belts, and older granite sets. The Migmatite gneisses are regarded to be the earliest rocks in the NBC (Haruna, 2017). A substantial component of the complex is assumed to represent altered earlier crust, possibly from the Liberian period, that has been further affected by later orogenies such as the Eburnean (2000 ± 200 Ma) and Pan African (600 ± 150 Ma) orogenies, with the inclusion of the schist and granitoid belts (Haruna, 2017). Despite indications of sedimentation and distortion in Kibaran (1300–1100 Ma), no magmatic event of this period has been documented. The Kibaran was chaperoned by dates ranging from 900 to 450 Ma, indicating a Pan African event that generated gneisses, migmatite, earlier granite intrusions, and other lithologic features (Haruna, 2017; Haruna and Mamman, 2005).
The POP which is an extension of the Bamenda Massif is one of the Nigerian Basement outcrops in southeast Nigeria (Agbi and Ekwueme, 2018). High grade metamorphic rocks make up the lithological differences in the area (Agbi and Ekwueme, 2018; Ukwang et al., 2012).
2.2.2 Cretaceous Lower Benue Trough (CLBT)
The tectonic evolution of the continental basins to the south of Nigeria, as well as other basins in the West and Central African Rift systems, can be traced back to the poly fragmentation phase of the Gondwana supercontinent into current South American and African Plates (Late Jurassic to Early Cretaceous) (Bumby and Guiraud, 2005; Wilson and Guiraud, 1992). This disintegration occurred before other key events like the continents migrating apart and the opening of the South Atlantic (Cratchley et al., 1984; Burke et al., 1972).
The LBT is a segment of Nigeria's Benue Trough, a northeast southwest trending linear basin. The area is covered with a thick layer of Cretaceous sedimentary successions that were deposited in rapidly shifting settings. Sedimentation began in the basin after a sequence of transgressive–regressive stages (Kogbe, 1981). The Ebonyi and Abakaliki formations make up the oldest and most basic Asu River Group (ARG). Shale, limestone, clay, and siltstone, sandstone come in various thicknesses (Cenomanian in age) (Kogbe, 1981). Eze-Aku (Turonian) Formation (EAF), which overlies the ARG, is overlooked by limestone, sandstone, and shales. The Nkporo/Enugu (dark blue) Formation is part of a pro-deltaic habitat that becomes increasingly restricted higher in the Mamu Formation. Basal coal seams are covered by interchanging strata of sandstone and fine grained shales as some Nsukka Formation coal seams (Doucet and Popoff, 1985).
3 Methods
3.1 Enhanced horizontal gradient amplitude
In this investigation, a cutting edge filter based on the derivatives of the horizontal gradient of magnetic data, was proposed by Pham et al. (2020c), to define the lateral boundaries of geologic lineaments. The EHGA operator can be given as:
where,
is real part, p is a constant greater or equal to 2 (Pham et al., 2020c),
,
, and
are the derivatives in ×, y, and z directions of the total horizontal gradient (THG) (Cordell, 1979) that is approximated by:
where
and
are the field derivative in ×, y, and z directions, respectively, and k is a positive real number that is chose by the interpreter. In this study, k = 3 was employed to generate a simulated magnetic model to evaluate the sharpness of the EHGA filter. The model (Fig. 3a), which is characterised by 3D view, consist of three prismatic bodies, whose parameters are given in Table 1.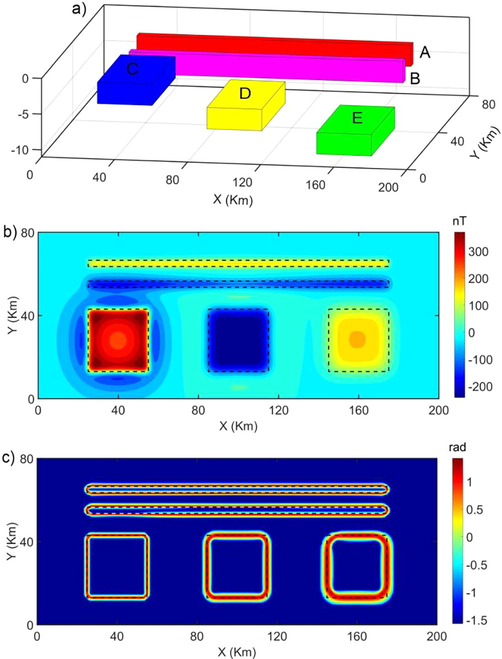
(a) 3D view of the model, (b) its magnetic anomaly, and (c) EHGA of magnetic data in Fig. 3b. The dashed lines show the true boundaries of the prismatic sources.
Parameters/Model label
A
B
C
D
E
x-coordinates of centre (km)
100
100
40
100
160
y-coordinates of centre (km)
65
55
28
28
28
Width (km)
3
3
30
30
30
Length (km)
150
150
30
30
30
Depth of top (km)
2
3
2
5
8
Depth of bottom (km)
5
6
5
8
11
Declination (°)
0
0
0
0
0
Inclination (°)
90
90
90
90
90
Magnetization (A/m)
1
−1.2
2.5
−2.5
2.5
The magnetic anomaly of the model is shown in Fig. 3b. Fig. 3c shows the EHGA of magnetic data. It was witnessed that the EHGA technique can generate well defined edges for magnetic sources A, B, and C. The peaks of the EHGA are located directly over the source borders, and this filter generates more reliable responses.
3.2 Tilt depth method
A frequently employed enhancement technique for the potential field (PF) data F is the tilt angle (T) (Miller and Singh 1994), which equates the amplitude of the vertical derivative of the field utilizing its horizontal derivatives.
Salem et al. (2007) elucidated that when the mathematical formulations for the vertical and horizontal gradients of the magnetic field over a vertical contact were entered into equation (3), they are simplified to:
where and are the vertical and horizontal distances from the prevailing approximation point to the centre of the top of the boundary. Eq. (4) indicates that half the horizontal distance between the ± 45° contours of the tilt angle T is the depth to source.
4 Results
The airborne magnetic data were gathered by Fugro Airborne Surveys, Canada under the control of Nigerian Geological Survey Agency (NGSA) (2005: 2010 in three phases (Adetona and Abu, 2013). The total aeromagnetic intensity (TAMI) map of the investigated region (Fig. 4) shows magnetic variations from − 905.790 nT to 210.626 nT. The Central (E-W) part is characterized by low intensity, while the southern, northeastern, and northern parts are of high intensity (Fig. 4).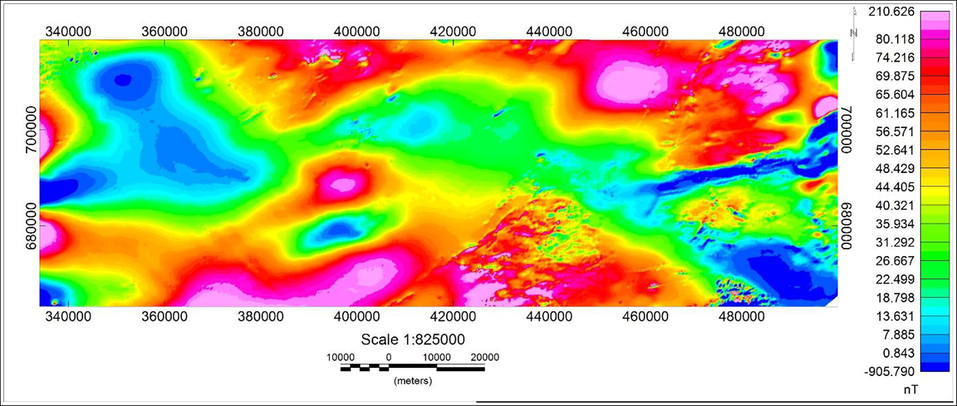
The total aeromagnetic intensity data of the studied area.
The EHGA filter is applied to the TAMI data (aeromagnetic) of the study area (Fig. 5). The EHGA clearly outlines and refines the lineaments of the studies region.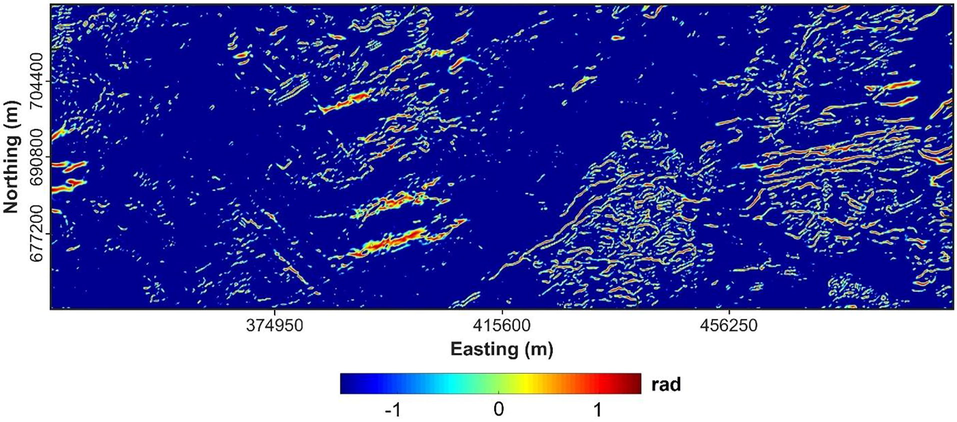
The EHGA map of the studied region.
Fig. 5 shows that the eastern part is highly deformed than the western one. The NE, ENE, and EW directions are dominant to the east of the area while the ENE and NW are dominant to the west.
The depth estimation technique involving TDM (Fig. 6) was employed to quantitatively define the consistencies of sediments in the study area. This method, like source parameter imaging, is an enhanced technique for delineating the lateral positions and depths of magnetic sources (Ekwok et al., 2021a). This procedure is suitable for mapping single and multiple magnetic bodies with various shapes like isolated poles, dyke (prism), dipole, lines of poles, vertical contact, and susceptibility difference (Telford et al., 1990).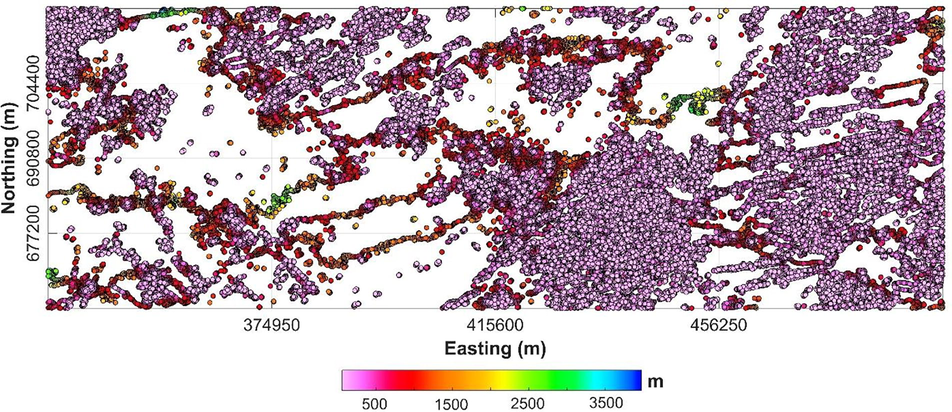
Tilt depth method map of the studied region.
Fig. 6 shows TDM characterized by wide ranging colours of blue-pink indicating various depth values. The depth ranges from ∼ 1500 to ∼ 2500 m as indicated by lemon green to blue reflects deep magnetic bodies while ∼ 500 to ∼ 1000 m (pink-yellow) shows the depth to shallow magnetic bodies. The maximum depth solution acquired employing TDM is ∼ 2500 m and lies within the depth range documented in the region by former workers (Ekwok et al., 2022a, 2021a; Ofoegbu and Onuoha, 1991; Agagu and Adighije, 1983). Generally, the relatively thin sedimentation observed in the examined region is due to the post depositional intrusions related to Abakaliki (Santonian) Anticlinorium (Ekwok et al., 2022a, 2022b,2020a; Benkhelil, 1987) and exposed basements (Agbi and Ekwueme, 2018; Ukwang et al., 2012) in the eastern and western flanks, respectively.
5 Discussion
The EHGA detector of the structures proposed by Pham et al. (2020c) was employed to simulate the magnetic model with the object of examining the sharpness of the EHGA filter. Prismatic bodies with characteristic parameters (Table 1) estimated the magnetic anomaly linked to the model (Fig. 3). The projected magnetic anomaly related to the model is shown in Fig. 3b. The improved EHGA which sets peaks over source borders created well defined and clear edges for sources A, B, and C (Fig. 3a). This detector has been reported to be a cutting edge detector with better resolution than previous filters (2020c, 2021a).
To image the linear structures (Fig. 7), the EHGA lineaments were statistically analysed using a rose diagram (Fig. 8). Figs. 5 and 8 which indicate the structural features such as faults and fractures etc., revealed high lineament density in the Precambrian basement area (eastern flank) triggered by the younger granitic intrusions of Mesozoic calc-alkaline ring complexes (Woakes et al., 1987). Also, the intermediate to low lineament density delineated in the western and central flanks of the investigated area are caused by the Abakaliki (Santonian) Anticlinorium related to igneous intrusions (Benkhelil, 1987). These geologic structures, found in the underlying basement complex rocks and the overlying sedimentary layer, have major NW, ENE, and NE structural orientations, as well as minor NS directions. These faults, fractures, etc., serve as conduits for super enriched hydrothermal fluids movement and deposition (Ekwok et al., 2022a, Mineral Resources of the Western US, 2017; USGS, 2013; Dill et al., 2010). Similarly, geologic structures reveal porous and permeable zones which somewhat denote the groundwater potential of an area (Ekwok et al., 2020b; Murasingh and Jha, 2013).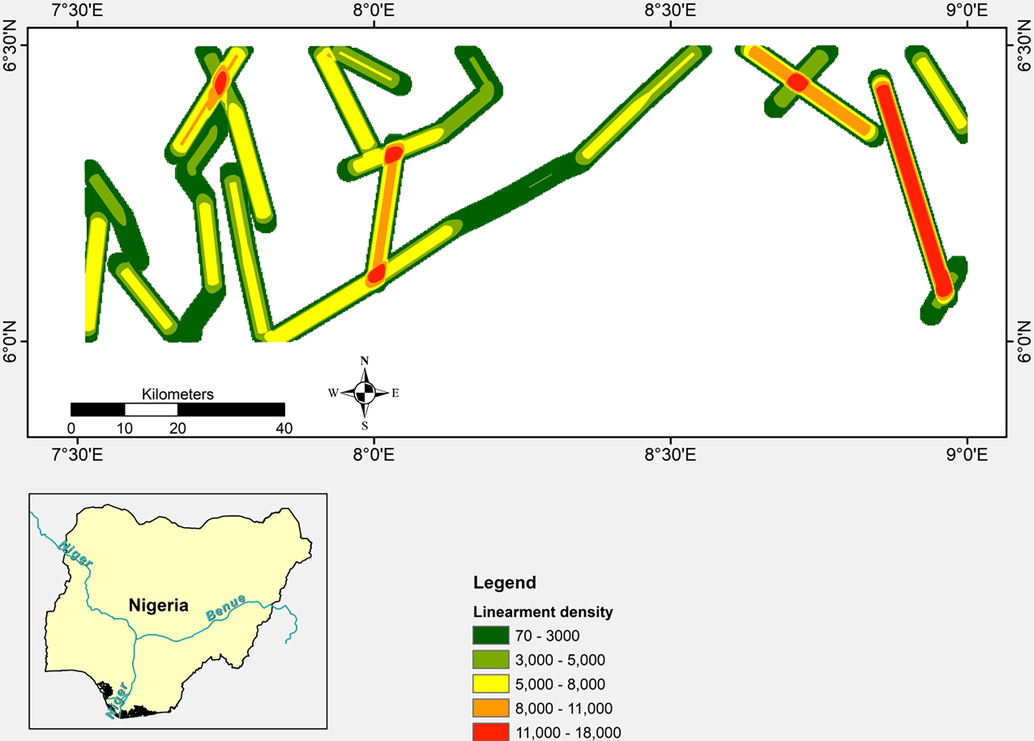
Lineament density map of the study area.
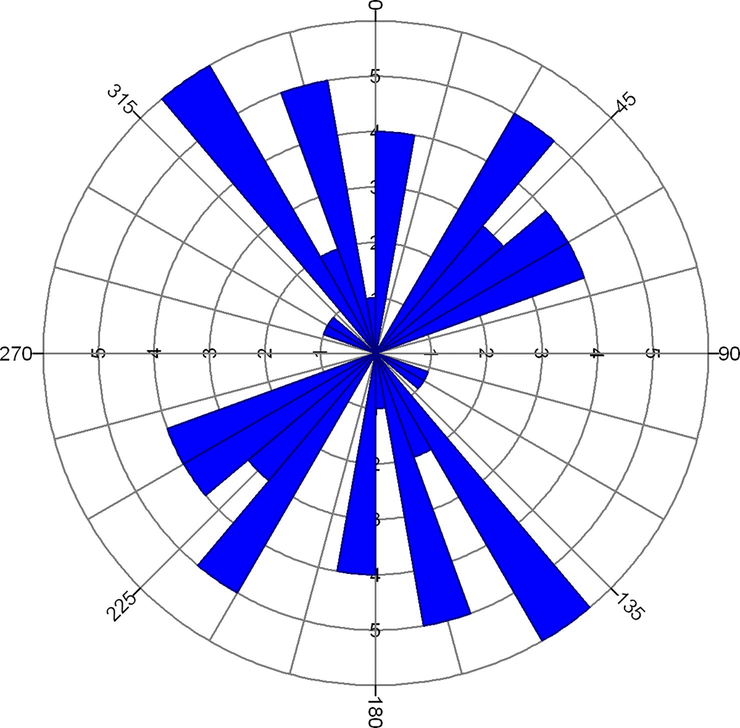
Satellite lineament rose diagram of the studied region.
The TDM (Salem et al., 2007) is an enhanced depth determination method that generated a maximum depth value of about 2500 m. Studies involving magnetic datasets, Euler Deconvolution (ED), and Source Parameter Imaging (SPI) depth estimation methods generated depth of ∼ 2440.0 and ∼ 2570.2 m respectively (Ekwok et al., 2022a, 2022b). Also, gravity investigation from ED and SPI revealed a maximum depth of ∼ 2496.8 m and 2461.1 m (Ekwok et al., 2022a) respectively. However, 2D GM-SYS results showed a depth value of ∼ 2922.0 m (Ekwok et al., 2022a). In our investigation, the estimated depth result from TDM verified the efficacy of depth values obtained by previous researchers. Furthermore, the thin sedimentary pile witnessed in the region is caused by the widespread occurrence of post depositional Santonian intrusions in this region of the LBT (Ekwok et al., 2019, 2020a; Akpan et al., 2014), and extensive outcrops of the basement in the OP (Agbi and Ekwueme, 2018; Ukwang et al., 2012).
Magnetic data involving enhanced filters that can be employed to outline geologic structures have been carried out by recent scholars (Pham et al., 2020c, 2021c; Pham, 2020). Delineation of fractures, faults, fissures, etc., using improved edge detector filters is for the polymetallic magmatic hydrothermal deposits explorations. Such study in the CLBT and the adjoining area is for hydrothermal modifications caused by tectonic events and their related base metal, massive sulphide, shear hosted gold, and some other deposits (Ekwok et al., 2022a, 2022b; Mineral Resources of the Western US, 2017; USGS, 2013; Dill et al., 2013; Dill et al., 2010).
The EHGA map (Fig. 5) indicated high lineament density in the POP that is caused by tectono-thermal activity that initiated the intrusions of Younger Mesozoic Granite of calc-alkaline Ring Complexes in the basement (Woakes et al., 1987). Likewise, the central and western regions are dominated by intermediate-low lineament density produced by Abakaliki (Santonian) Anticlinorium related igneous intrusions (Benkhelil, 1987). Figs. 5 and 8 show major NW and NE structural orientations, in addition to minor NS trends. The NE orientation of the structures coincides with the direction of the Nigerian BT (Benkhelil, 1987; Cratchley et al., 1984; Burke et al., 1972). Some major geologic structures are thought to have extended into the upper mantle (Ekwok et al., 2022a; Haruna, 2017). Several reports show that geologic structures serve as the pathway for migration and deposition of minerals (Elkhateeb et al., 2021; Mineral Resources of the Western US, 2017; Elkhateeb and Eldosouky, 2016; USGS, 2013; Murasingh and Jha, 2013; Dill et al., 2010). The Igneous related base metals (Akande and Muecke, 1993; Olade and Morton, 1985; Nwachukwu, 1972) and brine fields (Ekwok et al., 2022b; Tijani, 2004; Uma, 1998) in the CLBT, as well as the metallogenic minerals in the POP (Ekwok et al., 2022a; Haruna, 2017), are believed to be deposited in these structures.
6 Conclusion
Structural studies and depth estimation in some parts of the OP and LBT were carried out involving recent airborne magnetic data, enhanced lineament detector, and depth estimator. Improved filtering filters (EHGA involving 3D models and Tilt depth solutions) were applied in this research. The EHGA detector brings peaks over source boundaries and produces sharp and well-defined boundaries for magnetic sources. The TDM which is an advanced depth estimation method revealed thin and thick sedimentations that vary from ∼ 500 to ∼ 1000 m and ∼ 1500 to ∼ 2500 m, respectively. This maximum depth value correlates strongly with recent studies involving other enhanced depth determination methods and high-resolution potential field data. The geologic structures that serve as channels for super enriched hydrothermal fluids movement and deposition were mapped and observed to have major NW, ENE, and NE structural orientations with minor NS directions. These structures that are abundant at the Basement-Precambrian area are regarded to be generated by the Younger Mesozoic Granitic intrusions of calc-alkaline Ring-Complexes, and the Abakaliki Santonian) Anticlinorium.
Acknowledgements
This research was supported by Researchers Supporting Project number (RSP-2021/249), King Saud University, Riyadh, Saudi Arabia.
Declaration of Competing Interest
The authors declare that they have no known competing financial interests or personal relationships that could have appeared to influence the work reported in this paper.
References
- Geothermal energy reconnaissance of southeastern Nigeria from analysis of aeromagnetic and gravity data. Pure Appl. Geophys.. 2019;176:1615-1638.
- [Google Scholar]
- Estimating the thickness of sedimentation within Lower Benue Basin and Upper Anambra Basin, Nigeria, using both spectral depth determination and source parameter imaging. ISRN Geophys.. 2013;10:1-11.
- [Google Scholar]
- Tectonic and sedimentation framework of the Lower Benue Trough, southeastern Nigeria. J. Afr. Earth Sc.. 1983;1(3/4):267-274.
- [Google Scholar]
- Preliminary review of the geology of the hornblende biotite gneisses of Obudu Plateau Southeastern Nigeria. Global J. Geol. Sci.. 2018;17:75-83.
- [Google Scholar]
- Co-existing copper sulphides and sulphosalts in the Abakaliki Pb–Zn deposits, Lower Benue-Trough (Nigeria) and their genetic significance. Miner. Pet.. 1993;47:183-192.
- [Google Scholar]
- Geophysical and Geological Studies of the Spread and Industrial Quality of Okurike Barite Deposit. Am. J. Environ. Sci.. 2014;10(6):566-574.
- [Google Scholar]
- Cretaceous deformation, magmatism and metamorphism in the lower Benue Trough. Nigeria. Geo. Journal. 1987;22:467-493.
- [Google Scholar]
- The Geodynamic Setting of the Phanerozoic Basins of Africa. J. Afr. Earth Sc.. 2005;43:1-12.
- [Google Scholar]
- Geological History of the Benue Valley and Adjacent Areas. African Geology, University of Ibadan Press; 1972. p. :187-206.
- Enhancing potential field data using filters based on the local phase. Comput. Geosci.. 2006;32(10):1585-1591.
- [Google Scholar]
- Mapping basement magnetization zones from aeromagnetic data in the San Juan Basin, New Mexico. In: Hinze W.J., ed. The Utility of Regional Gravity and Magnetic Maps (1st ed.). Tulsa: Society of Exploration Geophysicists; 1985. p. :181-197.
- [Google Scholar]
- Geophysical and Geochemical Evidence for the Benue Chad Basin Cretaceous Rift Valley System and its Tectonic Implications. J. Afr. Earth Sci.. 1984;2(2):141-150.
- [Google Scholar]
- The origin of pre- and synrift, hypogene Fe-P mineralization during the Cenozoic along the Dead Sea Transform Fault, Northwest Jordan. Econ. Geol.. 2010;105:1301-1319.
- [Google Scholar]
- Relationship between seismicity and active faults in Thanh Hoa province detected by local seismic network. Vietnam J. Earth Sci.. 2021;43(2):199-219.
- [Google Scholar]
- Enhancement and modelling of aeromagnetic data of some inland basins, southeastern Nigeria. J. Afr. Earth Sci.. 2019;155:43-53.
- [Google Scholar]
- Exploratory mapping of structures controlling mineralization in Southeast Nigeria using high resolution airborne magnetic data. J. Afr. Earth Sci.. 2020;162:1-11.
- [Google Scholar]
- Assessment of groundwater potential using geophysical data: a case study in parts of Cross River State, south-eastern Nigeria. Appl. Water Sci.. 2020;10(6):1-17.
- [Google Scholar]
- Structural and lithological interpretation of aero-geophysical data in parts of the Lower Benue Trough and Obudu Plateau, Southeast Nigeria. Adv. Space Res.. 2021;68:2841-2854.
- [Google Scholar]
- Assessment of crustal structures by gravity and magnetic methods in the Calabar Flank and adjoining areas of Southeastern Nigeria-a case study. Arab. J. Geosci.. 2021;14(4):1-10.
- [Google Scholar]
- Assessment of depth to magnetic sources using high resolution aeromagnetic data of some parts of the Lower Benue Trough and adjoining areas, Southeast Nigeria. Adv. Space Res.. 2021;67(7):2104-2119.
- [Google Scholar]
- Implications of tectonic anomalies from potential field data in some parts of Southeast Nigeria. Environ. Earth Sci.. 2022;81(6):1-15.
- [Google Scholar]
- S.E. Ekwok A.E. Akpan O.-I.-M. Achadu C.E. Thompson A.M. Eldosouky K. Abdelrahman P. Andráš Towards Understanding the Source of Brine Mineralization in Southeast 2022 Evidence from High-Resolution Airborne Magnetic Nigeria and Gravity Data. Minerals, 12(146), 1-18. Https://doi.org/10.3390/min12020146.
- Texture analysis of aeromagnetic data for enhancing geologic features using co-occurrence matrices in Elallaqi area, South Eastern Desert of Egypt. NRIAG J. Astron. Geophys.. 2018;7:155-161.
- [Google Scholar]
- Edge detection of aeromagnetic data as effective tools for structural imaging at Shilman area, South Eastern Desert, Egypt. Arab. J. Geosci.. 2021;14:13.
- [CrossRef] [Google Scholar]
- Source edge detection (SED) of aeromagnetic data: synthetic examples and a case study from Haimur area, south Eastern Desert, Egypt. Arab. J. Geosci.. 2020;13:626.
- [CrossRef] [Google Scholar]
- Integration of ASTER satellite imagery and 3D inversion of aeromagnetic data for deep mineral exploration. Adv. Space Res.. 2021;68:(9).
- [CrossRef] [Google Scholar]
- Structural analysis and basement topography of Gabal Shilman area, South Eastern Desert of Egypt, using aeromagnetic data. J. King Saud Univ. –Sci.. 2022;34(2)
- [CrossRef] [Google Scholar]
- Eldosouky A.M., Pham L.T., El-Qassas R.A.Y., Hamimi Z., Oksum E. (2021a). Lithospheric Structure of the Arabian–Nubian Shield Using Satellite Potential Field Data. In: Hamimi Z., Fowler AR., Liégeois JP., Collins A., Abdelsalam M.G., Abd EI-Wahed M. (eds) The Geology of the Arabian-Nubian Shield. Regional Geology Reviews. Springer, Cham. https://doi.org/10.1007/978-3-030-72995-0_6.
- Detection of porphyry intrusions using analytic signal (AS), Euler Deconvolution, and Center for Exploration Targeting (CET) Technique Porphyry Analysis at Wadi Allaqi Area, South Eastern Desert, Egypt. Int. J. Sci. Eng. Res.. 2016;7(6):471-477.
- [Google Scholar]
- Probability of mineral occurrence in the Southeast of Aswan area, Egypt, from the analysis of aeromagnetic data. Arab. J. Geosci.. 2021;14:1514.
- [CrossRef] [Google Scholar]
- PSO (particle swarm optimization) for interpretation of magnetic anomalies caused by simple geometrical structures. Pure Appl. Geophys.. 2018;175:3539-3553.
- [Google Scholar]
- Enhancement of the total horizontal gradient of magnetic anomalies using the tilt angle. Geophysics. 2013;78(3):133-141.
- [Google Scholar]
- An improved space domain algorithm for determining the 3-D structure of the magnetic basement. Vietnam J. Earth Sci.. 2019;41(1):69-80.
- [Google Scholar]
- Review of the Basement Geology and Mineral Belts of Nigeria. J. Appl. Geol. Geophys.. 2017;5(1):37-45.
- [Google Scholar]
- A Brief Review of Some Metallogenetic Features of Uranium Mineralisation in the Upper Benue Trough, N.E, Nigeria. Technol. Dev. J.. 2005;9:1-8.
- [Google Scholar]
- Major transgressive episodes in the Benue Valley of Nigeria. Earth Evol. Sci.. 1981;6(2):144-148.
- [Google Scholar]
- Estimating Effectiveness of Some Methods for Detecting Edge of Potential Field Sources. VNU J. Sci.. 2020;36(4):99-115.
- [Google Scholar]
- Optimised edge detection filters in the interpretation of potential field data. Explor. Geophys.. 2014;45(3):171-176.
- [Google Scholar]
- Deep crustal architecture of the eastern limit of the West African Craton: Ougarta Range and Western Algerian Sahara. J. Afr. Earth Sci.. 2021;183:104321
- [CrossRef] [Google Scholar]
- Melouah, O., Eldosouky, A.M., and Ebong, W.D., (2021b). Crustal architecture, heat transfer modes and geothermal energy potentials of the Algerian Triassic provinces, Geothermics, Volume 96, 102211, ISSN 0375-6505, https://doi.org/10.1016/j.geothermics.2021.102211.
- An improved ILTHG method for edge enhancement of geological structures: application to gravity data from the Oued Righ valley. J. Afr. Earth Sc.. 2021;177:104162
- [CrossRef] [Google Scholar]
- Potential field tilt a new concept for location of potential field sources. J. Appl. Geophys.. 1994;32(2–3):213-217.
- [Google Scholar]
- Mineral resources of the western US, (2017). The teacher-friendly guide to the Earth scientist of the Western US. http://geology.Teacherfriendlyguide.Org/index.php/mineral-w.
- Murasingh, S., Jha, R. (2013). Identification of groundwater potential zones using remote sensing and GIS in a mine area of Odisha. Conference paper, Doi: 10.13140/RG.2.1.3374.6644.
- STDR: a novel approach for enhancing and edge detection of potential field data. Pure Appl. Geophys.. 2019;176(2):827-841.
- [Google Scholar]
- The tectonic evolution of the southern portion of the Benue Trough, Nigeria. Geol. Mag.. 1972;109:411-419.
- [Google Scholar]
- Analysis of magnetic data over the Abakaliki Anticlinorium of the Lower Benue Trough, Nigeria. Mar. Pet. Geol.. 1991;8:174-183.
- [Google Scholar]
- Origin of lead–zinc mineralization in the southern Benue- Trough, Nigeria: Fluid inclusion and trace element studies. Mineral. Dep.. 1985;20:76-80.
- [Google Scholar]
- A comparative study on different filters for enhancing potential field source boundaries: synthetic examples and a case study from the Song Hong Trough (Vietnam) Arab J Geosci.. 2020;13(15):723.
- [Google Scholar]
- Determination of maximum tilt angle from analytic signal amplitude of magnetic data by the curvature-based method. Vietnam J. Earth Sci.. 2018;40(4):354-366.
- [Google Scholar]
- Estimation of curie point depths in the southern Vietnam continental shelf using magnetic data. Vietnam J. Earth Sci.. 2019;41(3):216-228.
- [Google Scholar]
- MagB_inv: a high performance Matlab program for estimating the magnetic basement relief by inverting magnetic anomalies. Comput. Geosci.. 2020;134:104347
- [Google Scholar]
- Enhancement of potential field source boundaries using an improved logistic filter. Pure Appl. Geophys.. 2020;177(11):5237-5249.
- [Google Scholar]
- A new high resolution filter for source edge detection of potential field data. Geocarto International 2020
- [CrossRef] [Google Scholar]
- Delineation of structural lineaments of the Southwest Sub-basin (East Vietnam Sea) using global marine gravity model from CryoSat-2 and Jason-1 satellites. Geocarto International 2021
- [CrossRef] [Google Scholar]
- Edge detection of potential field sources using the softsign function. Geocarto Int.. 2021;1–14
- [CrossRef] [Google Scholar]
- Application of the improved parabola-based method in delineating lineaments of subsurface structures: A case study. J. King Saud Univ. Sci.. 2021;33(7):101585
- [Google Scholar]
- Performance evaluation of amplitude- and phase-based methods for estimating edges of potential field sources. Iran J Sci Technol Trans Sci.. 2021;45(4):1327-1339.
- [Google Scholar]
- A comparative study on the peak detection methods used to interpret potential field data: A case study from Vietnam. Geocarto Int 2021
- [CrossRef] [Google Scholar]
- Determination of structural lineaments of Northeastern Laos using the LTHG and EHGA methods. Journal of King Saud University - Science. 2022;34(3):101825
- [Google Scholar]
- Determining the Moho interface using a modified algorithm based on the combination of the spatial and frequency domain techniques: a case study from the Arabian Shield. Geocarto International 2022
- [CrossRef] [Google Scholar]
- Continental crust evolution in SW Nigeria: constraints from U/Pb dating of pre-Pan-African gneisses. In: In Rapport d’activite 1980–1984 Documents et Travaux du Centre Geologique et Geophysique de Montpellier. 1984. p. :41-50.
- [Google Scholar]
- Magnetic interpretation using the 3-D analytic signal. Geophysics. 1992;57(1):116-125.
- [Google Scholar]
- Insights on the tectonic styles of the Red Sea rift using gravity and magnetic data, Marine and Petroleum Geology. ISSN. 2021;105253:0264-8172.
- [CrossRef] [Google Scholar]
- New insights into the contribution of gravity data for mapping the lithospheric architecture. J. King Saud Univ. – Sci.. 2021;101400
- [CrossRef] [Google Scholar]
- Saada, S.A., Eldosouky, A.M., Kamel, M., El Khadragy, A., Abdelrahman, K., Fnais, M.S., Mickus, K. (2022). Understanding the structural framework controlling the sedimentary basins from the integration of gravity and magnetic data: A case study from the east of the Qattara Depression area, Egypt, Journal of King Saud University - Science, Volume 34, Issue 2, 101808, ISSN 1018-3647, https://doi.org/10.1016/j.jksus.2021.101808.
- Tilt-depth method: a simple depth estimation method using first-order magnetic derivatives. Lead. Edge. 2007;26:1502-1505.
- [Google Scholar]
- Neoproterozoic hybrid forearc – MOR ophiolite belts in the northern Arabian-Nubian Shield: no evidence for back-arc tectonic setting. Int. Geol. Rev.. 2022;64(2):151-163.
- [CrossRef] [Google Scholar]
- Unpaired ophiolite belts in the Neoproterozoic Allaqi-Heiani Suture, the Arabian-Nubian Shield: Evidences from magnetic data. J. Afr. Earth Sc.. 2019;156:26-34.
- [CrossRef] [Google Scholar]
- Applied geophysics (2nd ed.). Cambridge: Cambridge University Press; 1990.
- Evolution of saline waters and brines in the Benue-Trough, Nigeria. Appl. Geochem.. 2004;19:1355-1365.
- [Google Scholar]
- Single zircon evaporation ages: Evidence for the Mesoproterozoic crust in S.E. Nigerian basement complex. Chin. J. Geochem.. 2012;31:48-54.
- [Google Scholar]
- The brine fields of the Benue Trough, Nigeria: A comparative study of geomorphic, tectonic and hydrochemical properties. J. Afr. Earth Sci.. 1998;26:261-275.
- [Google Scholar]
- United States Geological Survey (USGS), (2013). Setting and origin of iron oxide- copper-cobalt-gold-rare earth element deposits of southeast Missouri: http://minerals.usgs.gov/east/semissouri/index.html.
- Wilson, M., Guiraud, R., (1992). Magmatism and rifting in Western and Central Africa, from Late Jurassic to Recent times. In: P.A. Ziegler (Editor), Geodynamics of Rifting, Volume II. Case History Studies on Rifts: North and South America and Africa. Tectonophysics, 213, 203-225.
- Some metallogenetic features of the Nigerian Basement. J. Afr. Earth Sci.. 1987;6(5):655-664.
- [Google Scholar]
- Advantages of horizontal directional Theta method to detect the edges of full tensor gravity gradient data. J. Appl. Geophys.. 2016;130:53-61.
- [Google Scholar]
- The application of theta method to potential field gradient tensor data for edge detection of complex geological structures. Pure Appl. Geophys.. 2019;176(11):4983-5001.
- [Google Scholar]
Appendix A
Supplementary data
Supplementary data to this article can be found online at https://doi.org/10.1016/j.jksus.2022.102288.
Appendix A
Supplementary data
The following are the Supplementary data to this article:


