

Translate this page into:
Application of machine learning in the assessment of landslide susceptibility: A case study of mountainous eastern Mediterranean region, Syria
⁎Corresponding author. hazemabdo@tartous-univ.edu.sy (Hazem Ghassan Abdo),
-
Received: ,
Accepted: ,
This article was originally published by Elsevier and was migrated to Scientific Scholar after the change of Publisher.
Abstract
Landslide is a considerable geomorphological risk in terrain systems worldwide. Advanced techniques present a unique tool for predicting landslide susceptibility with unbiased and precise outputs. However, the application of this tool to analyze landslide susceptibility in the eastern Mediterranean landscape is still not sufficiently understood. This study aimed to assess the implementation of three machine learning (ML) algorithms, i.e., support vector machine (SVM), random forest (RF) and extreme gradient boost (XGBoost), in landslide susceptibility mapping in the mountainous area of western Syria. In this regard, 200 landslide events were inventoried from historical data, aerial images and conducted fieldworks. Sixteen triggering factors were selected according to the literature and geographical features (Monsoon period). The receiver operating characteristic (ROC) outcomes revealed that the RF achieved better performance with an area under curve (AUC) of 0.96, pursued by XGBoost and SVM with AUC of 0.94 and 0.90, respectively. This assessment presents an essential understanding of the effective implementation of ML in landslide assessment in the mountainous region of the eastern Mediterranean. We emphasized, hence, that the RF algorithm has the most robust performance of landslide susceptibility prediction in the western Syria. Moreover, the outputs of this study will provide local decision-makers with insights to produce regional management strategies for the landslide, especially after the Syrian war phase.
Keywords
SVM
RF
XGBoost
Landslide
Eastern Mediterranean
Syria

- ACC
-
accuracy
- AUC
-
area under curve
- DEM
-
digital elevation model
- ESA
-
European Space Agency
- GIS
-
geographic information systems
- LULC
-
Landuse/Landcover
- MCC
-
Matthew’s correlation coefficient
- ML
-
machine learning
- NDVI
-
Normalized Difference Vegetation Index
- RF
-
random forest
- ROC
-
receiver operating characteristic
- SPI
-
Stream power index
- SVM
-
support vector machine
- TOL
-
Tolerance
- TWI
-
Topographic Wetness Index
- VIF
-
Variance inflation
- XGBoost
-
Extreme gradient boost
Abbreviations
1 Introduction
Landslide is a common global geomorphological threat, which severely damages property and infrastructure (Zhou et al., 2021; Bravo-López et al., 2023; Liu et al., 2024; Wang et al., 2023). Furthermore, landslides negatively affect the quality of life and economic sustainability (Liu et al., 2021; Ghayur Sadigh et al., 2023; Yi et al., 2022; Zangmene et al., 2023). A landslide occurs due to several physical and human causative factors (Pham et al., 2022).
Access to precise knowledge of landslide occurrence is critical for controlling the risk of this unexpected threat. Spatial zonation of landslide susceptibility is an essential procedure that presents the constructive base for managing affected areas (Wang et al., 2022; Zhang et al., 2022a,b; Deng et al., 2022). Presently, the combination of machine learning (ML) and geographic information systems (GIS) has been considered to improve the accuracy of landslide susceptibility prediction (Nirbhav et al., 2023; Saha et al., 2023; Zhang et al., 2023; Chen and Yang, 2023; Naceur et al., 2022; Zhao et al., 2023).
The terrain structure in the eastern Mediterranean region is characterized by steep slopes, fragile lithology, high rainfall intensities and intense human activities. Thus, the patterns of slope instability, especially landslide events, are the salient feature in that region (Akinci, 2022; Ado et al., 2022). Moreover, landslides are responsible for the development of slopes of the eastern Mediterranean (Farooq et al., 2015). In Syria, the terrain system is subject to the acceleration of the movement of slope masses due to the increase in various human activities, in addition to several physical factors (Mohammed et al., 2023). For example, landslide events caused severe damage to the infrastructure in the mountainous region of western Syria during the winters of 2020–––2023 (Hammad et al., 2020; Abdo, 2022; Abdo et al., 2022).
A literature review shows that few studies have tested the performance of ML algorithms in landslide assessment in the Eastern Mediterranean. Moreover, the studies conducted in Syria focused on comparing traditional statistical methods. Hence, there is an urgent need to improve landslide susceptibility mapping by investigating the performance of ML algorithms integrated with spatial technology in the Eastern Mediterranean. Importantly, the Eastern Mediterranean region is characterized by a complex spatial interaction between the triggering factors of landslides. Hence, exploring the influence degree of these factors and identifying the most influential factor is of utmost importance in managing the landslide hazard in the mountainous eastern Mediterranean region. To fill the gap, the ultimate goal of the current assessment is to use three ML algorithms, i.e. SVM, RF and XGBoost, in producing landslide susceptibility maps in the mountainous region of western Syria. The present investigation is the first test of some popular ML algorithms in landslide vulnerability evaluation in the Syrian context. The outcomes of the current assessment will provide important values for decision-makers in taking management and mitigation strategies in western Syria.
2 Overview of the study area
2.1 Site of the study area
Al-Marqab river basin is located in the mountainous region in western Syria. The study area extends between 35°7′32′' N and 34°58′39′' N latitudes and between longitudes 36°16′30′' E and 35°58′00′' E with an approximate area of 190 km2 (Fig. 1). Geographically, the investigated basin is bounded from the north by the river basins of Basiya and Jobar, from the south by the Hussain River basin, from the east by the Orontes River basin and the west by the Mediterranean.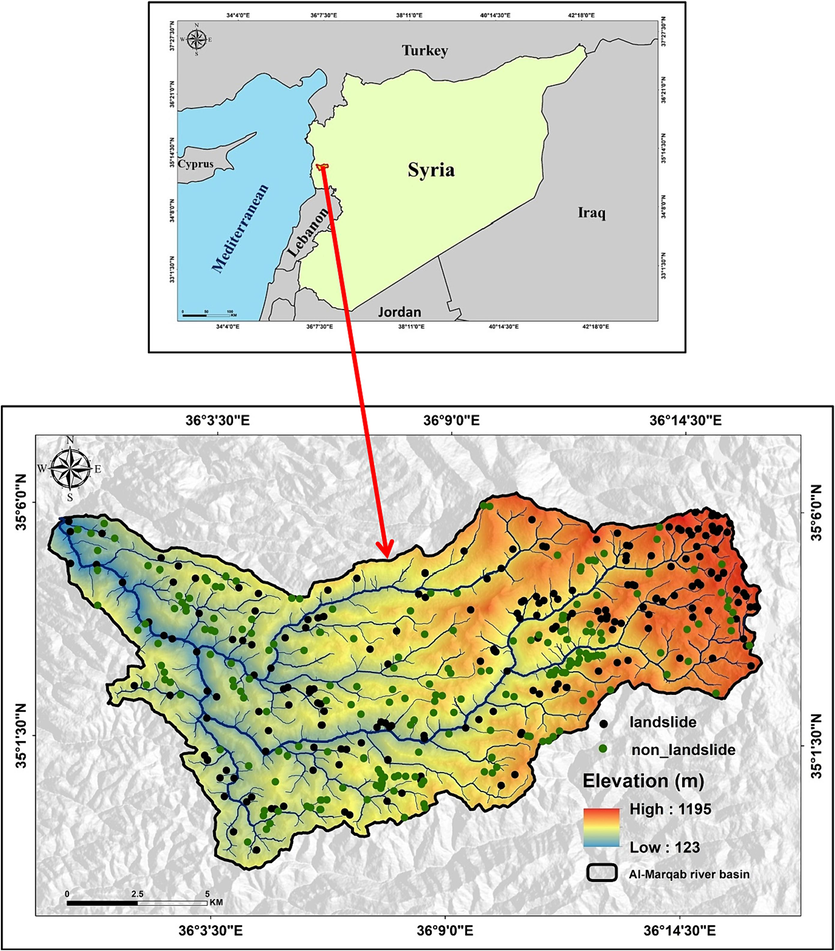
Location of the study area.
2.2 General geology
The geological formations differ from the Jurassic to the Quaternary. Jurassic and Cretaceous structures are composed of marl, limestone, dolomite and sandy limestone. Neogene formations are composed of basalt and sedimentary rocks.
2.3 Climate
Climatically, the basin belongs to the Mediterranean climate according to the Köppen classification (Mohammed et al., 2020), which is characterized by mild rainy winters and hot, dry summers. The average annual rainfall ranges between 900 and 1450 mm. The average annual temperature in August is 20.5 °C, and in January is 10.1 °C. The population of the study area depends economically on agriculture, with other human activities, including tourism and services (Younes et al., 2023; Alsafadi et al., 2022).
3 Materials and methods
3.1 Data
Present investigation assesses landslide susceptibility in Marqab river basin using SVM, RF and XGBoost algorithms depending on the multi-sources dataset (Table 1). A digital elevation model (DEM) obtained from NASA (https://vertex.daac.asf.alaska.edu/, accessed on 18 May 2022) was used to map the topographical layers, including slope angle, slope aspect, curvature, plan curvature, profile curvature, elevation, streams, stream power index (SPI) and topographic Wetness Index (TWI) layers. These layers were extracted from DEM relying on Surface Analysis and Hydrology tools in ArcMap v. 10.4.1 software. To produce the Normalized Difference Vegetation Index (NDVI) layer, the Sentinel 2A imagery obtained from The European Space Agency (ESA) was used (https://www.esa.int/, accessed on Jul 7, 2022). Precipitation data was gathered from the meteorological corporation in Damascus Governorate. In this respect, the interpolation tools process was utilized to construct rainfall layer. Road information was acquired from the Syrian Public Transport Authority. Faults and geological information were gained from General Geological Authority in Syria. The distance from the faults and road network was analysed by utilising the Euclidean distance tool in ArcMap v. 10.4.1. Soil depth information was obtained from the Ministry of Agriculture in Damascus Governorate (MoA, 2023). The Landuse/Landcover (LULC) map was created based on Global 10 m LULC Datasets developed by ESRI.
Factor
Data source
Data format
Slope angle, slope aspect, curvature, plan curvature, profile curvature, elevation, streams, SPI and TWI
Digital elevation model: Alaska Satellite Facility (ASF), ALOS, 12.5 m Spatial Resolution (
https://vertex.daac.asf.alaska.edu/).
Spatial raster grid data (.tif)
NDVI
The European Space Agency (ESA) was used (https://www.esa.int/)
Spatial raster grid data (.tif)
Rainfall
General Directorate of Meteorology – Tartous Governorate – Perioed (1992 – 2023)
Spatial vector data (.shp)
Road
Ministry of Transport and Communications (Directorate of Transport and Public Roads - Tartous Governorate)
Spatial vector data (.shp)
Geological units and Faults
Geological maps 1/50.000 MOMR, Geology Directorate, Lattakia Governorate.
Spatial vector data (.shp)
Soil depth
Ministry of Agriculture (Directorate of Agriculture - Tartous Governorate)
Spatial vector data (.shp)
Land use/land cover
LULC Datasets developed by ESRI (URL: https://www.arcgis.com/apps/instant/media/index.html?appid=fc92d38533d440078f17678ebc20e8e2
May 2023Spatial raster grid data (.tif)
3.2 Landslide inventory
In the current assessment, historical records, field observations, aerial images and satellite images were utilized to produce a detailed inventory map of landslide events. A total of 200 landslide sites were specified and overlayed. The same number of non-landslide points as landslide sites were also specified randomly for training the models. Landslide events were randomly classified into a training dataset of 140 points (70 %), and a test dataset of 60 points (30 %).
3.3 Predisposing factors
At the present evaluation, sixteen causative factors were determined according to the related literature and geographical specificity, namely: slope degree, slope aspect, curvature, profile curvature, plan curvature, elevation, SPI, TWI, proximity to road, proximity to stream, proximity to faults, LULC (May 2022), rainfall (Perioed: 1992 – 2023), soil depth, lithology and NDVI.
3.4 Multicollinearity assessment
Using an extensive number of affecting factors in susceptibility modelling does not imply the precision of outputs and may eventually lead to significant deviation in predicted outputs (Zeng et al., 2023). Thus, evaluating the importance of influencing factors before the susceptibility modeling process is of great importance to reduce high-dimensional data. In this assessment, the importance of triggering factors was analyzed using a multicollinearity test. The variance inflation (VIF) and tolerance (TOL) are calculated to determine the level of multicollinearity (Eq. (1).
3.5 ML algorithms
Utilizing ML algorithms is considered one of the most useful manners to produce prediction maps for natural hazards, especially landslides. These algorithms suggest susceptibility modelling with greater accuracy compared to traditional statistical methods. In this evaluation, inventory data with driving factors were used to carefully train ML models. The following subsections present the details of the selected algorithm.
3.5.1 Random Forest (RF)
RF is among the popular ensemble ML models. The principle of RF is based on the use of a typical bagging method to randomly select training data and features in multiple subgroups when creating a decision tree for each group. Data is fed and then a prediction decision is obtained for each decision tree independently. Ultimately, the decision outcome is obtained by majority voting on all decision trees.
3.5.2 Support Vector Machine (SVM)
SVM is established on the mathematical Lagrange theory and is used in linearly separable problems. SVM can improve prediction precision, reduce complexity and avoid overfitting (Naceur et al., 2022). Recently, SVM has been widely used to solve non-linear and higher dimension problems in landslide susceptibility assessments (Zhao et al.2022). In this investigation, the radial basis function was relied upon due to the complexity of the data used.
3.5.3 Extreme gradient boost (XGBoost)
XGBoost is the integration of the gradient boosting method and decision tree structures. XGBoost is a robust machine-learning method that demonstrates reliability in landslide susceptibility investigation utilising classification and regression functions. Additionally, XGBoost possesses many positive features such as processing the missing values, mathematical scalability and validation curves and sufficiently demonstrated speed and precision (Zhang et al., 2023). Hence, this algorithm is an effective tool in landslide susceptibility modeling considering the previous limitations.
3.6 Performance assessment of algorithms
Receiver operating characteristic (ROC) curve is utilized for assessing the modelling precision. The area under the curve (AUC) is employed to illustrate the capacity of the proposed model to predict the accuracy of conducted landslide susceptibility modelling (Yao et al., 2023). An AUC value close to 1 indicates a high reliability of the model (Basharat et al., 2023). Additionally, a set of statistical indexes were utilised to consider the accuracy of performance, including precision (Eq. (2), recall (Eq. (3), F1 score (Eq. (4), accuracy (ACC) (Eq. (5), and Matthew’s correlation coefficient (MCC) (Eq. (6).
4 Results
4.1 Multicollinearity assessment
Current results illustrated that all landslide influencing factors have VIF values less than 10, and TOL values greater than 0.1. The lowest TOL and greatest VIF values were 0.591 and 1.727, respectively (Table. 2). Consequently, there is no multicollinearity among factors. Thus, all of the factors were assessed in the modelling phase.
Features
TOL
VIF
Slope degree
0.591
1.689
Aspect
0.933
1.071
Curvature
0.954
1.043
Profile curvature
0.895
1.23
Plan curvature
0.944
1.132
Elevation
0.978
1.22
NDVI
0.753
1.327
LULC
0.989
1.031
Rainfall
0.812
1.551
TWI
0.578
1.727
SPI
0.786
1.271
Lithology
0.638
1.564
Soil depth
0.923
1.082
Proximity to faults
0.791
1.263
Proximity to stream
0.749
1.333
Proximity to road
0.739
1.351
4.2 Landslide influencing factors
In this assessment, sixteen raster layers were produced representing the criteria used in landslide susceptibility modeling. The current results indicate a considerable spatial variation in the slope degree values in Al-Marqab river basin. However, the steep slopes are mainly concentrated along the river beds. The slope angle layer was classified into four categories: <10°, 10°–20°, 20°–30°, and <30° as reported in Fig. 2a. Fig. 2b shows the slope aspect layer which was classified into nine directions.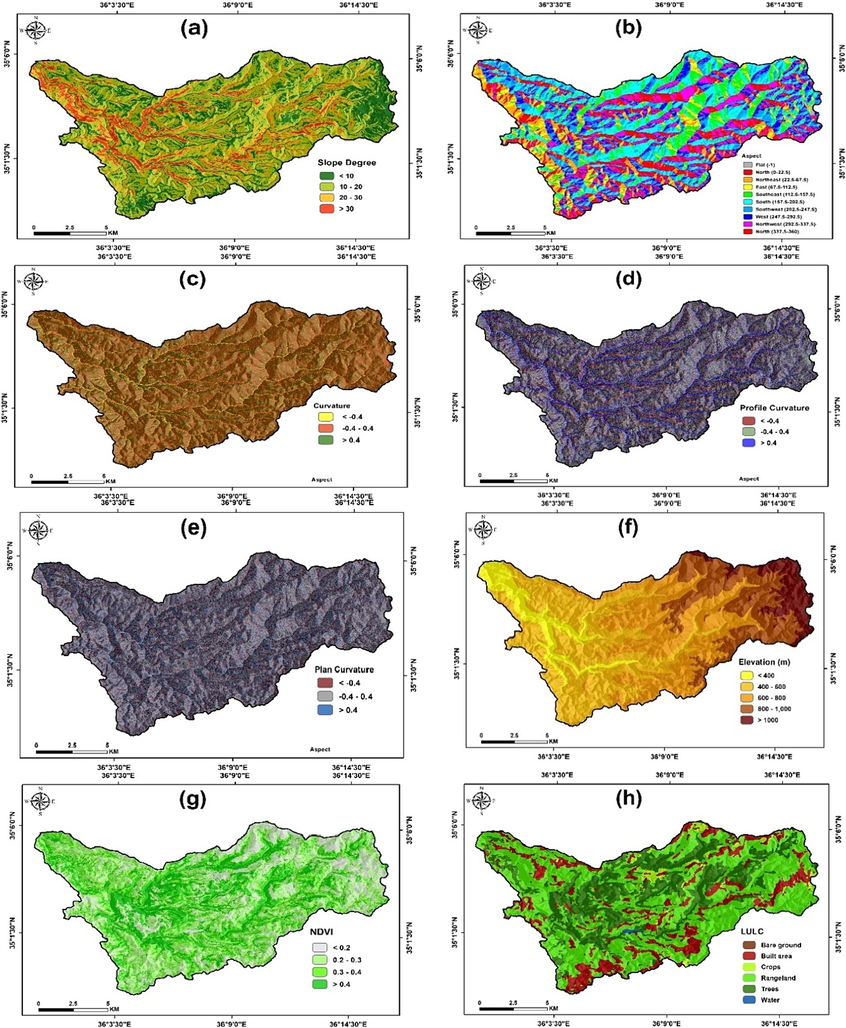
Maps of causative factors (a) slope angels, (b) slope aspect, (c) curvature, (d) profile curvature, (e) plan curvature, (f) elevation, (g) NDVI, (h) LULC, (i) rainfall, (j) TWI, (k) SPI, (l) lithology, (m) soil depth, (n) proximity to faults, (o) proximity to streams, (p) proximity to roads.
Referring to the spatial distribution of negative, flat and positive curvatures, Fig. 2c, d and e illustrate the maps of curvature, profile curvature and plan curvature, respectively. The eastern regions are characterized by great elevation exceeding 700 m, as indicated by Fig. 2f, which presents five spatial domains of elevation. The vegetation (wild and agricultural vegetation) and urban covers occupy most area. Fig. 2g and h depict the LULC and NDVI maps, respectively.
It can be observed that most parts of the study basin feature the greatest values of precipitation, mainly due to the influence of mountainous and plateau topography. Fig. 2i, however, describes the five rainfall classes. Stream networks are characterized by the highest values of topographic moisture, driven by the high runoff rate, thus a higher capacity of sedimentary transport.
Fig. 2j and k show the spatial distribution of TWI and SPI values, respectively. Referring to geological units, the Jurassic and Cretaceous lithological formations cover the largest area of the study area as Fig. 2l illustrates. Moderate shallow soil is spread in most parts, while the eastern parts feature very shallow soil as Fig. 2m shows. The extracted distance from faults, roads and streams was organised into four as depicted in Fig. 2n, o and p, respectively.
4.3 Significance of conditioning factors
Fig. 3 shows the importance of landslide contributing factors in each algorithm used. All models used demonstrated that LULC is the most significant contributing factor for landslide triggering, pursued by curvature factor for the SVM model and the NDVI factor for the RF and XGBoost models. Further, the rainfall and soil depth factors have the least effect on the landslide occurrence according to the XGBoost model, soil depth and curvature factors in the RF model and TWI factor in the SVM model.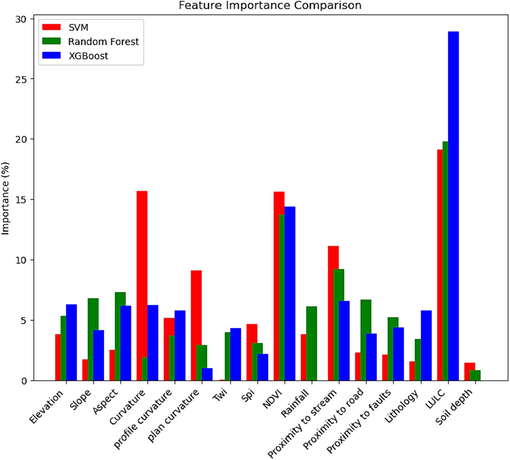
Factors importance of landslide.
4.4 Landslide susceptibility maps
In this investigation, three ML models were utilised to create three landslide susceptibility maps. These maps were categorised into five zones of susceptibility utilising Natural Breaks method in a GIS environment as Fig. 4a, b and c illustrate. Further, the percentage of the landslide susceptibility categories was computed for statistical investigation of the models used, as Table. 3 shows. According to the results, 24 %, 23 % and 9 % of the investigated basin were classified as very high landslide susceptibility in the SVM, RF and XGBoost models, respectively.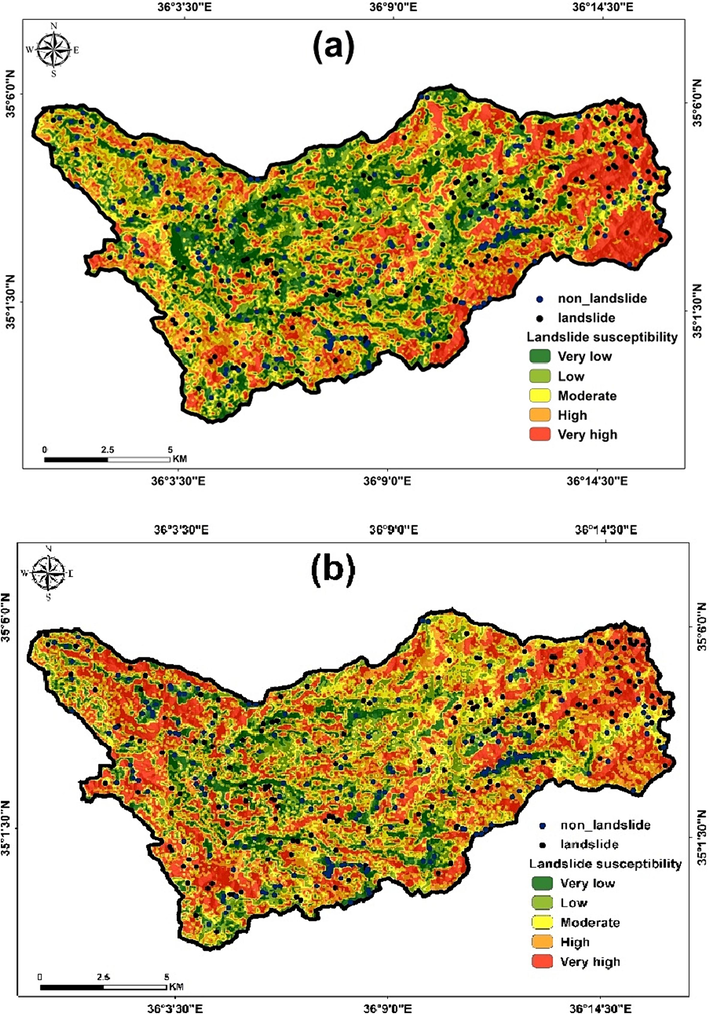
Landslide susceptibility maps (a) SVM, (b) RF, (c) XGBoost.
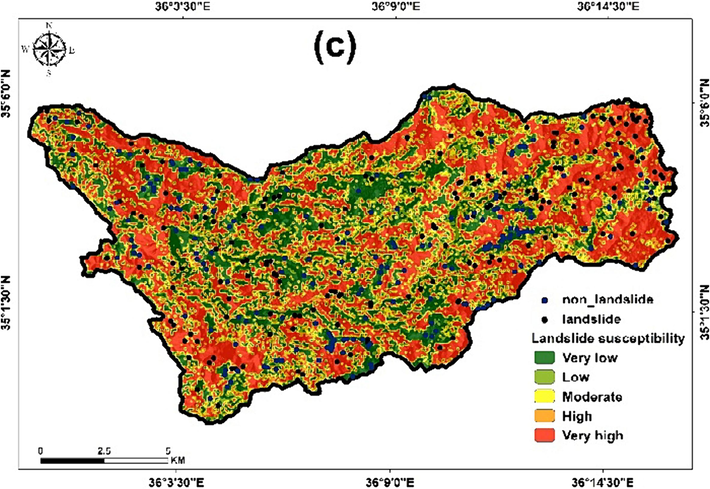
Landslide susceptibility maps (a) SVM, (b) RF, (c) XGBoost.
Classes
SVM
RF
XGBoost
KM2
%
KM2
%
KM2
%
Very low
38.84
21
23.69
13
51.31
27
Low
36.92
19
32.58
17
17.73
9
Moderate
28.99
15
33.12
17
14.76
8
High
39.44
21
44.11
23
17.82
9
Very high
45.67
24
56.32
30
88.24
47
4.5 Validation
Fig. 5 shows the AUC values using the test dataset for the three models. The outcomes indicate that the AUC value for the SVM, XGBoost and RF models was 0.90, 0.94 and 0.96, respectively. Thus, these acceptable AUC results indicate the reliability of the models performance in Al-Marqab river basin. Moreover, the RF algorithm showed the most elevated performance of prediction and classification (AUC = 0.96), indicating provides more objective spatial results than the rest of the models. Moreover, the models accuracy was evaluated using five metrics as Table. 4 illustrated.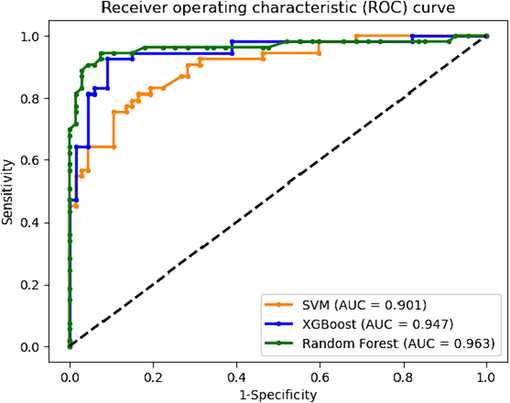
ROC plots of SVM, XGBoost and RF algorithms.
Classifier
Precision
Recall
F1 score
ACC
MCC
SVM
0.88
0.84
0.86
0.88
0.76
XGB
0.89
0.92
0.90
0.91
0.83
RF
0.90
0.92
0.91
0.92
0.81
5 Discussion
The current analysis presents a spatial assessment of the landslide susceptibility in the western Syria, using ML algorithms, namely SVM, XGBoost and RF. The approach applied in this assessment improves the landslide susceptibility modelling in the study area and also enhances the understanding of the spatial behavior of this hazard in the terrain systems of the eastern Mediterranean.
Landslide layers were classified using the Natural Breaks method which suggests reliable, non-biased landslide hazard classes. The three produced maps showed that the eastern region of the study area is the most susceptible to the movement of slope materials. Slopes in these areas are featured by many geomorphological processes that drive an increase in landslide events, especially karstification. Moreover, the acceleration of human activities, especially engineering works, is among the most important causes of instability patterns in slopes (Hammad et al., 2020; Abdo et al., 2022). Fieldwork revealed that the landslide events in the study area are a mixture of moving materials consisting of soil, mud, debris and or rock.
The accelerating risk of landslides requires further analysis and evaluation in this region, which is characterized by fragile topography. Current results indicated that the RF model is stronger at prediction of landslide susceptibility than SVM and XGBoost models. The RF algorithm is characterized by high predictability by preserving input parameters and flexible handling of big data. Likewise, the RF algorithm identifies non-linear correlations between dependent and independent factors (Hussain et al., 2022). However, this result is consistent with many assessments carried out in several Mediterranean regions (Akinci and Zeybek, 2021; Ali et al., 2021).
ML provides a highly accurate technical platform for predicting landslide susceptibility based on nonlinear relationships between influence factors. This feature is very suitable for use in a region with complex spatial relationships, such as the Eastern Mediterranean. Therefore, the RF model reliably overlays between the training dataset and the values of the driving factors, so it is suitable for geomorphological hazard assessment. However, the current assessment provides a constructive tool that enables continuous improvement of the mapping quality in the Eastern Mediterranean region.
Moreover, the three algorithms used proved that the LULC factor is the most influential in occurring landslides. Thus, LULC factor has outperformed physical factors that stimulate landslide, including slope, curvature and soil depth. Hence, this can be explained by accelerated human activities, especially agricultural development, urbanization and road construction, which increase the slope instability events. Similar results can be found in a study by Zhang et al. (2023).
Despite the variability in the performance of the algorithms applied in this assessment, they have proven to be reliable in modeling landslides. Working on testing more ML algorithms while improving data quality is a recommended procedure in the context of improving the landslide susceptibility assessment in the eastern Mediterranean. Overall, the findings presented in this assessment represent a valuable foundation for decision-makers, engineers and land managers in the Syrian context.
6 Conclusions
The Eastern Mediterranean is among the regions most affected by landslide incidents globally. Therefore, there is an urgent need to conduct landslide vulnerability assessments using state-of-the-art research tools. Hence, assessment of the ML algorithms performance in mapping landslide susceptibility has been the focus of a limited number of studies in the Eastern Mediterranean in general and Syria in particular. Moreover, it is significant to understand the influence of the driving factors in increasing landslide events across this region, which is characterized by complex spatial relationships. To fill this gap, this assessment aims to test the performance of three ML algorithms, i.e., SVM, RF and XGBoost, in landslide assessment in the eastern Mediterranean. In this regard, 200 landslide events with 16 triggering factors were inventoried. The present results indicate that the RF model achieved a stronger performance compared to the SVM and XGBoost models.
Moreover, among triggering factors, LULC was the considerable influential parameter in increasing landslide events. The current outcomes confirm that the acceleration of human activities in the Mediterranean terrain systems has outperformed the most influential natural factors in increasing landslide events, according to various literature. Thus, the geographical characteristics of the studied catchment require special attention. The outputs of this assessment provided a reliable assessment of the landslide susceptibility in the Eastern Mediterranean. Overall, the approach applied in this study constitutes a unique platform that helps manage geomorphological risks, especially landslides, in countries with scarce data and suffering from the consequences of war, such as Syria.
Declaration of competing interest
The authors declare that they have no known competing financial interests or personal relationships that could have appeared to influence the work reported in this paper.
References
- Assessment of landslide susceptibility zonation using frequency ratio and statistical index: a case study of Al-Fawar basin, Tartous, Syria. Int. J. Environ. Sci. Technol.. 2022;19(4):2599-2618.
- [Google Scholar]
- Spatial implementation of frequency ratio, statistical index and index of entropy models for landslide susceptibility mapping in Al-Balouta river basin, Tartous Governorate, Syria. Geosci. Lett.. 2022;9(1):1-24.
- [Google Scholar]
- Landslide susceptibility mapping using machine learning: a literature survey. Remote Sens. (Basel). 2022;14(13):3029.
- [Google Scholar]
- Assessment of rainfall-induced landslide susceptibility in Artvin, Turkey using machine learning techniques. J. Afr. Earth Sc.. 2022;191:104535
- [Google Scholar]
- Comparing classical statistic and machine learning models in landslide susceptibility mapping in Ardanuc (Artvin), Turkey. Nat. Hazard.. 2021;108(2):1515-1543.
- [Google Scholar]
- GIS-based landslide susceptibility modeling: a comparison between fuzzy multi-criteria and machine learning algorithms. Geosci. Front.. 2021;12(2):857-876.
- [Google Scholar]
- Spatial–temporal dynamic impact of changes in rainfall erosivity and vegetation coverage on soil erosion in the Eastern Mediterranean. Environ. Sci. Pollut. Res. 2022:1-19.
- [Google Scholar]
- An integrated approach based landslide susceptibility mapping: case of Muzaffarabad region, Pakistan. Geomat. Nat. Haz. Risk. 2023;14(1):2210255.
- [Google Scholar]
- Analysis of conditioning factors in cuenca, ecuador, for landslide susceptibility maps generation employing machine learning methods. Land. 2023;12(6):1135.
- [Google Scholar]
- Landslide susceptibility modeling using bivariate statistical-based logistic regression, naïve Bayes, and alternating decision tree models. Bull. Eng. Geol. Environ.. 2023;82(5):190.
- [Google Scholar]
- Slope-unit scale landslide susceptibility mapping based on the random forest model in deep valley areas. Remote Sens. (Basel). 2022;14(17):4245.
- [Google Scholar]
- Effect of densification on the shear strength of landslide material: a case study from Salt Range, Pakistan. Earth Sci. Res.. 2015;4(1):113.
- [Google Scholar]
- Ghayur Sadigh, A., Alesheikh, A. A., Bateni, S. M., Jun, C., Lee, S., Nielson, J. R., ... Rezaie, F., 2023. Comparison of optimized data-driven models for landslide susceptibility mapping. Environ. Dev. Sust. 1-28.
- Integration of GIS and advanced remote sensing techniques for landslide hazard assessment: a case study of Northwest Syria. ISPRS Ann. Photogram. Rem. Sens. Spat. Inform. Sci.. 2020;6:27-34.
- [Google Scholar]
- Landslide susceptibility mapping using machine learning algorithm: a case study along Karakoram Highway (KKH), Pakistan. J. Indian Soc. Remote Sens.. 2022;50(5):849-866.
- [Google Scholar]
- Model performance analysis for landslide susceptibility in cold regions using accuracy rate and fluctuation characteristics. Nat. Hazards. 2021;108:1047-1067.
- [Google Scholar]
- Dynamic prediction of landslide life expectancy using ensemble system incorporating classical prediction models and machine learning. Geosci. Front.. 2024;15(2):101758
- [Google Scholar]
- Flash flood and landslide susceptibility analysis for a mountainous roadway in Vietnam using spatial modeling. Quat. Sci. Adv.. 2023;11:100083
- [Google Scholar]
- MoA, 2023. Ministry of Agriculture, Damascus Governorate, soil datast.
- Soil management effects on soil water erosion and runoff in central Syria—a comparative evaluation of general linear model and random forest regression. Water. 2020;12(9):2529.
- [Google Scholar]
- Performance evaluation of machine learning algorithms to assess soil erosion in Mediterranean farmland: a case-study in Syria. Land Degrad. Dev.. 2023;34(10):2896-2911.
- [CrossRef] [Google Scholar]
- Performance assessment of the landslide susceptibility modelling using the support vector machine, radial basis function network, and weight of evidence models in the N'fis river basin, Morocco. Geosci. Lett.. 2022;9(1):1-20.
- [Google Scholar]
- Landslide susceptibility prediction based on decision tree and feature selection methods. J. Indian Soc. Remote Sens.. 2023;51(4):771-786.
- [Google Scholar]
- Predicting landslide susceptibility based on decision tree machine learning models under climate and land use changes. Geocart. Int.. 2022;37(25):7881-7907.
- [Google Scholar]
- A Multi-Criteria Decision Analysis (MCDA) approach for landslide susceptibility mapping of a part of darjeeling district in North-East Himalaya, India. Appl. Sci.. 2023;13(8):5062.
- [Google Scholar]
- Landslide susceptibility modeling based on remote sensing data and data mining techniques. Environ. Earth Sci.. 2022;81(2):50.
- [Google Scholar]
- Prediction of landslide susceptibility in Wenchuan County based on pixel-level samples. Bull. Eng. Geol. Environ.. 2023;82(6):203.
- [Google Scholar]
- Performance comparison of landslide susceptibility mapping under multiple machine-learning based models considering InSAR deformation: a case study of the upper Jinsha River. Geomat. Nat. Haz. Risk. 2023;14(1):2212833.
- [Google Scholar]
- Evaluation of neural network models for landslide susceptibility assessment. Int. J. Digital Earth. 2022;15(1):934-953.
- [Google Scholar]
- Understanding dynamics of land use & land cover change using GIS & change detection techniques in Tartous, Syria. Euro. J. Geogr.. 2023;14(3):20-41.
- [Google Scholar]
- Landslide susceptibility zonation using the analytical hierarchy process (AHP) in the Bafoussam-Dschang region (West Cameroon) Adv. Space Res.. 2023;71(12):5282-5301.
- [Google Scholar]
- Ensemble learning framework for landslide susceptibility mapping: different basic classifier and ensemble strategy. Geosci. Front. 2023
- [Google Scholar]
- Slope stability prediction using ensemble learning techniques: a case study in Yunyang County, Chongqing, China. J. Rock Mech. Geotech. Eng.. 2022;14(4):1089-1099.
- [Google Scholar]
- Landslide Susceptibility mapping using random forest and extreme gradient boosting: a case study of Fengjie, Chongqing. Geol. J.. 2023;58(6):2372-2387.
- [Google Scholar]
- Combining a class-weighted algorithm and machine learning models in landslide susceptibility mapping: a case study of Wanzhou section of the Three Gorges Reservoir, China. Comput. Geosci.. 2022;158:104966
- [Google Scholar]
- Landslide susceptibility evaluation integrating weight of evidence model and InSAR results, west of Hubei Province, China. Egypt. J. Remote Sens. Space Sci.. 2023;26(1):95-106.
- [Google Scholar]
- Comparison of LR, 5-CV SVM, GA SVM, and PSO SVM for landslide susceptibility assessment in Tibetan Plateau area, China. J. Mount. Sci. 2023:1-17.
- [Google Scholar]
- An improved spatial case-based reasoning considering multiple spatial drivers of geographic events and its application in landslide susceptibility mapping. Catena. 2023;223:106940
- [Google Scholar]
- Landslide susceptibility mapping using hybrid random forest with GeoDetector and RFE for factor optimization. Geosci. Front.. 2021;12(5):101211
- [Google Scholar]


