

Translate this page into:
Application of gravity and remote sensing data to groundwater storage variation in Wadi Al Dawasir, Saudi Arabia
⁎Corresponding authors. ahmedmohamed@aun.edu.eg (Ahmed Mohamed), mohammed.musaab@uni-miskolc.hu (Musaab A.A. Mohammed)
-
Received: ,
Accepted: ,
This article was originally published by Elsevier and was migrated to Scientific Scholar after the change of Publisher.
Abstract
In order to deal with the increase in human-caused impacts, Saudi Arabia is exploring new groundwater sources. Significant agricultural development in Wadi Al Dawasir has resulted in an overuse of groundwater resources. Constant monitoring of the wadi's groundwater is necessary in order to make informed decisions about the future of the wadi's groundwater resources and the local economy. The rate of groundwater depletion in the Wadi Al Dawasir drainage basin in northern Saudi Arabia was calculated by combining data from the advanced Gravity Recovery and Climate Experiment (GRACE) mission with outputs from a land surface model. The analysis covered the period from April 2002 to December 2021. The results are as follows: (1) the average terrestrial water storage fluctuation (ΔTWS) was calculated at −0.48 ± 0.02 cm yr−1; (2) the average soil moisture storage change (ΔSMS) was calculated at + 0.0008 ± 0.0002 cm yr−1; (3) the average groundwater depletion rate was computed at −0.48 ± 0.02 cm yr−1; (4) the average yearly rainfall data for the Wadi Al Dawasir was 90.1 mm; (5) The surface relief is creating eastward streams that carry surface water downstream; (6) Significant agricultural expansions over the past few decades can be observed through Landsat change detection; (7) Higher sediment accumulation varying from 400 to more than 3000 m is observed in the east, near the Wadi's downstream, where the Wajid aquifer can be found. The integrated approach is a cost-effective and efficient tool for accurately evaluating the variability of groundwater resources over large regions.
Keywords
Gravity
Landsat images
Groundwater resources
Depletion
Wadi Al Dawasir
Saudi Arabia

1 Introduction
Even though groundwater provides 30–50 % of the freshwater used around the world (WWAP, 2006), it only provides 2.5–5 % of the world's total water supply. Global advancements in social, economic, agricultural, and industrial sectors have been facilitated by the presence of groundwater (Siebert et al., 2010). Groundwater resources can be developed and used to meet both current and future needs, but this can only be done if it safeguards the environment or the economy. Groundwater sustainability is the term used to describe this phenomenon. The groundwater system is no longer sustainable if annual extraction rates exceed annual recharge rates (Grogan et al., 2017). The water tables have been falling in some locations due to excessive pumping of groundwater. Wells and springs eventually run dry as a result of this. It also results in increased pumping costs, decreasing reservoir and stream levels, land subsidence, worsening groundwater quality, and increased competition for water (e.g., Mohamed et al., 2022 a,b,c).
Saudi Arabia, situated in an arid and semi-arid region, seeks additional freshwater sources to address the demands of its increasing population and developing urban areas, as well as for agricultural, industrial, and domestic purposes. According to the most recent data from the General Authority for Statistics in 2023, the population of KSA experienced a growth rate of nearly 20 % between 2010 and 2022, rising from over 27 million to 32.2 million. The data indicates that there is an average annual growth rate of 2.5 % based on the information provided by the General Authority for Statistics, 2023 and Alodah, 2023.
Eighty percent of Saudi Arabia's water comes from groundwater, ten percent from surface water, five percent from desalinized water, and five percent from recycled water (Ouda et al., 2014). Saudi Arabia's agriculture needs 85 % of the water used in the country, while households and industrial sectors only use 15 %. Saudi Arabia needs a lot more water now than it did before because its population is growing so quickly. Because of this, aquifers have been heavily pumped for their water, going from 1.8 km3 in 1980 to 9 km3 in 1990 and 16 km3 in 2010 (Ouda et al., 2014). Ouda (2013) stated that “Saudi Arabia's water usage was expected to be 24 km3 per year. Eighty-three percent of Saudi Arabia's water needs come from agriculture, and seventeen percent from municipal and industrial uses, and seventeen percent from homes (Alhassan et al., 2015).
Two of the primary factors contributing to the increasing strain on the planet's finite natural resources are population growth and changing consumption patterns. Freshwater resources are among the most vulnerable on Earth because of rising annual demand and the resulting decline in water quality. Yet, climate change poses a threat to the long-term variability of Saudi Arabia's freshwater resources, particularly through changes in the distribution and intensity of precipitation and/or temperature (Mohamed et al., 2022 a,b,c).
Since 2002, the Gravity Recovery and Climate Experiment (GRACE) mission and its successor GRACE Follow-On (GRACE-FO) mission have offered a new capability to track changes in groundwater storage (ΔGWS) on a global scale with increased accuracy by vertically disaggregating signals of changes in terrestrial water storage (ΔTWS) (Landerer et al., 2020). The GRACE gravity satellites efficiently make up for the limitations of ground-based observations, such as poor monitoring data coverage, unequal spatial distribution, challenging data collecting, and point-specific assessments (Hu and Jiao, 2015). GRACE data has been put to use all across the world, including in places like India (Rodell, et al., 2009), the American High Plains and California's Central Valley (Scanlon et al., 2012), Africa (Mohamed et al., 2022a–d;Mohamed et al., 2023a), the Middle East (Mohamed and Gonçalvès, 2021; Mohamed et al., 2023b).
Predictions of the recharge rates have been made using physical, chemical, and vadose zone modeling tools (de Vries and Simmers, 2002). Scale effects and model parameter uncertainty make it difficult to extrapolate from these local studies to larger regions (Gonçalvès et al., 2013). One more difficulty is that there is not enough data to effectively apply these methods to estimate recharge and/or decline rates on a regional and/or continental scale (Mohamed, 2020). Ground and/or satellite-based technology have only recently made data on some individual constituents like surface water and soil moisture available (Njoku et al., 2003). Also, there is not yet a global network infrastructure for routine monitoring of ΔTWS at the level of continental scale (Lettenmaier and Famiglietti, 2006).
Due to the limited availability of ground-based groundwater (GW) monitoring facilities, particularly in the Middle East, remote sensing observations have become increasingly vital. This paper examines the historical contributions of remote sensing observations and explore their potential in future endeavors to gather data on groundwater resources. Furthermore, we provide a comprehensive overview of current datasets and processing techniques to promote the application of remote sensing datasets for groundwater research in Saudi Arabia. Our utilization of the Wadi Al Dawasir as a case study demonstrates that GRACE data can provide dependable measurements for mass changes over large hydrologic systems, a task that is otherwise difficult to accomplish. Furthermore, our research shows that by combining GRACE data with other relevant climatic datasets such as GLDAS, the authors can successfully investigate questions regarding water replenishment and discharge, the status of underground water reservoirs (whether they are in equilibrium or experiencing depletion), and the nature of the factors contributing to the depletion.
2 Geology and hydrogeology
The geology of the Wadi Al Dawasir basin is made up of many different geologic formations that occurred over long periods of time, from the Pre-Cambrian to the Quaternary, as displayed in Fig. 1. The study basin contains significant tectonic lineaments and faults that are essential for replenishing shallow groundwater aquifers. Benaafi et al (2019) conducted an analysis and provided a description of the fracture system in the Wajid Group, which is situated in the Wadi Al-Dawasir area. This analysis utilized satellite imaging and measurements taken on the ground. Five sets of large-scale fractures (lineaments) have been identified as follows: N000°, N015°, N035°, N075°, and N135°. In addition, five sets of fractures were observed at the outcrop level: N015°, N035°, N075°, N135°, and N165°. The prevailing fracture sets at the regional level are oriented at N135° and N035°. The sedimentary sequence has been intersected by a complex network of faults that extend in a north–south, north-northwest to south-southeast, west-northwest, and north-northeast to south-southwest direction. These faults cut across folded blocks and exhibit strike-slip fault patterns associated with the Najd fault and the transform fault systems. This information is based on geophysical datasets provided by Al Asmari et al. (2016) and Benaafi et al. (2019). There were four aquifers identified with different hydrochemical characteristics: Lower Wajid, Upper Wajid, Khuff-Kumdah, and the Quaternary (Masoud and Aldosari, 2020).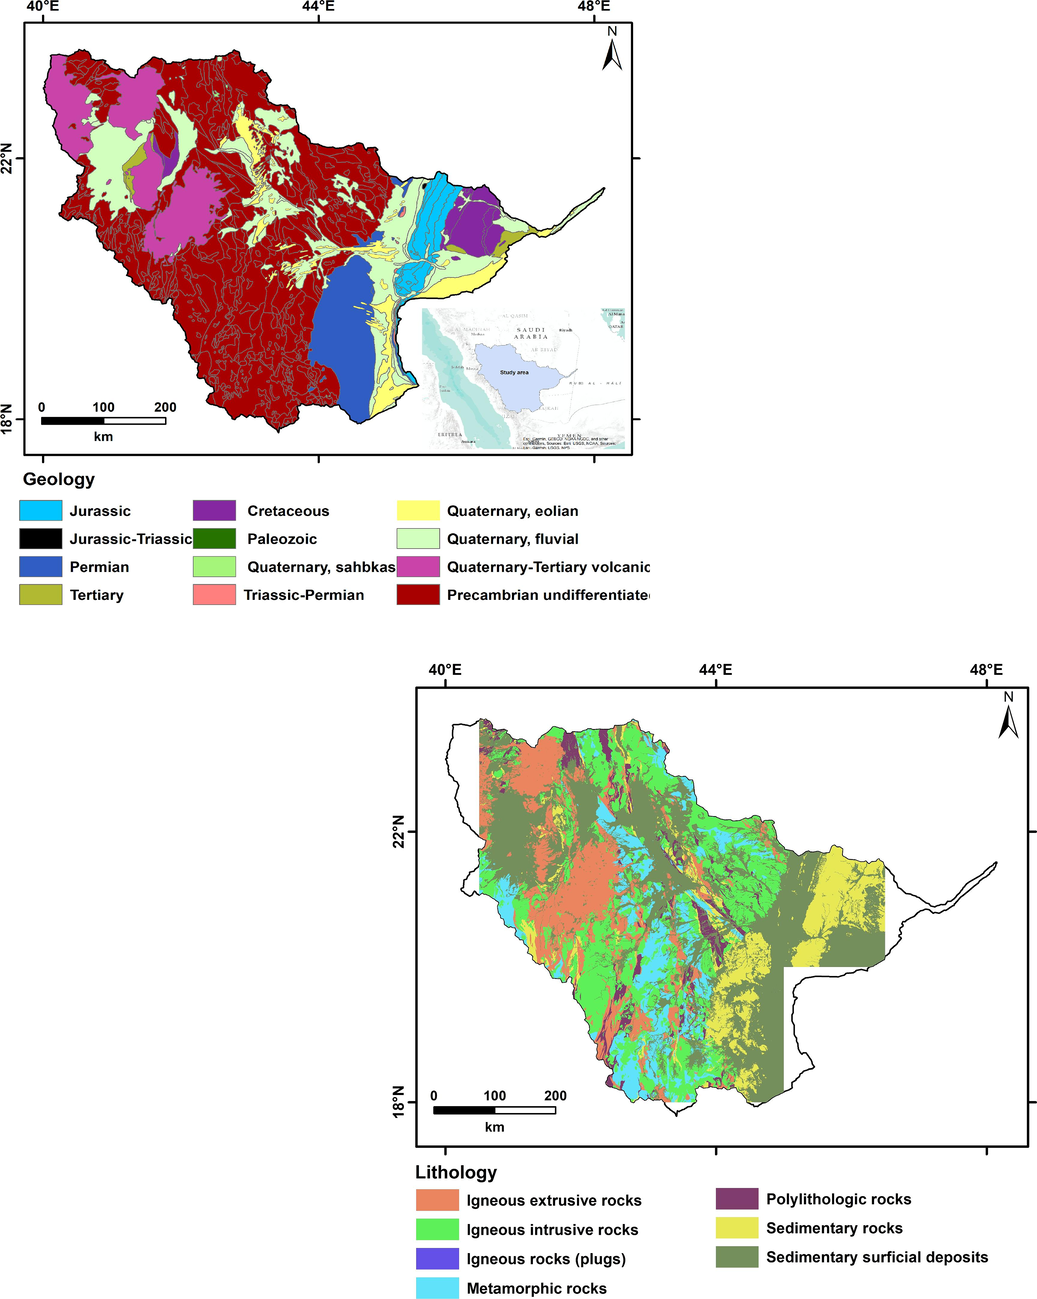
A geological (a) and lithological (b) map of Wadi Al Dawasir in Saudi Arabia.
Pre-Cambrian rocks with extremely poor permeability, such as granitic rocks, gneiss, schist, and volcanic series, make up about 44.2 % of the overall study basin. The Cambrian-Ordovician sandstone covers less than 0.01 % of the area in the upstream parts of the Wadi Ranyah and Bishah sub-basins (Masoud et al., 2019).
About 8.5 % of the entire area is made up of Permian rocks, which were found in both the Wadi Al Hinu and Tathlith sub-basins. The Jurassic rocks that are represented mostly of limestone and dolomite in Wadi Himam and Al Maqran sub-basins, formed approximately 3.4 % of the Wadi Al Dawasir basin. Cretaceous sediments are found in both the Wadi the Himam and Al Maqran sub-basins. They consist of sandstone with some calcareous deposits and form ∼3 % of the entire study basin. Recent Quaternary sediments occupy ∼34.3 % of the basin formed of gravel, eolian sands, silt, and clay. Tertiary sediments occupy an area of ∼6.5 % of the basin, located in Sha'ib Qarnayn and Wadi Fush sub-basins. They are consisted of limestone, marl, and sandstone (Masoud et al., 2019).
The hydrogeological conditions are relatively uncomplicated. Within the studied area, there are two distinct aquifers: the Wajid Sandstone and the Quaternary Alluvium. In practical terms, this was the case approximately 20 years ago. Currently, it seems that the Wajid Sandstone is the only aquifer that can be regarded as suitable for significant water supply in the Wadi Al Dawasir Area. The Wajid Group is a geological formation consisting of sedimentary rocks from the Cambro-Permian period. It is the primary source of underground water in the study region and is also believed to have the potential to contain hydrocarbon deposits in the Rub' Al-Khali Basin. The succession is made of fluvial, marine, and glacial to glaciofluvial deposits (Benaafi et al., 2019). The extraction of water from the Quaternary aquifer is currently little or nonexistent (Al-Ahmadi, 1992). A significant amount of irrigation water is extracted from the water-bearing aquifers of the Wajid Sandstone, which has a confirmed reserve of about 30,000 million cubic meters (Masoud and Aldosari, 2020). The groundwater migrates towards the natural downstream outlets of the Wadi ad-Dawasir. However, the groundwater level in the southern region has been decreasing because the natural outflow from the underground water source seems to be exceeding the amount of water being replenished, resulting in a significant reduction in the water level. The limited recharge and the rapid pace of extraction from wells result in the depletion of water (Masoud and Aldosari, 2020).
3 Data and methods
This study utilized three distinct time-varying gravity mascon solutions acquired from GRACE data centers. The JPL-RL06M (v02) dataset, the CSR-RL06M (v02) dataset, and the GSFC-RL06M (v01) dataset are all mascon products created by the Jet Propulsion Laboratory (JPL), the Center for Space Research at the University of Texas (CSR-UT), and the National Aeronautics and Space Administration (NASA) Goddard Space Flight Center (GSFC), respectively. The mascon solutions offer superior spatial resolution and accuracy compared to spherical harmonic solutions, allowing for the collection of all signals while adhering to the GRACE noise limitations. There is no need for smoothing or de-striping. Certain products may not require the use of the scaling factor, as indicated by Watkins et al. (2015), Save et al. (2016), and Wiese et al. (2016). For this investigation, we utilized the GRACE (04/2002–06/2017) and GRACE-FO (06/2018–12/2021) RL06 mascon solution datasets to calculate the monthly variations in TWS.
The CSR-RL06M (v02) solution, derived from an equal area projected with a resolution of 1°, exhibits fluctuations in TWS on a grid of 0.25° latitude-longitude grids (Save et al., 2016; Save, 2020). In order to minimize the passage of water between the ocean and land, the hexagonal tiles along the shoreline in the new grid are divided into sections that belong to either the ocean or the land. The scaling factor is insignificant for mascons of such diminutive size. The TWS anomalies were computed for each 3° × 3° mascon block in the JPL-RL06M (v02) solution, as described by Watkins et al. (2015) and Wiese et al. (2016). The ultimate dataset samples fluctuations in TWS at 0.5 degrees of longitude and latitude grids. Given that the JPL-RL06M (v02) has a true resolution of 3 degrees, we may utilize the scaling factors provided by JPL to recover the leakage signals produced by the mascon blocks. When comparing more recent data releases to previous ones, JPL-RL06M (v02) demonstrates enhanced capability in distinguishing between land and ocean mascons. To differentiate between land and ocean masses, a single mascon was used that moves along coastlines and minimizes errors that occur when crossing them (Wiese et al., 2016). The Coastal Resolution Improvement filter (Watkins et al., 2015) was applied to the complete mascon solution during processing. The linear difference method was employed to address the temporary data gaps in the GRACE dataset from 2003 to 2020, except the 11-month gap between GRACE and GRACE-FO. In addition to the JPL and CSR mascon datasets, we utilized the GSFC-RL06v1.0 mascon solution, which was calculated for each mascon in a 0.5° × 0.5° square. In order to ascertain the secular trend, we simultaneously applied a trend and seasonal term to each TWS time series. Subsequently, this procedure is employed to ascertain the errors in the generated trend values.
The monthly soil moisture storage (ΔSMS) data were collected from the Noah V2.1, VIC V2.1, and CLM V2.1 models of the Global Land Data Assimilation System (GLDAS: Rodell et al., 2004) with a spatial resolution of one degree. The monthly data covers the same interval as the GRACE data. The analyses were conducted. To maintain consistency with the GRACE-derived TWS anomalies, the SMS was also approximated by subtracting the average values between 2004 and 2009 for both variables. ΔSMS could be subtracted from the TWS anomalies to obtain the GWS anomaly.
Satellite Tropical Rainfall Measuring Mission (TRMM; Kummerow, 1998) data was utilized to calculate rainfall totals. Similar to GRACE and GLDAS, TRMM data spans the same interval with a finer spatial resolution of 0.25°. Using TRMM data, we averaged all of the monthly rainfall totals over the study region to produce the average annual rainfall (AAR) map. This study was conducted to understand more about the long-term impacts of rain on the ΔGWS.
4 Result and discussion
Saudi Arabia is a dry country that uses a lot of groundwater because of its extreme aridity. Most of the country's inhabitants reside in regions that rely heavily on groundwater for both human consumption and agricultural purposes. Saudi Arabia’s groundwater has been widely used since 1980 s. From June through October, as shown in Fig. 2a, the average monthly rainfall rate is quite low, whereas from November through May, it rises gradually. Fig. 2b shows a time series of annual precipitation, with 2016 having the maximum rate (148 mm) and 2014 having the minimal (57.66 mm). According to the AAR map, shown in Fig. 2c, the southwestern part of the wadi receives the highest rain (more than 160 mm), while the northeastern receives the least (up to 70 mm).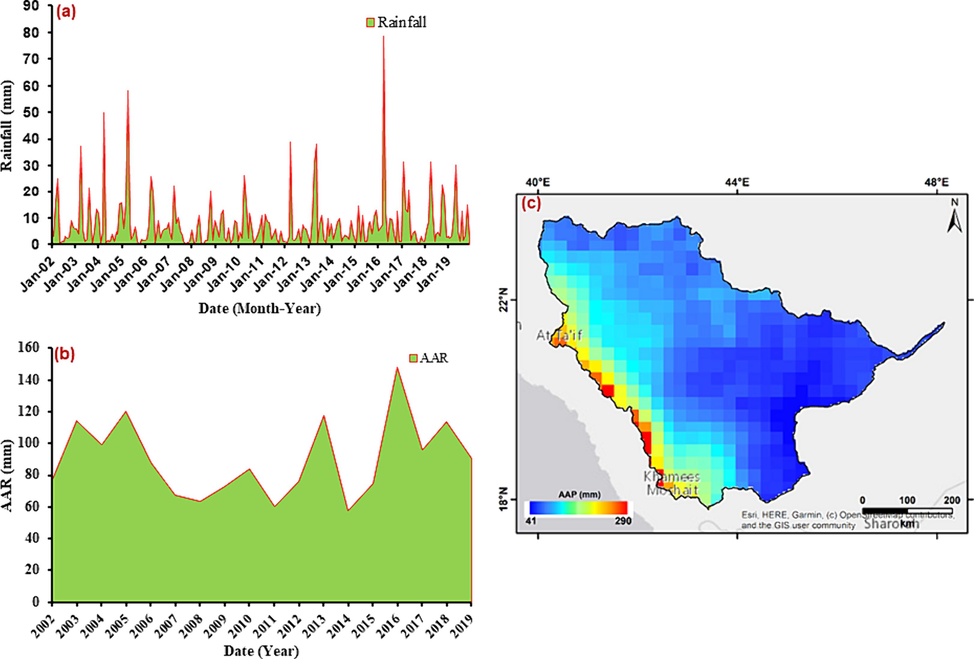
Monthly precipitation (a), the AAR times series (b), and the AAR variation (c) derived from TRMM data for the study region.
The average annual rainfall rate was predicted to be 90.1 mm for the study area during the analysis period (2002–2019), suggesting that the region would continue to be dry.
The GRACE-extracted TWS is split into distinct partitions using other climatic data based on Equation (1). In Fig. 3, we see a time series representing the mean ΔTWS changes over Wadi, calculated by taking the mean of the GRACE solutions (Avg-Mon) from JPL, CSR, and GSFC, and their mean. Temporal TWS patterns, generated from the three sources, show significant correlation coefficients of 0.90 to 0.94 at error rate 0.01. Fig. 3 illustrates an overall decline in TWS calculations obtained from the three GRACE data sets. TWS calculations using JPL, CSR, and GSFC mascon GRACE solutions showed depletion rates of − 0.51 ± 0.02, − 0.39 ± 0.02, − 0.54 ± 0.02 cm yr−1, respectively with a mean of − 0.48 ± 0.02 cm yr−1. It is clear from examining Fig. 4 how the secular TWS trends have been distributed spatially across the studied area. It demonstrates that whereas the northern region only has somewhat negative TWS trends, the southern region has higher negative TWS trends.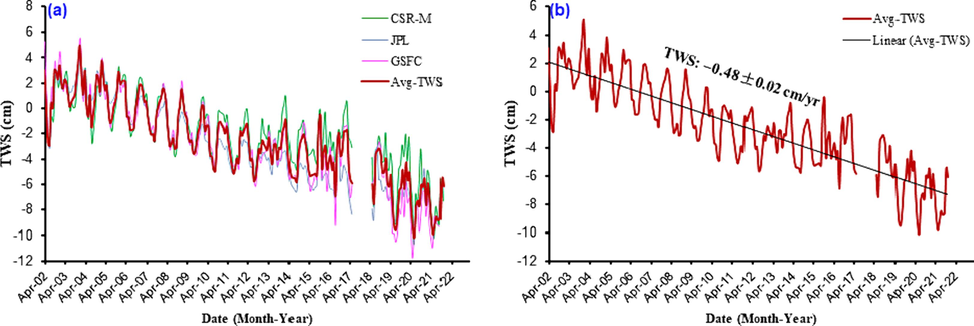
The arithmetic mean of the monthly TWS time series derived from the solutions for the research region.
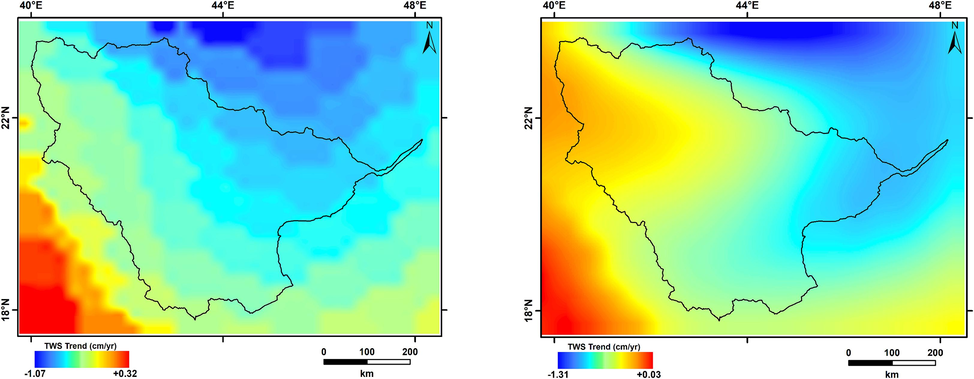
Spatio-temporal GRACE-derived TWS variations for the wadi region using (a) CSR, and (b) GSFC mascon solutions.
Three versions of GLDAS (VIC, CLM, and NOAH models) were used to determine ΔSMS across the study region (Table 1). A modest negative ΔSMS trend value of − 0.008 ± 0.02 mm yr−1 was estimated for the research area for the entire study period (Fig. 5). The estimated changes in surface water storage (ΔSWS), canopy water storage (ΔCWS), and snow water equivalent (ΔSWE) are additional non-groundwater contributions, but they are not significant enough in this arid environment because there are no discernible trends in time series.
Component (cm)
Value
GRACE total
(ΔTWS)CSR
−0.39 ± 0.02
JPL
−0.51 ± 0.02
GSFC
−0.54 ± 0.02
AVG
−0.48 ± 0.02
ΔSMS
−0.0008 ± 0.002
ΔGWS
−0.48 ± 0.02
AAR (mm)
90.1
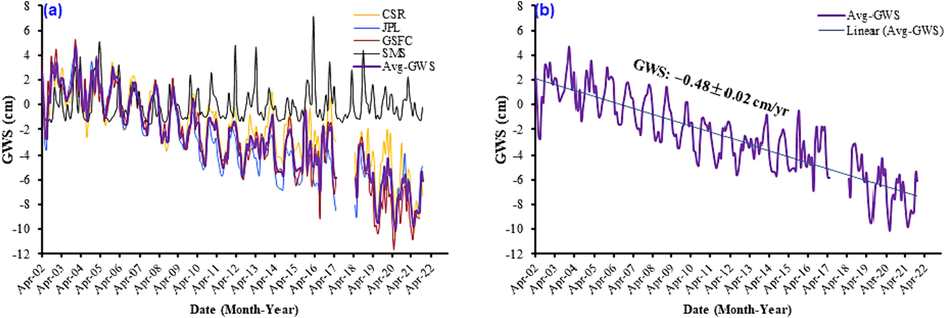
Monthly ΔSMS, and ΔGWS variations from the three solutions for the wadi region and their averaging.
It has already been mentioned that GRACE is unable to differentiate between abnormalities induced by various TWS partitions (i.e., SMS, SWS, GWS). Therefore, the non-groundwater components represented by ΔSMS shifts were estimated using the ΔTWS parts of the GLDAS model. As shown in Equation (1), the ΔGWS was determined by subtracting the ΔSMS storage from GLDAS from the ΔTWS storage from GRACE (1). The ΔGWS (Fig. 5) follows the same seasonal pattern as the ΔTWS, with slightly higher values from October to April and decreasing values from May to September. Estimates for the rate of change in ΔGWS are provided by CSR, JPL, and GFCF, with a mean value of −0.48 ± 0.02 cm yr−1 (Table 1; Fig. 5) after removing the non-substantial ΔSMS trend (−0.0008 ± 0.002 cm yr−1) value from the average ΔTWS trend (−0.48 ± 0.02 cm yr−1) value.
Landsat datasets have been analyzed, which comprised many years' importance of satellite imagery, to demonstrate how human activities have resulted in change of land use and land cover (Fig. 6). Wadi Al Dawasir was first developed in 1965, marking the beginning of Wajid exploitation in Saudi Arabia. Extraction from the aquifer began at 11 x 106 m3/yr in 1968, increased to 25 x 106 m3/yr in 1977 (Ministry of Agriculture and Water, 1984), and then accelerated through the 1980s and 1990s to be 2,260 x 106 m3/yr by 2004. This is evidenced recently by the Landsat's 1984 images of the arid Wadi Al-Dawasir area that show little evidence of farming. However, many more green specks can be observed dotting the desert in following images up to 2022. Center-pivot irrigation systems are depicted by the blackish green dots, each of which waters a portion of land. The different agricultural crops are irrigated with water piped up from a deep underground aquifer. The underground reservoir is known as Wajid Aquifer.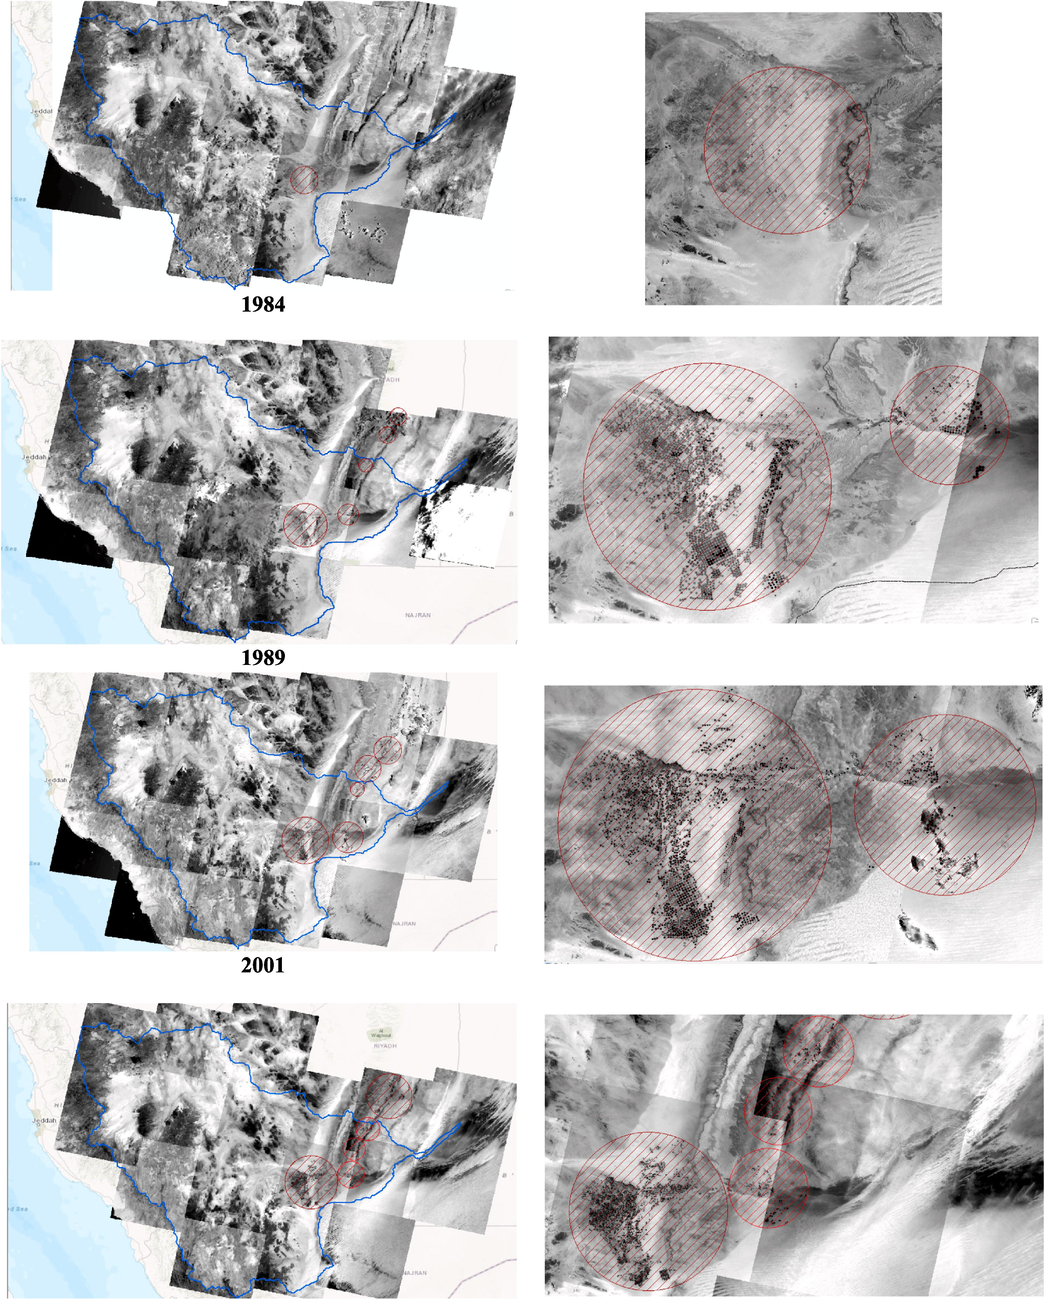
Landsat images showing the changes in the cultuvated areas of the Wadi Al Dawasir between 1984 and 2022 for the Study area.
The Wajid Sandstones consist of the Upper and Lower Wajid Sandstones, which are both permeable formations of Cambro-Permian age. These formations are separated by a lower permeable shale deposit. Their hydraulic connectivity over vast distances and their siliciclastic composition result in the formation of a regional aquifer system (UN-ESCWA and BGR, 2013).
The Wajid Aquifer provides water for the Asir-Yemen Highlands in Saudi Arabia to the Rub' al Khali Depression in Yemen. The aquifer system extends underground all the way from the Wadi Najran region to the Gulf coast in the eastern parts of the Rub' al Khali. The Sa'dah-Najran region is where the Upper Wajid is most exposed on the surface, while the Jibal al Wajid region to the north only shows the Lower Wajid. In the regions where the Upper and Lower Wajid are now exploited, their combined thickness could range from 100 to 900 m (UN-ESCWA and BGR, 2013).
The water table in this aquifer has been dropping between Wadi Dawasir-Sulayyil (Saudi Arabia) and Sa'dah (Yemen) at a rate of 6 m/yr for the previous 20–30 years. In some parts, the aquifer system has already been depleted by heavy abstraction for agricultural growth, while in others, depletion is imminent within the next 10–15 years (UN-ESCWA and BGR, 2013).
Fig. 7 shows a topographical map of the study area extracted from the ETOPO1 Global Relief Model. The research area has significant relief ranging from 310 to 2930 m. The region's relief fluctuates from more than 2000 m above the Red Sea High Hills to less than 1000 m in the Wadi's northeastern section. It then descends to less than 500 m in the eastern portion, towards the Wadi's downstream, and less than 400 m at the main channel. Streams originate in the wadi's southwest and flow downstream into the region's east. With very low rainfall rates in the southern and western parts, low surface runoff rates result in low density streams. As a result, the recharge rate is quite low. Surface water flows eastward along the wadi's main channel. First-order streams have the highest stream frequencies, which steadily decrease as the order of the stream increases (Pareta and Pareta, 2011(. The Wadi Al Dawasir has a fifth-stream order.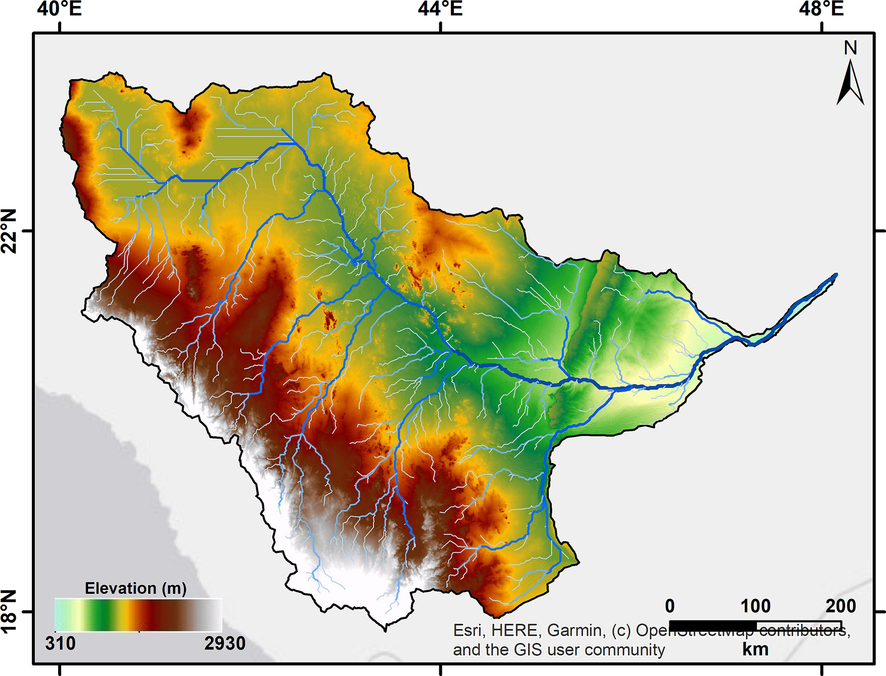
A DEM map depicting Earth's topography. In addition, the region's stream networks are represented.
Data on sediment thickness have been made available for public use by the NOAA National Geophysical Data Center (Divins, 2003). Fig. 8 reveals that the western and middle thirds of the Wadi that located over the Arabian Nubian Shield, the sediment thickness exhibits higher variability, ranging from 0 to less than 300 m. Lower-order wadis that cut through the Pre-Cambrian and Quaternary Tertiary volcanoes are present in this area. The wadi's western portion exhibits higher sediment thickness that increases from 400 to more than 2400 m close to the downstream over the sedimentary cover of the Saudi Arabia and continues to 3400 m at the wadi's main channel. The Wajid Aquifer, which is mainly made up of sandstone and poorly cemented quartz gravel conglomerate, is a significant source of water for numerous wells. It covers much of the downstream area of the Wadi.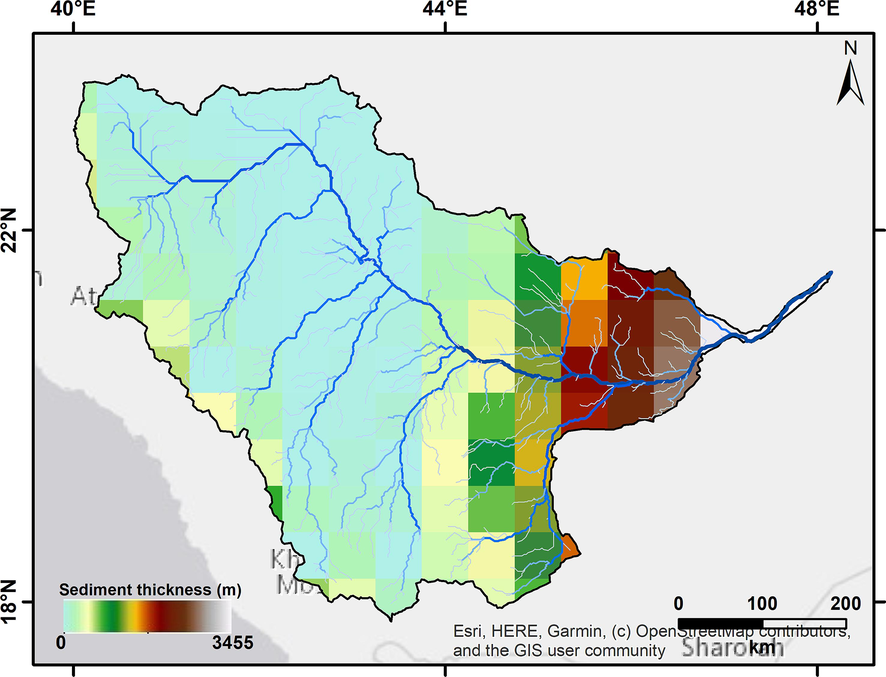
Sedimentary cover thickness and the stream networks of the Wadi.
5 Conclusion
The average annual rainfall in the Wadi Al Dawasir area is only 90.1 mm, according to satellite rainfall datasets. As a result, there is a scarcity of water at the surface. The intensive groundwater extraction rates and agricultural expansions over the previous 20 years have depleted the wadi's water supplies, as revealed by GRACE and the outputs of the climatic model. Landsat data reveals a dramatic increase in the number of large commercial farms utilizing center-pivot irrigation systems, resulting in a serious withdrawal of fresh groundwater at the downstream of the Wadi. GRACE shows a ΔGWS decrease for study region of − 0.48 ± 0.02 cm yr−1. The downstream of the Wadi is occupied by the Wajid Aquifer, that has been subjected to heavy groundwater exploitation since 1980 s. During the rainy seasons, a very small contemporary recharge takes place, but it is not compensated for by the rate at which groundwater is being withdrawn from the basin. The utilization of groundwater extraction in agriculture requires strict regulations and the Wadi's groundwater levels and quality must be continuously monitored.
Acknowledgment
This research was supported by Researchers Supporting Project number (RSP2024R496), King Saud University, Riyadh, Saudi Arabia
Declaration of Competing Interest
The authors declare that they have no known competing financial interests or personal relationships that could have appeared to influence the work reported in this paper.
References
- An integrated geophysical study for inferring the subsurface setting of water-bearing aquifers: case study at Wadi al-dawasir area. Saudi Arabia. Environ. Earth Sci.. 2016;75:1028.
- [Google Scholar]
- Al-Ahmadi, Masoud Eid; (1992) Hydrogeology of Wadi ad Dawasir Basin, South Saudi Arabia. Doctoral thesis (Ph.D), UCL (University College London.
- Scenario based regional water supply and demand model: Saudi Arabia as a case study. International Journal of Environmental Science and Development. 2015;7:46-51.
- [Google Scholar]
- Natural fracture system of the cambro-permian Wajid group, Wadi al-dawasir, SW Saudi Arabia. J. Pet. Sci Eng. 2019
- [Google Scholar]
- Groundwater recharge: an overview of process and challenges. Hydrogeology Journal. 2002;10:5-17.
- [CrossRef] [Google Scholar]
- Divins, D. Total Sediment Thickness of the World’s Oceans and Marginal Seas; NOAA National Geophysical Data Center: Boulder, CO, USA, 2003.
- Quantifying the modern recharge of the “fossil” Sahara aquifers. Geophys. Res. Lett.. 2013;40:2673-2678.
- [CrossRef] [Google Scholar]
- The use and re-use of unsustainable groundwater for irrigation: a global budget environ. Res. Lett.. 2017;12
- [CrossRef] [Google Scholar]
- Calibration of a large-scale groundwater flow model using GRACE data: a case study in the Qaidam Basin, 643 China. Hydrogeol. J.. 2015;23(7):1305-1317.
- [CrossRef] [Google Scholar]
- Extending the global mass 637 change data record: GRACE follow-on instrument and science data performance. Geophys. Res. Lett.. 2020;47(12):638.
- [CrossRef] [Google Scholar]
- Groundwater quality assessment of a multi-layered aquifer in a desert environment: a case study in Wadi ad-dawasir, Saudi Arabia. Water. 2020;12:3020.
- [CrossRef] [Google Scholar]
- Assessment and modeling of runoff in ungauged basins based on paleo-flood and GIS techniques (case study of Wadi al dawasir-Saudi Arabia) Arab J Geosci. 2019;12:483.
- [CrossRef] [Google Scholar]
- Gravity applications to groundwater storage variations of the Nile Delta aquifer. J. Appl. Geophys.. 2020;182:104177
- [CrossRef] [Google Scholar]
- Integrated geophysical assessment of groundwater potential in southwestern Saudi Arabia. Front. Earth Sci.. 2022;10:937402
- [Google Scholar]
- The groundwater flow behavior and the recharge in the Nubian sandstone aquifer system during the wet and arid periods. Sustainability. 2022;14:6823.
- [CrossRef] [Google Scholar]
- Application of time- Variable gravity to groundwater storage fluctuations in Saudi Arabia. Front. Earth Sci.. 2022;10:873352
- [CrossRef] [Google Scholar]
- Hydro-geophysical Evaluation of the Regional Variability of Senegal’s Terrestrial Water Storage Using Time-Variable Gravity Data. Remote Sens. 2022;14:4059.
- [Google Scholar]
- Mohamed, A.; Abdelrady, A.; Alarifi, S.S.; Othman, A. 2023. Hydro-geophysical and Remote Sensing assessment of Chad's groundwater resources. Remote Sens. 2022, under review.
- Integrated geophysical approach of groundwater potential in wadi ranyah, Saudi Arabia, using gravity, electrical resistivity, and remote-sensing techniques. Remote Sens. 2023;15:1808.
- [CrossRef] [Google Scholar]
- Hydro-geophysical monitoring of the North Western Sahara aquifer system’s groundwater resources using gravity data. J. Afr. Earth Sci.. 2021;178:104188
- [CrossRef] [Google Scholar]
- Towards assessment of Saudi Arabia public Awareness of water shortage problem. Journal of Resources and Environment. 2013;3:10-13.
- [Google Scholar]
- Privatization of watersupply services in Saudi Arabia: a unique experience.Util. Policy. 2014;31:107-113.
- [CrossRef] [Google Scholar]
- Quantitative morphometric analysis of a watershed of Yamuna Basin, India using ASTER (DEM) data and GIS. Int. J. Geomat. Geosci.. 2011;2:248-269.
- [Google Scholar]
- Rodell, M., Velicogna, I., Famiglietti, J. S. Satellite-based estimates of groundwater depletion in India. Nature. 2009, 645 460(7258), 999-1002. https://doi.org/10.1038/nature08238. 646 .
- The global land data assimilation system. Bull. Am. Meteorol. Soc.. 2004;85:381-394.
- [Google Scholar]
- High resolution CSR GRACE RL05 mascons. J. Geophys. Res. Solid Earth. 2016;121:7547-7569.
- [Google Scholar]
- Save, H. CSR GRACE and GRACE-FO RL06 Mascon Solutions v02. 2020. Available online: http://www2.csr.utexas.edu/grace/RL06_mascons.html.
- Ground referencing GRACE satellite estimates of groundwater storage changes 649 in the California Central Valley, USA. Water Resour. Res.. 2012;48(4):650.
- [CrossRef] [Google Scholar]
- Groundwater use for irrigation - a global inventory. Hydrol. Earth Syst. Sci.. 2010;14:1863-1880.
- [CrossRef] [Google Scholar]
- UN-ESCWA and BGR (United Nations Economic and Social Commission for Western Asia; Bundesanstalt für Geowissenschaften und Rohstoffe). 2013. Inventory of Shared Water Resources in Western Asia. Beirut.
- Improved methods for observing Earth’s time variable mass distribution with GRACE using spherical cap mascons. J. Geophys. Res. Solid Earth. 2015;120:2648-2671.
- [Google Scholar]
- Quantifying and reducing leakage errors in the JPL RL05M GRACE mascon solution. Water Resour. Res.. 2016;52:7490-7502.
- [Google Scholar]
- WWAP, W.W.A.P., 2006. Water: a shared responsibility; the United Nations world water development report 2. Paris, France.


