

Translate this page into:
Application of geoelectric methods on paleoenvironments of the Qa'el-Jufr lake, southeastern Jordan Plateau
*Tel.: +966 56 8086395; fax: +966 1 4675804 awni@ksu.edu.sa (Awni T. Batayneh)
-
Received: ,
Accepted: ,
This article was originally published by Elsevier and was migrated to Scientific Scholar after the change of Publisher.
Available online 10 August 2010
Peer-review under responsibility of King Saud University.
Abstract
Resistivity sounding measurements were conducted on the Qa'el-Jufr lake, southeastern Jordan Plateau, with the aim of mapping of Quaternary medium and establishing the role of palaeoclimate deposition. Data collected at 20 locations were interpreted with curve matching techniques and 1-D inversion program in order to obtain final earth models. The results of interpretation and calibration are used to construct litho-resistivity cross sections across the study area in light of the surface and subsurface geological information.
The inspection of litho-resistivity cross sections reveals the presence of two main alluvial sequences. The upper sediments that attain resistivities ranging from 5 to 120 Ωm and thickness ranging from 6 to 18 m are a mixture of reworked aeolian and alluvial sediments. The resistivity of this unit generally decreases south and centralwards, indicating more homogeneous fine silty sand nature of the Pleistocene sediments. The lower stratigraphic unit is the shallow sand and gravel layer saturated with fresh water. This layer is characterized by its relatively high resistivity (60–400 Ωm) and varying thickness (8–23 m) in the northern and eastern sides and by its relatively low resistivity (20–90 Ωm) and varying thickness (10–40 m) in the southern side.
Geoelectrical data analyses of Qa'el-Jufr basin provide an important record of Quaternary paleoenvironments for the Jordan Plateau and evidence of several significant changes in climate regime. Gravels, sands and clays characterizing the deepest sediments demonstrate significant lacustrine and high moisture phase. Then the sediments grade upwards to sands and silts that may represent a gradual drying of the lake and increased aeolian activity. These new records of the paleoenvironments provide an important context to the archaeological record of the Jordan Plateau during Quaternary. Several archaeological surveys demonstrate extensive human exploitation of lakes and springs of the major wadis along the western margin of the Rift Valley. However, very little is known about the human exploitation of the desert interior. Qa'el-Jufr sediments demonstrate significant lacustrine and high moisture phases sufficient for human exploitation of the eastern desert during the Pleistocene.
Keywords
Resistivity soundings
Palaeoclimate deposition
Qa'el-Jufr lake
Jordan Plateau

1 Introduction
Since there are no in situ records on the climate history of the Jordan Plateau, we resort to interpretations of climate reconstructions extrapolated from neighboring regions. Currently, reconstructions of paleoenvironments for the Jordan Plateau are extrapolated from a variety of extralocal sources including: (1) marine cores from the Mediterranean, Red, and Arabian Seas (Rossignol-Strick, 1995; Hemleben et al., 1996; Cullen et al., 2000) and (2) archaeological, geomorphological, and palynological data from the western coastal plain and Rift Valley (Niklewski and van Zeist, 1970; Bar-Matthews et al., 1997; Yasuda et al., 2000; Reshef et al., 2007). Archaeological studies on the Qa'el-Jufr in the Jordan Plateau have revealed the presence of numerous Pleistocene archaeological sites surrounding this ancient lake (Quintero and Wilke, 1998; Neeley, 2000).
In the present study, geoelectrical sounding survey was performed on 20 sites with the aims to observe, map and describe the range of difference in Quaternary playa deposits and to establish the role of palaeoclimate on sedimentary deposition.
2 Background of the area
Jordan is located on the northwestern edge of the Arabian Plate and has an area of about 96,000 km2 (Fig. 1). The landscape of Jordan is a fast semi-desert to desert plateau in the east. To the west is a mountainous region rising to a height from 800 to more than 1700 m above sea level. The Jordan Plateau roughly spans 35° 30′–37° 30′ E longitude by 29° 30′–32° 00′ N latitude. The climate of the desert region varies widely between day and night, and between summer and winter. Daytime summer temperatures may reach 40 °C, while winter nights are very cold, dry, and windy. The average rainfall is less than 100 mm annually.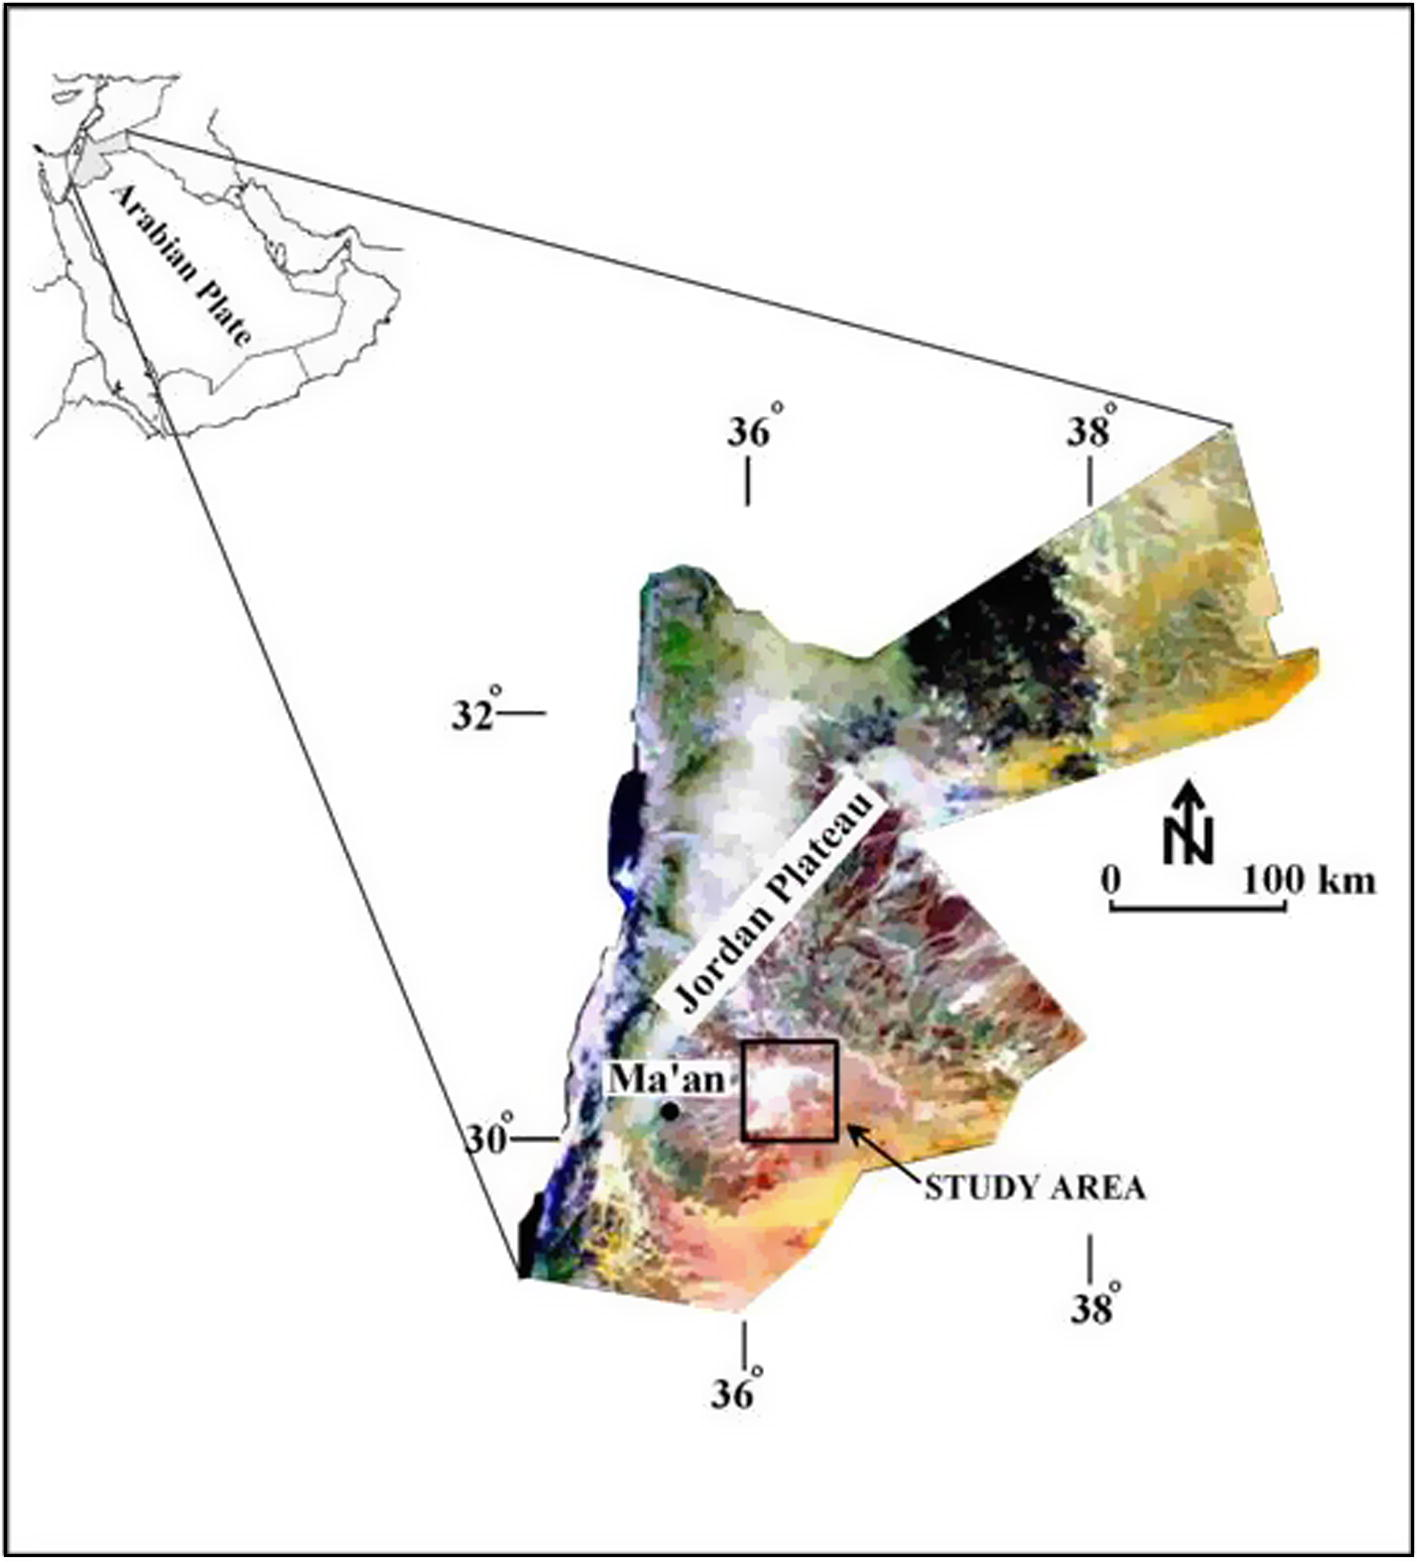
LandSAT of Jordan Plateau (35° 30′–37° 30′ E by 29° 30′–32° 00′ N) with location Qa'el-Jufr.
The Jordan Plateau is dominated by eastern gently slopping topography and numerous playa lakes (Fig. 1). In total, playas cover an area approximately equal to 40% of Jordan eastern desert. The number and size of these playa deposits are, therefore, clearly indicative of moisture past environments. The most notable of these playas is the Qa'el-Jufr, which is located about 30 km to the east of Ma'an (Fig. 1). The drainage system in the area is typically centripetal with all wadis draining into the central of the Qa'el-Jufr playa from the encircling highlands (Davies, 2005; Moumani, 2006).
1:100,000 geological map produced by the Natural Resources Authority of Jordan demonstrates that central Jordan is a part of the Late Cretaceous-Early Tertiary Arabian carbonate platform (Moumani, 2006). It is covered mainly by shallow marine carbonates that are dissected by a number of regional faults that trend E–W, N–S, NE-SW, and NW-SE. The landscape is controlled by the main valleys that trend towards the north and northeast.
The oldest rock formation that outcrops around the Qa'el-Jufr area is the Muwaqqar Chalk-Marl (MCM) formation (Maestrichtian to Palaeocene in age) which is part of the Belqa Group (Moumani, 2006). In the Qa'el-Jufr area (Fig. 2), only the upper few meters (∼20 m) thick of the formation are exposed. These mainly consist of chalky marl and marly limestone with gypsum that occur as thin bands or together with calcite in extensional joints. The presence of diverse planktonic fauna, erosional surfaces and ammonites in the MCM formation suggests that these sediments were deposited in a moderate to deep-water pelagic environment (Moh'd, 1986; Powell, 1989; Moumani, 2006).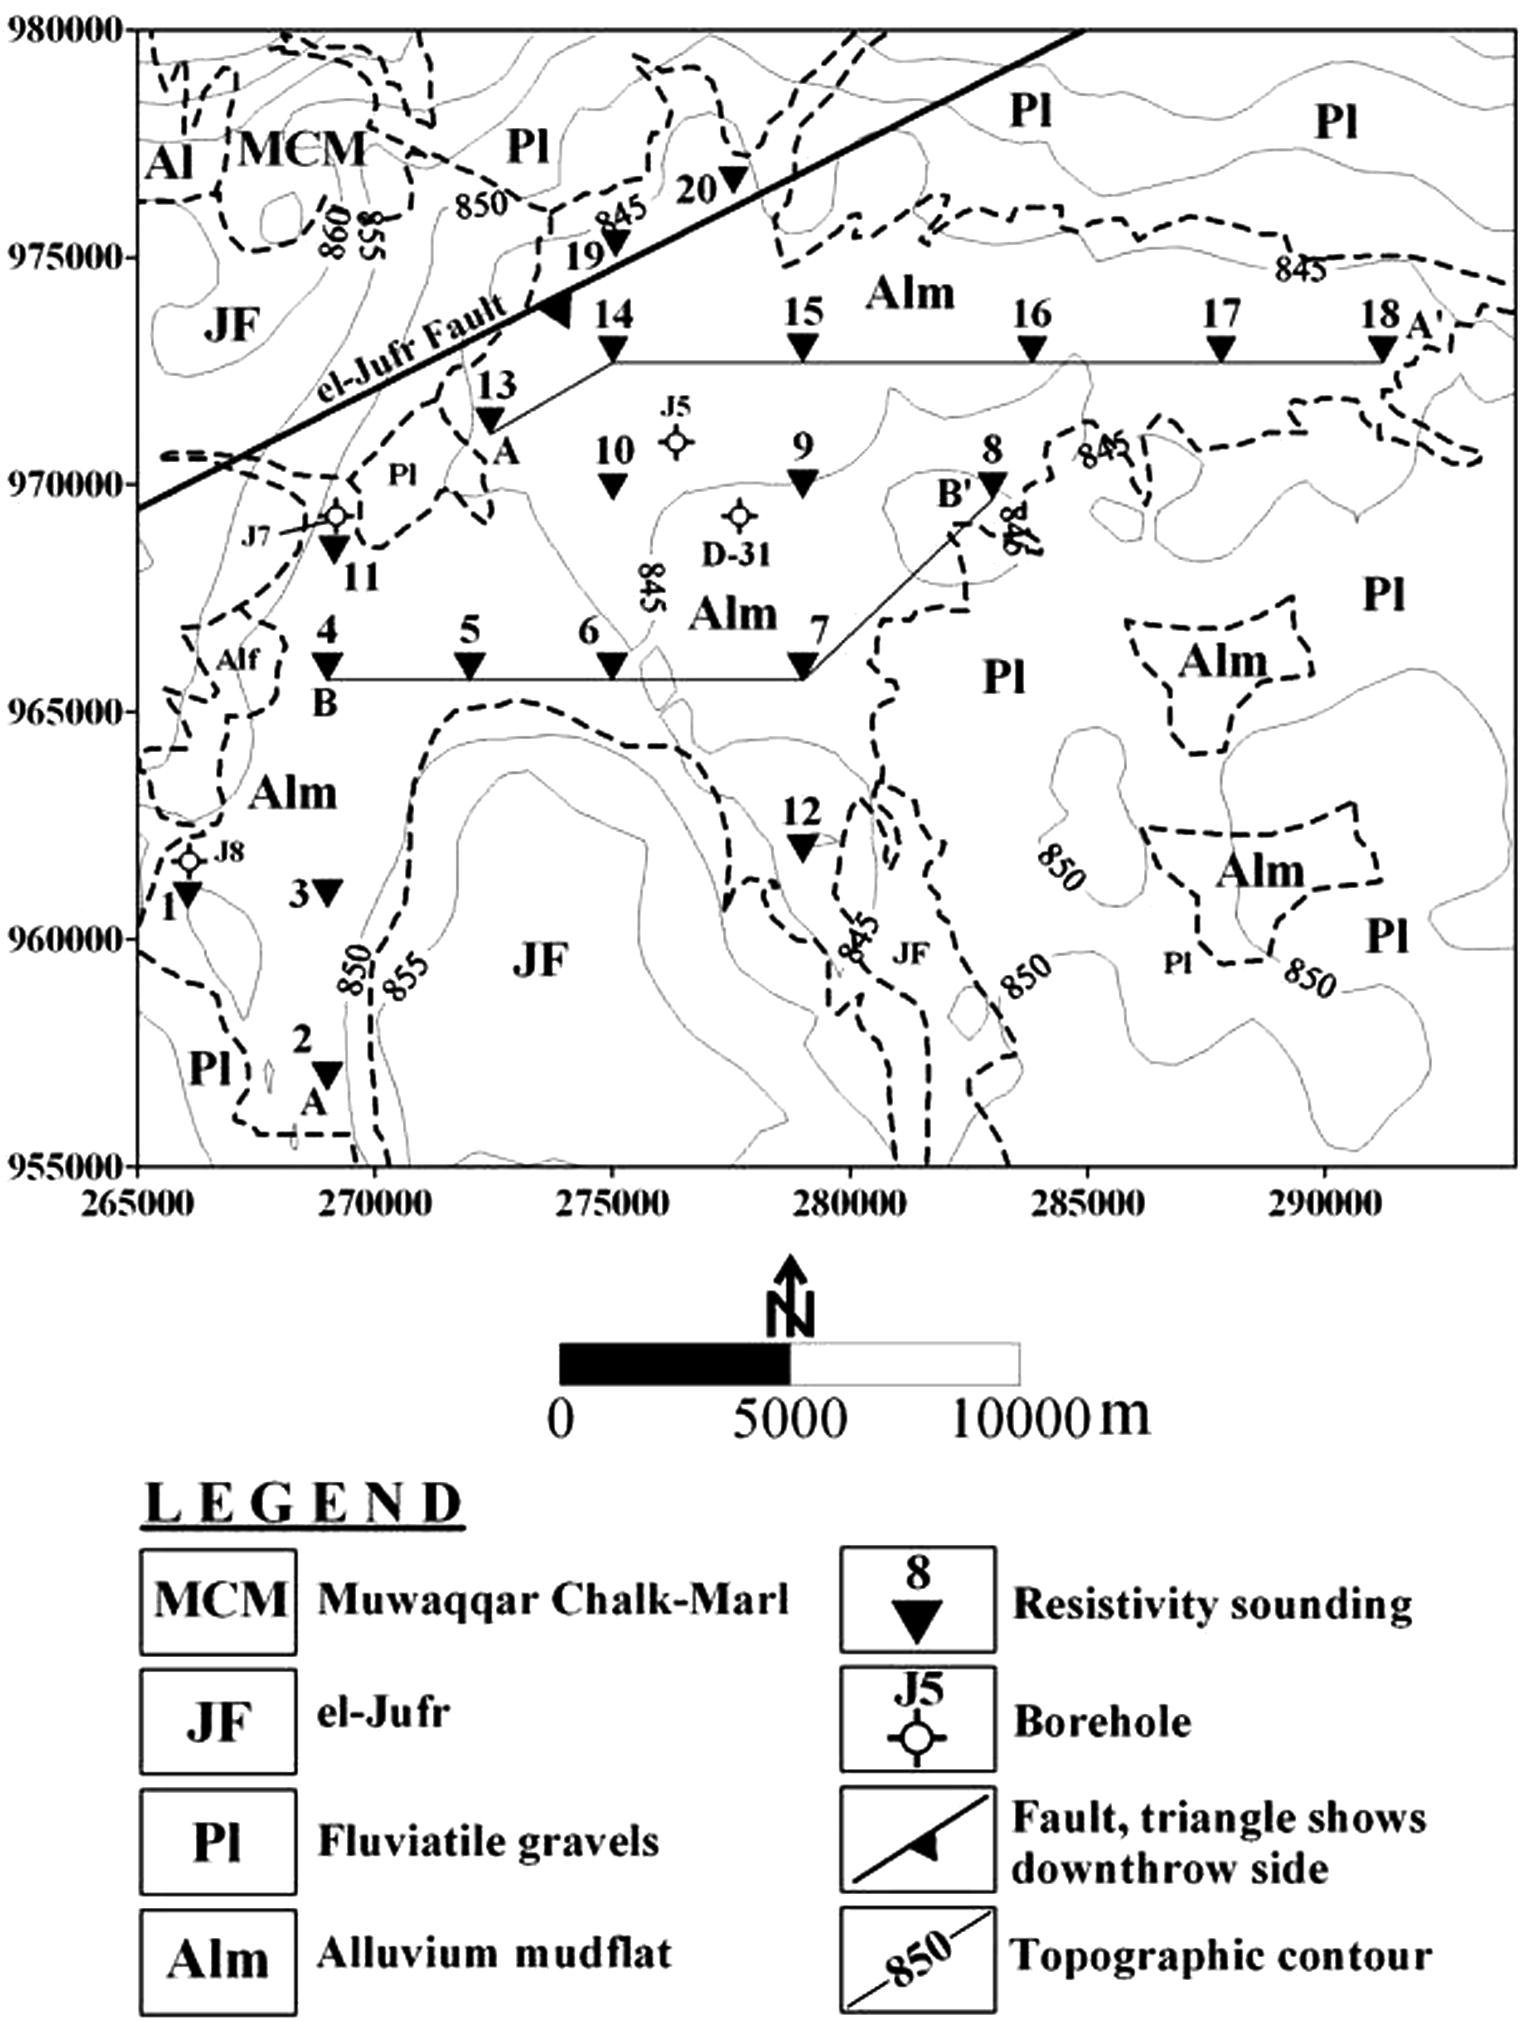
Location of geoelectrical sounding sites (black triangle) in relation to geology. Also shown is the location of two profile lines A–A′ and B–B′ and four boreholes. The elevation contours are in meters. Palestine grids are used.
The MCM formation is unconformably overlain by alluvial and lacustrine lake sediments of Qa'el-Jufr (JF) formation (Late Pleistocene in age) reaching approximately 5–8 m thick. It is mainly composed of conglomerates, marl, sand, clay, and calcrete. Surface deposits within the lake consist of unconsolidated terrestrial, aeolian, fluvial, and lacustrine sediments. The uplands surrounding the lake are characterized by expanses of a variety of highly polished desert pavement called chert hammada (Powell, 1989). The lake is rimmed on the north and northwest by eroding 50 m high limestone and chert plateau, the weathering products of which are carried towards the center of the lake. At the center of the Qa'el-Jufr, lies an evaporate basin of mudflat and gypsum.
3 Field measurements and methods of interpretation
Surface resistivity methods have been used to investigate the shallow subsurface of the geological, environmental, geotechnical, and hydrogeological problems (Ayers, 1989; Batayneh et al., 1999; Batayneh, 2004; Batayneh and Barjous, 2005; Batayneh, 2006). These methods have been widely applied over the last few decades to address the growing need for a non-invasive and cost-effective way to assist in the characterization of near-surface lithology, structures, and groundwater aquifers. The resistivity method involves measuring the electrical resistivity of earth materials by introducing an electrical current into the ground and monitoring the potential field developed by the current. The most commonly used electrode configuration for geoelectrical soundings, and the one used in this field survey, is the Schlumberger array. The array consists of four electrodes arranged symmetrically along a straight line with the outer two for current injecting and the inner two for potential measuring.
A reconnaissance field survey was applied to establish the location of the resistivity stations taking into consideration the availability of boreholes in order to calibrate the resistivity data. The localities that are characterized by the presence of salt crust, dunes, vegetations, and recent aeolian deposits were avoided. In this respect, 20 geoelectrical stations were established across the study area using a GPS positioning. The data were collected on a SYSCAL-R2 resistivity instrument (IRIS Instrument, France). The layout of the survey stations is superimposed on the geological map in Fig. 2. The half distance between the potential electrodes was increased in steps, starting from 0.5 to 40 m in order to obtain a measurable potential difference. The current electrode half separation was designed to investigate small-scale features and reveal details of the lithology setting, starting from 1.5 to 350 m.
The sounding curves were subjected to a preliminary interpretation using the partial curve matching technique (Zohdy, 1965; Orellana and Mooney, 1966). Based on this preliminary interpretation, initial estimates of the resistivities and thickness (layer parameters) of the various geoelectric layers were obtained. In a second analysis method, the layer parameters derived from the graphical curve matching were then used to interpret the sounding data in terms of the final layer parameters through a 1-D inversion technique (i.e. RESIX-IP, Interpex Limited, Golden, Co., USA).
The geoelectric resistivity of sediments is one of the most variable physical properties, especially in a very complicated sedimentological environment that dominates such lake areas. Geoelectric resistivity depends mainly on the lithology, water content and salinity and there are no sharp guidelines to interpret the lithology and/or water content from the contrast in the resistivity layers. Therefore, the ambiguities in interpretation may occur and become very necessary to calibrate the observed sounding data with the available borehole data. This enables us to assign the geoelectric units to the corresponding lithologic units and consequently put a reliable control on the interpretation of the subsurface sequence in the study area. For this purpose, data from four boreholes (Fig. 2) were analyzed and used to correlate the results of the geoelectrical surveys. These boreholes are J5, J7, and J8 (quoted from Abu-ajamieh, 1967) and D-31 (quoted from Davies, 2005). Generally, these boreholes penetrate four rock units. These units from top to bottom are: (1) a thin layer which consists of a mixture of gravel, sand and silt, (2) a silty clay layer which forms the upper main rock unit, (3) a layer which represents the water-bearing formation of sand and gravel Quaternary sediments, and (4) the last layer which represents the MCM bedrock formation, which is chalky-marl in nature. The close correlation between the borehole data and the obtained sounding models helped us to assign resistivity ranges for the various lithologic units (Table 1) and used as a tool for subsurface geoelectrical resistivity interpretation.
Borehole Fig. 2
Sediment unit
Thickness (m)
Station no.
Resistivity of units (Ωm)
Thickness of units (m)
J5
Topmost layer
0.8
65
0.8
Silt and clay
11
10
12
10.9
Sand and gravel
12
130
12
MCM formation
–
11
–
J7
Topmost layer
1.7
10
1.7
Silt and clay
12
11
5
12.05
Sand and gravel
39.5
180
40
MCM formation
–
4
–
J8
Topmost layer
0.3
385
0.4
Silt and clay
1.5
1
58
1.5
Sand and gravel
4.5
191
4.7
MCM formation
–
19
–
D-31
Topmost layer
–
77
1.4
Silt and clay
11
9
33
9.5
Sand and gravel
–
98
33.5
4 Results
4.1 Litho-resistivity units
The results from the 1-D inversion of the geoelectrical stations (Table 2) were compiled and plotted along two profile lines A–A′ and B–B′ (Fig. 2). Cross section A–A′ (Fig. 3) represents the behaviour of the northern and eastern sides of the studied area. It covers a length of approximately 20 km, extending from sounding station 13 in the west to sounding station 18 in the east. The topographic elevation along this section slopes gently downwards from west to east. The main features of the derived structure, from the surface downwards, may be summarized as follows: (1) a thin surface layer of 50–600 Ωm resistivity that is 0.3–1.3 m thick. Its resistivity increases, in general, eastwards. The resistivity of this unit is corresponding to a stratum which is mainly composed of wet to dry, fine to coarse sand and gravel in the east margin areas and becomes more silty and fine sand in the western parts, (2) a layer of 20–120 Ωm resistivity and a thickness of about 1–4 m, considered to have been caused by clayey silt layer at shallower depths and thickening westwards. The high resistivity values that dominate the eastern sites could indicate the presence of coarse sand and gravel, (3) the third geoelectric resistivity unit is interpreted as a shallow water-bearing unit sand and gravel that attains resistivity values decreasing generally westwards and varies from 70 to 420 Ωm. Its thickness increases, in general, from both the eastern and western sites towards the central sites and approximately varies from 7 to 23 m, and (4) the lowermost geoelectric resistivity unit, which dominates the study area, is characterized by its relatively low resistivity values ranging from 10 to 40 Ωm and depth, increasing centralwards, ranging from about 10 to 25 m. This unit is related to the chalky-marl MCM formation of Belqa Group of bedrock.
Station no. Fig. 2
Elevation m asl
No. of layers
Resistivity of layers (Ωm)
Thickness of layers (m)
RMS error (%)
ρ1
ρ2
ρ3
ρ4
t1
t2
t3
t4
1
852.3
4
385
58
191
19
0.4
1.5
4.45
–
2.8
2
851.0
4
30
68
128
12
0.9
13
45
–
3.7
3
851.0
4
11
29
88
18
3.2
12.8
43.6
–
2.6
4
854.2
4
43
4
93
17
0.31
17.2
27.5
–
2.9
5
851.8
4
37
5
21
6
0.34
12.8
10.5
–
1.6
6
851.5
4
11
7
17
4
3.0
9.9
34.3
–
1.3
7
848.0
4
29
18
38
4
3.0
8.0
35.0
–
4.2
8
849.2
4
290
66
1218
13
0.8
0.9
8.1
–
4.7
9
847.5
4
77
33
98
3
1.4
6
37
–
3.5
10
849.1
4
65
12
130
11
0.8
10.9
12
–
2.5
11
850.0
4
10
5
180
4
1.7
12.1
41
–
2.7
12
849.4
4
125
50
180
5
1.0
3.3
25.8
–
3.1
13
852.5
4
52
24
67
28
0.9
3.8
7.3
–
0.7
14
849.6
4
93
18
203
38
1.3
1.2
9.5
–
1.4
15
848.4
4
160
37
273
16
0.8
1.4
19.5
–
6.6
16
848.0
4
599
62
372
10
0.3
2.0
22.8
–
3.5
17
847.5
4
298
90
231
9
0.5
2.1
14.5
–
4.4
18
845.8
3
124
417
32
–
1.3
10.7
–
4.6
19
849.0
4
26
11
40
12
0.8
2.0
16.1
–
1.2
20
849.2
3
780
1774
10
–
1.5
8.3
–
6.9
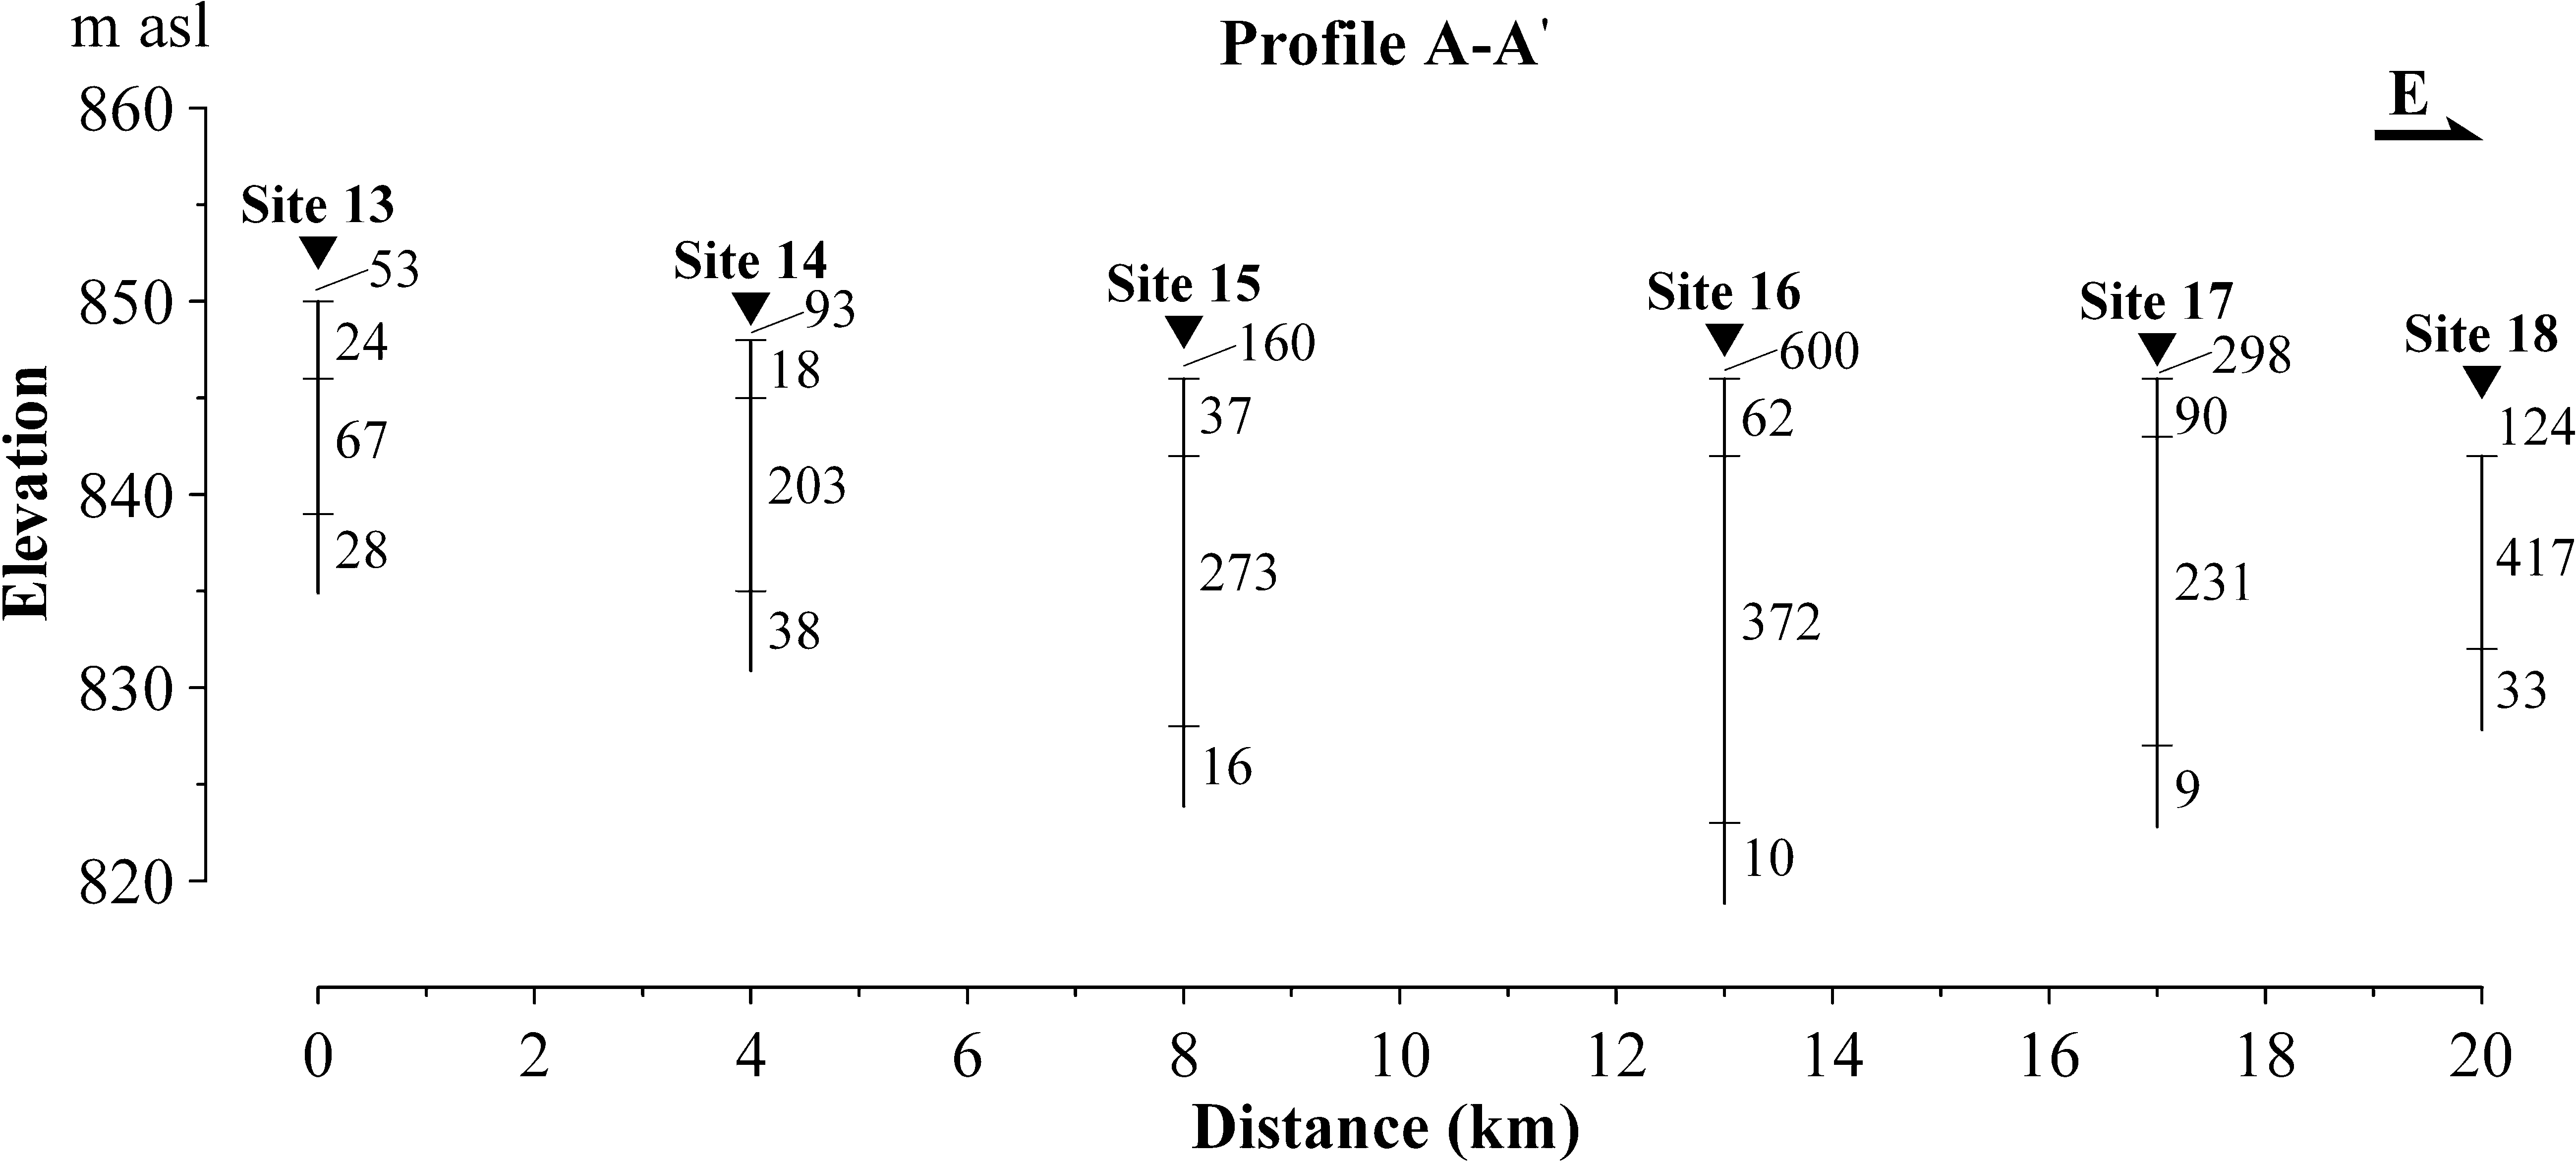
Composite geoelectrical cross section inferred from geoelectrical data along A–A′ (see Fig. 2 for profile location). Resistivities are in Ωm.
Cross section B–B′ (Fig. 4) represents the behaviour of the southern side of the studied area. The cross section covers a length of approximately 16 km, extending from sounding station 4 in the west to sounding station 8 in the east. The topographic elevation along this section slopes gently downwards from both the eastern and western sides to the middle parts. A similar structure with four layers is recognized along line B–B′ (Fig. 2), but with lower resistivity values and some interesting differences. Cross section B–B′ (Fig. 4) indicates the following layers: (1) a thin surface layer of 11–290 Ωm resistivity that is 0.3–3.2 m thick. Its resistivity decreases and its thickness increases from the margin of the playa to the central parts. The resistivity of this unit is corresponding to a stratum that is composed mainly of wet to dry, fine to coarse sand and gravel in the margin areas and become more silty and fine sand in the central parts, (2) the second geoelectric resistivity unit shows resistivity values that range from 4 to 70 Ωm and 1 to 13 m thick, and considered to have been caused by clayey silt layer at shallower depths and thickening westwards. Along the survey geoelectrical section B–B′ (Fig. 4), low resistivity values dominate the central and western parts giving an indication to more homogeneous fine sandy silt nature of the Pleistocene sediments in the central and western parts than the eastern parts, (3) the third geoelectric resistivity unit is interpreted as a shallow sand and gravel aquifer that attains resistivity values decreasing generally from both the eastern and western sides to the central parts and varies from 20 to 1200 Ωm. The low resistivity values that dominate the central parts may be attributed to either an increase in the salinity of the groundwater, clay members or the presence of thick gypsum bands, and (4) a conductive MCM bedrock formation with resistivities of 5–20 Ωm. The depth of this conductor varies along the profile from 27 to 60 m (Fig. 4).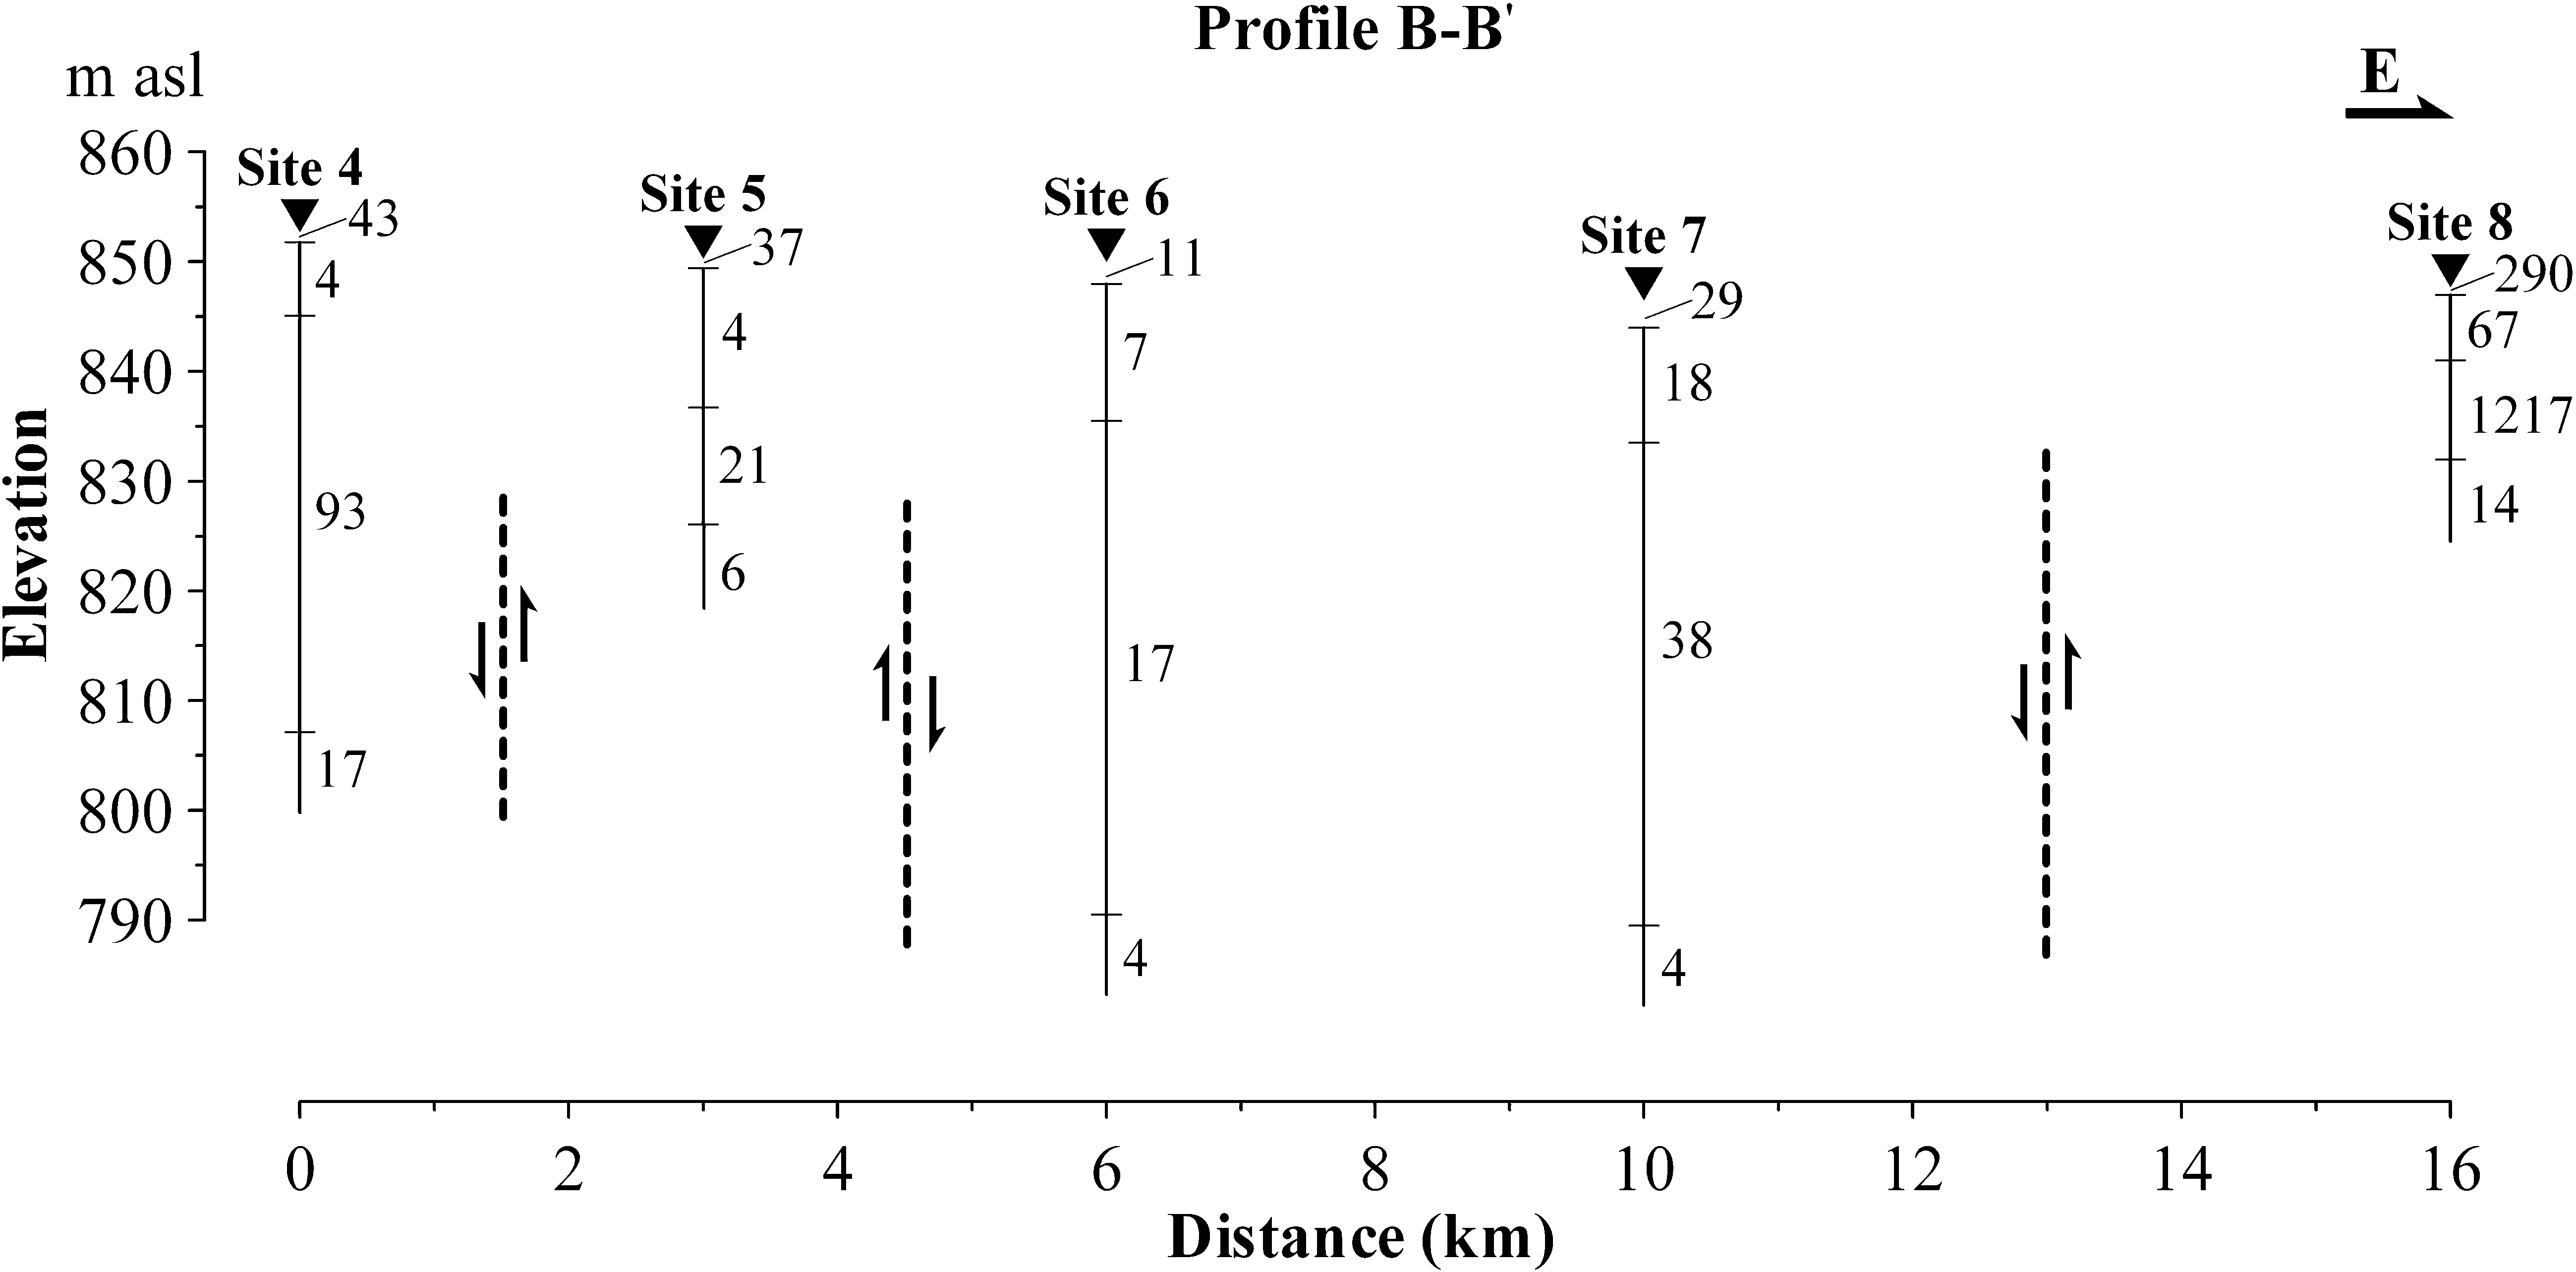
Composite geoelectrical cross section inferred from geoelectrical data along B–B′ (see Fig. 2 for profile location). Resistivities are in Ωm.
As seen from Figs. 3 and 4, the alluvial system within the Qa'el-Jufr lake can be divided into two main stratigraphic sequences having different thicknesses, lithology contents, and geological structures: (1) the upper sediment unit in the southern part of the study area is characterized by low resistivity values when compared with the northern and eastern sides (profile A–A′, Fig. 3). This decrease in resistivity values can be explained by more homogeneous and thicker fine silt and clayey sand of upper sediment unit in the southern part than the northern and eastern parts. In addition, the unit is characterized by a series of lag clays grading northwards and eastwards into silt, sand and gravel. Average recorded thickness of the upper sediment unit was found to be 2.6 m in the northern and eastern parts and a value of 9.1 m thick was recorded in the southern part (Figs. 3 and 4). It is not known whether the fine silts that dominate the upper sequence unit are indicative of current processes or indicative of an erosional surface. Today, the Qa'el-Jufr receives sediment from an extensive catchment area (approximately 150 km2) during winter flooding. However, in most months, the environment is erosional, not depositional. Currently, the net balance between sediment deposition and aeolian deflation within the basin is unknown. Other basins in the region are currently experiencing net deflation, as indicated by the widespread exposure of Neolithic and older archaeological deposits on the surface (Clark et al., 1994). It is possible that the bulk of Holocene sediments has been removed from this basin as well. (2) The lower sediment represents the water-bearing unit and mainly consists of gravels and sands grading upwards into clayey sand. Along the northern and eastern sides of the study area (profile A–A′, Fig. 3), the resistivity values of this unit increase eastwards indicating fresh groundwater and/or lag clays. The thickness of the lower unit along this line gradually increased from both the eastern and western sides towards the central parts. Its thickness varies from about 6 m in the margin to about 19 m recorded in the central parts. Relatively, low resistivity values that dominate the southern parts (profile B–B′, Fig. 4) when compared with cross section A–A′ (Fig. 3) indicate either increase of salinity of groundwater in this part or relate to strong homogeneous sediment of sand and clayey sand. These sediments grade north, west, and east into coarse sand with gravels. The recorded thickness of the lowest stratigraphic unit along profile B–B′ (Fig. 4) varies from 40 m at site 4 in the west, 10 m at site 5, 50 m at sites 6, 7, and 8 m thick at site 8 in the eastern side.
4.2 Paleoenvironmental indication
The lowest stratigraphic unit that is characterized by gravels and sands indicates more dynamic and humid environment than is currently seen within the Qa'el-Jufr basin. Abundance of clay that correlates with low resistivity values in the south central parts may reflect deposition within a deep lacustrine environment. These alluvial sequences may represent large-scale flooding events over a relatively short time period, or long-term depositional environments of higher energy due to extended periods of cooler and moisture climate. The presence of gypsum suggests a lacustrine transgression and evaporation of saline brine. It is not plausible that 40 m thick of gravel, sand and clayey sand was altered in one long episode. Several periods of pedogenesis, intense evaporation of enhanced groundwater flow, or a combination of both more likely created such thick sediments. The sediments then grade upwards to sands and silts (upper sediment unit) that may represent a gradual drying of the lake and increased aeolian activity. A dune field that may be related to such a dry phase is located along the western and northwestern margins of the playa. The upper sediments are of a mixture of reworked aeolian and alluvial sediments (Davies, 2005). The reworked sediments, as indicated by old sediment ages recorded, may be the result of deflation processes. The large dune field that dominates the western and northwestern playa margins may date to this period.
Several paleoenvironmental studies on the Jordan Plateau can be compared with the Qa'el-Jufr record. In the Wadi al-Hasa, located to the north of Qa'el-Jufr, high-energy fluvial sediments at 200,000–90,000 year B.P. or high lake stands at 70,000 and 26,000 year B.P. may correlate to lacustrine phases in the Qa'el-Jufr (Schuldenrein, 1998). In the Wadi Hisma, closest to the Qa'el-Jufr, a high-moisture period in fluvial deposits during the Middle Paleolithic may correlate to one or more lacustrine or alluvial cycles in the Qa'el-Jufr (Hassan, 1995). Moreover, rock salt from Lake Lisan, the largest and the most significant sedimentary basin in the Jordan Rift Valley, defines seven or eight moisture and dry climate between 70,000 and 12,000 year B.P (Neev and Emery, 1995).
5 Conclusions
Twenty geoelectrical soundings were conducted in the Qa'el-Jufr lake, southeastern Jordan Plateau, to provide a record of Quaternary paleoenvironments. The results indicate that there are two main stratigraphic units. The upper unit in the southern part is characterized by low (<20 Ωm) resistivity values when compared with relatively high (20–100 Ωm) resistivity values in the northern and eastern sides. This decrease in resistivity values at shallow depths can be explained by more homogeneous fine silty and clayey sand upper sequence in the southern parts. The upper sequence in the northern and eastern parts is characterized by silty sand sediments with sparse of gravels and lack of clays. These sediments are indicative of low-energy alluvial sheet wash and aeolian depositional environments.
The lower unit that corresponds to water-bearing unit of gravel and sand attains resistivity values decreasing generally from both the eastern and western sides to the central parts. Its thickness increases from both the eastern and western sides towards the central side. The low resistivity values that dominate the central parts may reflect an increase in the salinity of groundwater, abundance of clays or thick gypsum bands. These sediments are reflecting periods of higher precipitation and lower evaporation that characterize past trends.
References
- Abu-ajamieh, M., 1967. A quantitative assessment of the groundwater potential of the Rijam formation aquifer in the Jafr Basin. Natural Resources Authority, Amman, Jordan.
- Conjunctive use of geophysical and geological data in the study of an alluvial aquifer. Ground Water. 1989;27:625-632.
- [Google Scholar]
- Late Quaternary palaeoclimate in the eastern Mediterranean region from stable isotope analysis of speleothems at Soreq Cave, Israel. Quaternary Research. 1997;47:155-168.
- [Google Scholar]
- Relating geoelectric to hydraulic parameters of the B2/A7 aquifer, central Jordan. Dirasat. 2004;31:220-233.
- [Google Scholar]
- Use of electrical resistivity methods for detecting subsurface fresh and saline water and delineating their interfacial configuration: a case study of the eastern Dead Sea coastal aquifers, Jordan. Hydrogeology Journal. 2006;14:1277-1283.
- [Google Scholar]
- Resistivity surveys near a waste-disposal site in Qasr Tuba area of central Jordan. Bulletin of Engineering Geology and the Environment. 2005;64:287-294.
- [Google Scholar]
- Using the head-on resistivity method for shallow rock fracture investigations, Ajlun, Jordan. Journal of Environmental and Engineering Geophysics. 1999;4:179-184.
- [Google Scholar]
- Survey and excavation in Wadi-Al-Hasa: a preliminary report of the 1993 field season. Annual of the Department of Antiquities of Jordan. 1994;38:41-55.
- [Google Scholar]
- Climate change and the collapse of the Akkadian empire: evidence from the deep sea. Geology. 2000;28:379-382.
- [Google Scholar]
- Quaternary paleoenvironments and potential for human exploitation of the Jordan Plateau desert interior. Geoarchaeology. 2005;20:379-400.
- [Google Scholar]
- Late Quaternary geology and geomorphology of the area in the vicinity of Ras en Naqab. In: Henry D., ed. Prehistoric Cultural Ecology and Evolution: Insights from Southern Jordan. New York: Plenum; 1995. p. :23-41.
- [Google Scholar]
- Three hundred eighty thousand year long stable isotope and faunal records from the Red Sea: influence of global sea level change on hydrology. Paleoceanographic Currents. 1996;11:147-156.
- [Google Scholar]
- Moh'd, B., 1986. The geology of Wadi Al Buway'ija, Map Sheet No. 3251 IV. Geological Mapping Division, Natural Resources Authority, Jordan, Bulletin 5.
- Moumani, K., 2006. The geology of Al Jafr area. Map Sheet No. 325-I. Geological Mapping Division, Natural Resources Authority, Jordan, Bulletin 64.
- The results of a small-scale reconnaissance along the Qa'el-Jinz. Annual of the Department of Antiquities of Jordan. 2000;44:99-108.
- [Google Scholar]
- The Destruction of Sodom, Gomorrah, and Jericho. Oxford: Oxford University Press; 1995.
- A late Quaternary pollen diagram from northwest Syria. Acta Botanica Neerlandica. 1970;19:737-754.
- [Google Scholar]
- Master Tables and Curves for Vertical Electrical Sounding Over Layered Structures. Madrid: Interciencia; 1966.
- Powell, J., 1989. Stratigraphy and sedimentation of the Phanerozoic rocks in central and south Jordan: Ram and Khreim Groups. Geological Mapping Division, Natural Resources Authority, Jordan, Bulletin 11.
- Archaeological reconnaissance in the al-Jafr Basin, 1997. Annual of the Department of Antiquities of Jordan. 1998;42:113-122.
- [Google Scholar]
- The use of acoustic imaging to reveal fossil fluvial system – a case study from the southwest Sea of Galilee. Geomorphology. 2007;83:58-66.
- [Google Scholar]
- Sea-land correlation of pollen records in the eastern Mediterranean for the glacial–interglacial transition: biostratigraphy versus radiometric time-scale. Quaternary Science Reviews. 1995;14:893-915.
- [Google Scholar]
- Schuldenrein, J., 1998. Geomorphology and stratigraphy of prehistoric sites along the Wadi al-Hasa. In: Coinman, N. (Ed.), The archaeology of the Wadi al-Hasa, west-central Jordan, Volume 1: Surveys, settlement patterns and paleoenvironments. Anthropological Research Paper No. 50. Arizona State University, Tempe, AZ, pp. 205–228.
- The earliest record of major anthropogenic deforestation in the Ghab Valley, northwest Syria: a palynological study. Quaternary International. 2000;73/74:127-136.
- [Google Scholar]
- The auxiliary point method of electrical sounding interpretation, and its relationship to the Dar Zarrouk parameters. Geophysics. 1965;30:644-660.
- [Google Scholar]


