

Translate this page into:
Application of geochemical modeling using NETPATH and water quality index for assessing the groundwater geochemistry in the south Wadi El-Farigh area, Egypt
⁎Corresponding author at: Dept. of Geology & Geophysics, College of Science, King Saud Univ., P.O. Box 2455, Riyadh 11451, Saudi Arabia. salmadani@KSU.EDU.SA (Sattam Almadani)
-
Received: ,
Accepted: ,
This article was originally published by Elsevier and was migrated to Scientific Scholar after the change of Publisher.
Abstract
Groundwater quality assessment is of utmost importance for water security in arid areas, such as south of Wadi El-Farigh due to deficiency of recharge, high evaporation rates and groundwater demand for agricultural and drinking utilities. The physicochemical parameters of 25 groundwater samples were investigated. Major ion occurrence was sequenced as Na+ ˃ Ca2+ ˃Mg2+ ˃K+ and Cl− ˃ SO42- ˃HCO3 − ˃ CO3 2- . The main groundwater hydrochemical facies was the (Na++K+) (Cl− + SO42-) type. The studied samples were fresh to brackish and weakly alkaline in nature. The chloro-alkaline indices demonstrate the exchange of Ca2+ and Mg2+ in groundwater with Na+ and K+ from the rock. The water quality index revealed that 80% of samples were appropriate for drinking, 8% were classified as poor, and 12% excellent. Depending on the calculated sodium absorption ratio, the studied samples were categorized as excellent for irrigation. All samples have a good level of residual sodium carbonate. The sodium absorption ratio and electric conductivity were plotted on the diagram of U.S. salinity laboratory and revealed that the moderate and high salinity with low sodium absorption ratio values could cause a negative impact on the crops. It is concluded that, silicate weathering, ion exchange and halite dissolution are the key factors affecting the chemical composition of water in the area of interest. So, the best solution would be to cultivate crops that are resistant to high salinity.
Keywords
Groundwater
Wadi El-Farigh
Egypt
Hydrochemical analysis
Water quality
Geochemical modeling

1 Introduction
Water security for industry and society represents challenge being addressed by development plans in semi-arid and arid areas. Wadi El-Farigh area is one of the newest reclaimed regions in Egypt so, studying its hydrogeology and groundwater quality are very important for soil and crops. Hydrogeochemical models are useful for determining the different factors that control the evolution of groundwater through an aquifer. The Mass Balance Transfer Model NETPATH model (Plummer et al., 1994; El Osta et al., 2020; Gomaa et al., 2020) is mainly used for calculating the mass transfer reaction between groundwater and the aquifer rock matrix along the flow-path.
Groundwater along a flow-path can be assessed by comparing ion activity and solubility products in a state of saturation and groundwater mineralization. This study is oriented to evaluate water security in this area by determining the groundwater geochemistry, water quality index along the flow-path using NETPATH software. The study covers a newly reclaimed area westward of the Nile Delta between longitudes 30°38′ and 30°53‘ E and latitudes 30°05‘ and 30°22‘ N (Fig. 1a). The area comprises a grid of wells, as in 2016, a drilling company drilled many wells in a grid with spacing 100 feddan between each.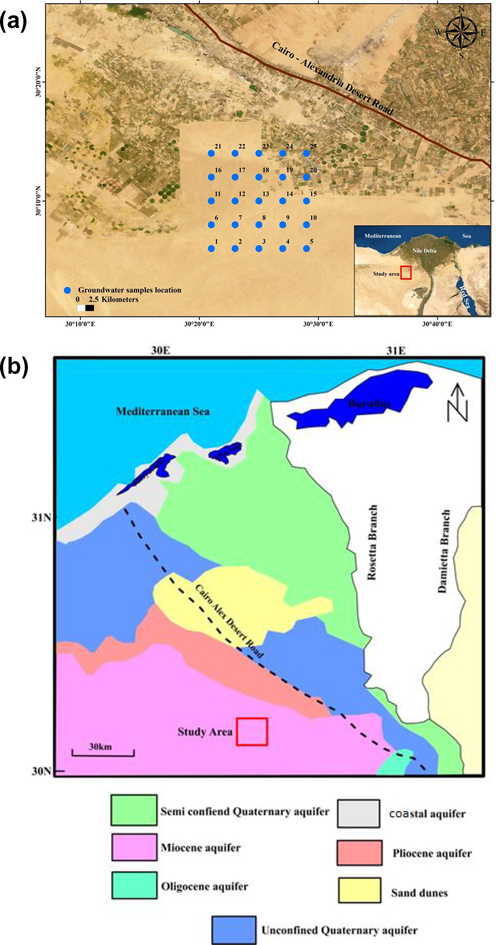
A) Location map of the study area, b) Groundwater aquifers in the western Nile Delta (modified after RIGW and IWACO, 1991).
2 Geological setting
The sedimentary succession ranges from the Late Tertiary at 750 m depth to the Quaternary at 300 m in age. Faults with NE-SW and NW-SE trends form essential structural features. Fluvial and lacustrine sediments of Nilotic sands and gravels are the primary deposits of the Pleistocene strata. Shallow marine and brackish water deposits with a thickness of about 45 m that mainly consist of mild green sandstone with fossiliferous limestone underlain by darkish gray clay signify the Pliocene strata. Moreover, a huge area from the Northwestern desert is enclosed by Miocene sediments. These sediments extend from the neighborhood of Wadi El Natrun westward to the Libyan borders. El Moghra Formation represents the Miocene rocks, which essentially consist of gravel, sandstone, and sand with clay interbeds, silicified wood, and vertebrate remains (Said, 1962). The Oligocene strata is ∼390 m think. Lenses of sand in clay are created in the middle and lower parts while basalt form the upper part.
3 Groundwater hydrology
Wadi El-Farigh area is located westward of Nile Delta aquifer (Fig. 1b). The Miocene aquifer is placed in the depression of Wadi El-Farigh in the west and south of Wadi El Natrun, which is ∼100 m thick. The general trend of the groundwater movement is from all directions to the depressions. The recharge is from the Nile Delta’s southern part. Furthermore, faults play a significant role as connecting agent between the different aquifers.
4 Materials and methods
In December 2017, 25 groundwater samples were gathered from different boreholes for chemical investigation. During the sampling process, the temperatures of the samples were recorded at depth and electric conductivity using CLT equipment. Unacidified samples were gathered in 200 ml polyethylene bottles. Analysis of major cations (Na+, K+, Ca2+, and Mg2+), anions (Cl−, SO42−, HCO3−), and minor ions, such as silica (SiO2), nitrate (NO3–) and phosphate (PO43−), were carried out. Geochemical results were plotted on Gibbs diagram (Gibbs, 1970) and Piper plot (Piper, 1944) to create the controlling mechanism for water chemistry as well as hydrogeochemical facies of the collected samples. The Gibbs diagram clarifies the mechanism through the groundwater chemical composition. It involves the connection among of the total dissolved solids (TDS) and Cl-/ (Cl- + HCO3–) or Na+/ (Na+ + Ca2+) where distinguished into three fundamental procedures, such as rock-weathering, precipitation, and evaporation can be inferred.
Such investigations can be conducted through different chloro-alkaline indices, CAI-1 and CAI-2, and at the end, these can be employed by many experts to outline the techniques of base ion exchange that manage the hydrochemical facies of groundwater (Toumi et al., 2015). The following formula is used to calculate chloro-alkaline indices (CAI) as in Eqs. (1) and (2):
Negative values indicate the exchange of Mg2+ and Ca2+ in water with Na+ and K+ ions from rocks that reflect subsidiary exchange, which known as a cation–anion exchange reaction. While positive values illustrate the variation of Na+ and K+ ions of water with Mg2+ and Ca2+ ions of rocks. The origin of the groundwater was defined based on different hydrochemical indices, such as Cl/HCO3, Mg/Ca, and the cationic exchange value (CEV) = {Cl– (Na + K)}/Cl. For calculating water quality index (WQI), firstly, the weight of each groundwater sample was assigned (wi), and then, a quality scheme (qi) and relative weight (Wi) were computed. Wi has been specified for TDS, EC, pH, Na+, K+, Mg2+, Ca2+, Cl−, HCO3−, SO42−, PO43−, NO3 − and F−, and Wi was estimated from Eq. (3) (Rabeiy, 2018).
The Wi values for different groundwater parameters were computed as;
The measured concentrations of the parameters (ci) were considered to estimate qi according to the WHO (2011) standard for drinking activities. The calculation of qi was built on Eq. (4) (Rabeiy, 2018).
Then, as illustrated in Eq. (3), WQI was computed using the estimated qi and Wi.
The calculated WQI was finally verified with the WQI range (Sahu and Sikdar, 2008) to categorize the water type in the studied area. Then, a WQI map was developed using ESRI ArcGIS version 10. The method used for interpolating data is the Inverse Distance Weight (IDW) method. The drinking groundwater was interpreted according to Davis and Dewiest (1966) and WHO (2011). Various concepts must consider, such as sodium percentage (%Na), sodium adsorption ratio (SAR), residual sodium carbonate (RSC), permeability index (PI), and United States Salinity Laboratory Diagram (USSL) classification during determining the groundwater quality and their appropriateness for agricultural activities. NETPATH software (Plummer et al., 1994) is a valuable tool in order to simulate the net geochemical mass-balance reactions along the hydrologic flow-path from upstream towards downstream. This software helps to calculate the mmol/kg H2O of relevant minerals that enter (dissolution) or leave (precipitation) the solution. Five profiles were created along the flow-path (Fig. 2). Generally, the flow direction in the studied aquifer was from south to north. The constrains were calcium, carbon, sodium, magnesium, sulfur, chloride, potassium, and silica, while the phases were kaolinite, calcite, dolomite, sodium chloride, illite gypsum, SiO2, and Na2SO4.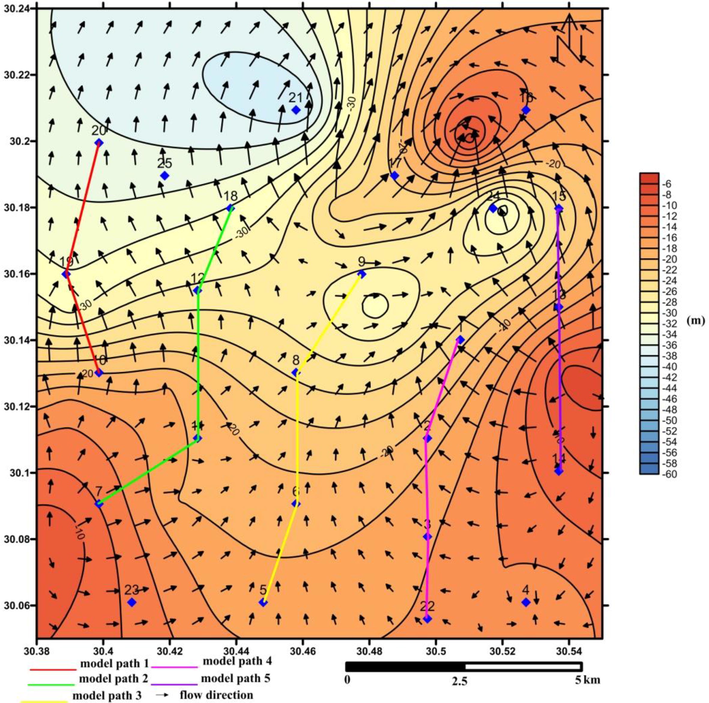
Water table map with the flow direction and model paths in the studied area.
5 Results and discussion
5.1 General groundwater chemistry
Table 1 illustrates the different statistical constraints of the investigated groundwater samples. The pH value varied from 7.16 to 7.6, with a mean value of 7.3, indicating the sample’s weak alkaline nature (Table 1). pH values between 6.5 and 8.5 are permitted in agreement with WHO standards. EC results varied from 428 to 1946 μS/cm with a mean value of 1041.3 μS/cm. The substantial changes in EC were as a result of the prevailing geochemical procedures in the studied area. The values of TDS varied from 308 to 1294 mg/l, with a mean of 710.9 mg/l. Human activities and prevailing geochemical processes Wadi El-Farigh reflect the high variation in TDS. Depending on the classification of TDS (Hem, 1989), it was found that 12% of the studied samples were brackish water, (TDS ˃1000 mg/l) and 88% were freshwater (TDS < 1000 mg/l). The major ions occurrence is
Parameter
unit
Minimum
Maximum
Mean
Standard Deviation
WHO 2011
Weight(wi)
Relative Weight (Wi)
pH
–
7.16
7.6
7.3
0.12
6.5–8.5
4
0.102564
EC
µS/cm
428
1946
1041.3
438.6
1000
4
0.102564
TDS
mg/l
308
1294
710.9
274.3
500
5
0.128205
Na
mg/l
43
280
146.4
73.6
200
3
0.076923
Ca
mg/l
23
120
49.6
21.4
75
2
0.051282
Mg
mg/l
10
35
20.8
8.6
50
2
0.051282
K
mg/l
5.8
11
8.08
1.29
12
1
0.025641
HCO3
mg/l
140
275
212.7
32.2
120
3
0.076923
Cl
mg/l
30
475
197.08
129.8
250
1
0.025641
SO4
mg/l
40
140
76.08
28.6
250
3
0.076923
NO3
mg/l
0.24
6.23
0.87
1.16
50
5
0.128205
PO4
mg/l
0.26
0.4
0.34
0.03
10
1
0.025641
F
mg/l
0.18
0.5
0.27
0.08
1.5
5
0.128205
SAR
–
0.63
3.36
1.53
0.65
RSC
meq/l
−4.27
1.06
−0.71
1.31
CAI 1
meq/l
−1.62
0.12
−0.39
0.51
CAI 2
meq/l
−0.53
0.24
−0.17
0.20
Na+ ˃ Ca2+ ˃Mg2+ ˃K+ and HCO − ˃ Cl− ˃ SO 2-.
When the chloro-alkaline indices were calculated it was noticed that the values of CAI 1 varied from −1.62 to 0.12, with average of −0.39, while CAI 2 ranged between −0.53 and 0.24, with an average of −0.17 (Table 1). Negative values were noticed for 84% of the collected samples, reflecting an indirect base-exchange reaction, which means that Ca2+ and Mg2+ from water are substituted by Na+ and K+ in the rock. About 16% of the samples had positive values, which reveals a direct base-exchange reaction. Results of the chloro-alkaline indices reflect the essential process governing the chemical composition of the groundwater was ion exchange at south of Wadi El- Farigh area.
5.2 Correlation matrix
A strong positive correlation was noticed between EC and TDS where electric conductivity increases with increasing the concentration of dissolved constituents in water. The EC and TDS also demonstrate a very positive correlation with Na+, Ca2+, Mg2+, Cl−, SO42−, HCO3−, and K+, signifying their contribution by mineralogical impact to significant geochemical procedures (Tay et al., 2017). Strong correlation has been noticed between Na+ and Cl− (0.96) and a good correlation between Mg2+ and Cl− (0.78), which is attributable to evaporate dissolution (Table 2). The high correlations between Cl− and SO4 2− (r = 0.78) and Mg2+ and Cl (r = 0.78) reflect the impact of human activities such as use of fertilizer, animal wastes and farming activity. Numbers in bold show good correlation.
pH
Ec(µS/cm)
TDS
Na
Ca
Mg
Cl
SO4
HCO3
K
NO3
PO4
F
SAR
RSC
pH
1
Ec(µS/cm)
0.476088
1
TDS
0.486087
0.995151
1
Na
0.449827
0.980017
0.974508
1
Ca
0.420183
0.803258
0.835018
0.710209
1
Mg
0.326728
0.783254
0.794979
0.714974
0.680395
1
Cl
0.424597
0.977912
0.98074
0.960512
0.814704
0.781447
1
SO4
0.460546
0.883396
0.870281
0.853282
0.728838
0.645323
0.78463
1
HCO3
0.604786
0.725647
0.75512
0.681787
0.676448
0.661066
0.639388
0.719064
1
K
0.471868
0.927018
0.936432
0.919644
0.765571
0.746667
0.918632
0.799012
0.710325
1
NO3
0.232895
0.253213
0.183876
0.313769
−0.18092
−0.06192
0.15917
0.335855
0.041241
0.087961
1
PO4
0.597846
0.55928
0.566
0.563651
0.366441
0.496646
0.522486
0.424476
0.646017
0.628205
0.151779
1
F
0.611916
0.517838
0.518959
0.525646
0.402129
0.22508
0.450223
0.580031
0.543261
0.407667
0.276205
0.434211
1
SAR
0.420375
0.829503
0.802803
0.908856
0.39069
0.448371
0.787214
0.725476
0.531215
0.755684
0.565916
0.5352
0.551598
1
RSC
−0.27789
−0.79156
−0.81208
−0.69582
−0.917
−0.83468
−0.83485
−0.65817
−0.51013
−0.74694
0.198814
−0.30948
−0.23269
−0.34
1
5.3 Estimation of ionic relationships
The mechanism of salinity and saline intrusion in arid and semi-arid areas can be assessed through the Na-Cl relationship (Sami, 1992). A good matching was illustrated between Na+ and Cl− (Fig. 3a). A relationship between Ca + Mg-(SO4 + CO3 + HCO3) and Na-Cl was applied to illustrate the source of excess Na was plotted (Fig. 3b). Results indicate a good linear correlation (R2 = 0.81) with a slope of −0.8. The relationship in (Fig. 3c) displays the weathering of silicate is a momentous agent in identifying the chemical composition of groundwater. A relationship was found between Na+ and Ca + Mg (Fig. 3d). A positive relationship between Na+ and SO2− (Fig. 3e) revealed that the weathering of Glauber’s salt (Na2SO4.10 H2O) is an alternative source of excess Na+. A positive correlation between Ca and SO4 (Fig. 3f) reflects the prevalence of gypsum.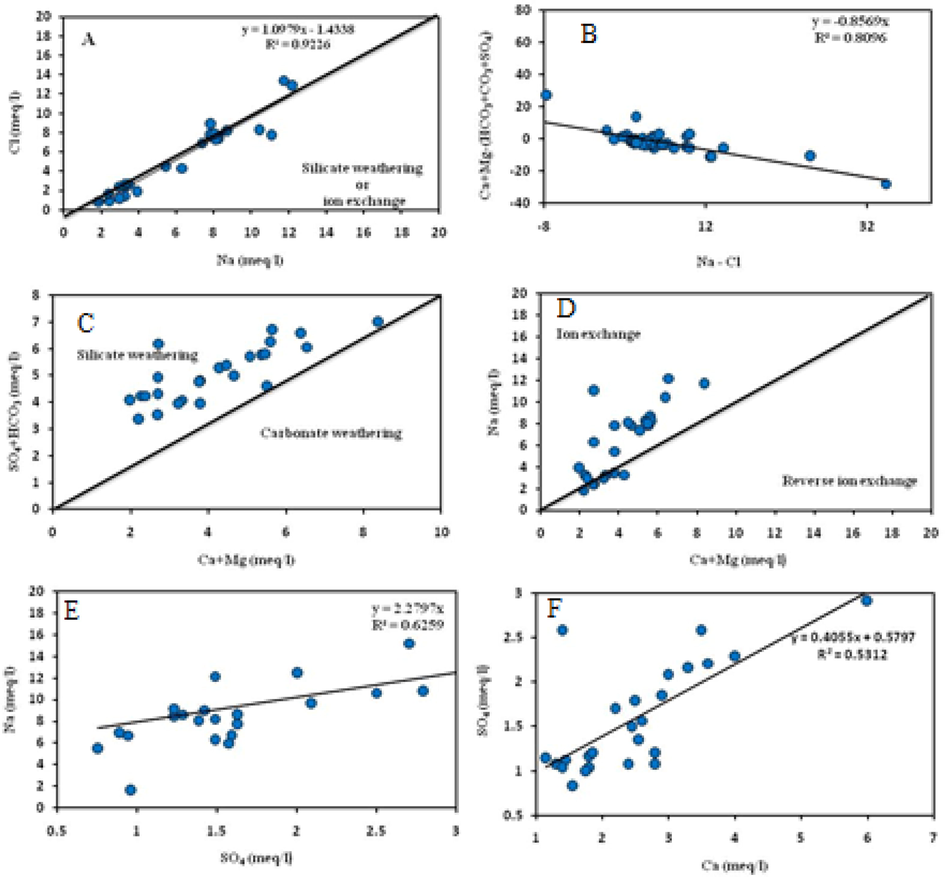
Different ions relation plots for the studied groundwater samples.
5.4 Hydrogeochemical types
Plotting the analyzed samples though Piper diagram indicated that (Na + K) alkali metals exceeded the (Ca + Mg) earth elements and the supremacy of strong acid (Cl− and SO42−) above the weak acid (HCO3− and CO32−) (Fig. 4). About 56% of the samples were of similar hydrochemical type of (Na + K) – (Cl + SO4), about 20% were (Na-K- HCO3) type while 16% were Ca2+–Mg2+–Cl−–SO42− type and about 8% were the water type of Ca2+–Mg2+– HCO3−. By plotting the chemical analysis in the Gibbs diagram (Fig. 5) it is indicating rock weathering controlling the groundwater chemistry.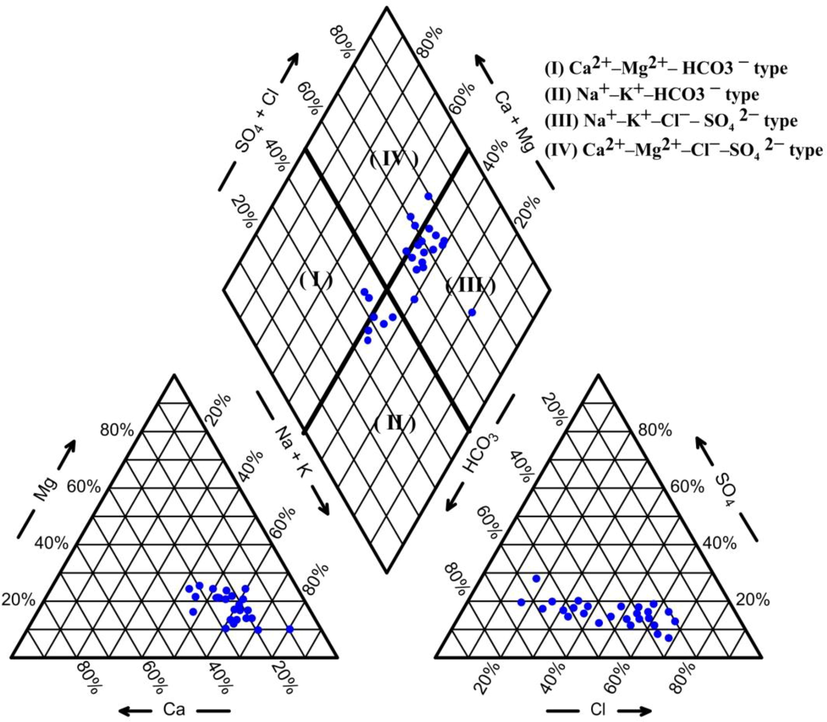
Piper trilinear diagram showing the identified hydrogeochemical types.
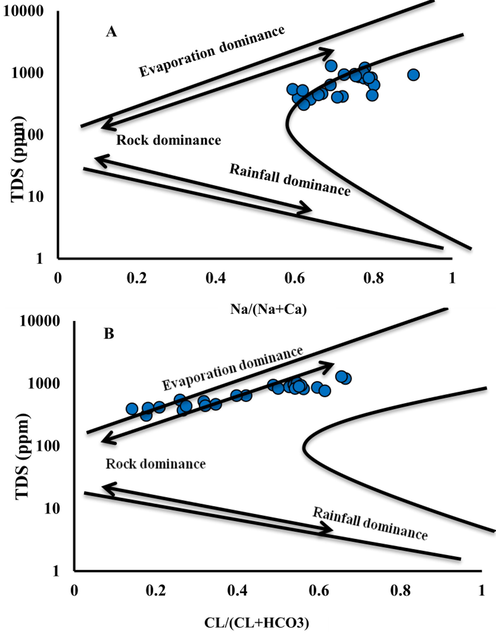
Gibbs diagram for the groundwater samples. a Cationic. b Anionic.
5.5 Determination of the origin of groundwater
The investigated water samples had Cl- /HCO3– levels from 0.28 to 3.42, with an average of 1.53, indicating an inland origin for all the samples. The Mg/Ca ratio ranges from 0.35 to 1.31, with a mean value of 0.71. Values close to 3.7 reflect groundwater of marine origin, but all the studied samples were from inland, with values of Mg/Ca less than 3.0. A CEV value near to zero, either positive or negative, indicates low-salt inland waters, whereas seawater should range from +1.2 to +1.3. Values of CEV range from −1.6 to 0.12, with a mean value of −0.39, which indicate an inland water origin.
6 Water quality for drinking and irrigation utilities
6.1 Drinking water quality
The TDS groundwater classification (Davis and Dewiest, 1966) was carried out to assess the appropriateness of groundwater for household and agricultural usage. Depending on the values of TDS, it is concluded that only 32% of the samples were fit for drinking; 56% allowable for drinking activities, and 12% are considered appropriate for irrigation. Results of nitrate concentration indicate that all the samples did not exceed the WHO limit for nitrates in drinking water, which is ∼10 mg/l, which means that all the studied samples are appropriate for drinking.
The estimated water quality index is illustrated in Table 3. It illustrates that 80% of the studied samples were described as good quality water, 8% were classified as poor-quality water, and 12% were excellent (Table 3). The WQI map illustrated that most of the water samples had a WQI less than 100 mg/l and were appropriate for drinking (Fig. 6a).
Sample
WQI
Type of water
1
67
Good water
2
85
Good water
3
107
Poor water
4
82
Good water
5
80
Good water
6
91
Good water
7
91
Good water
8
97
Good water
9
49
Excellent water
10
73
Good water
11
83
Good water
12
91
Good water
13
68
Good water
14
117
Poor water
15
63
Good water
16
59
Good water
17
53
Good water
18
46
Excellent water
19
51
Good water
20
50
Good water
21
41
Excellent water
22
82
Good water
23
87
Good water
24
52
Good water
25
50
Good water
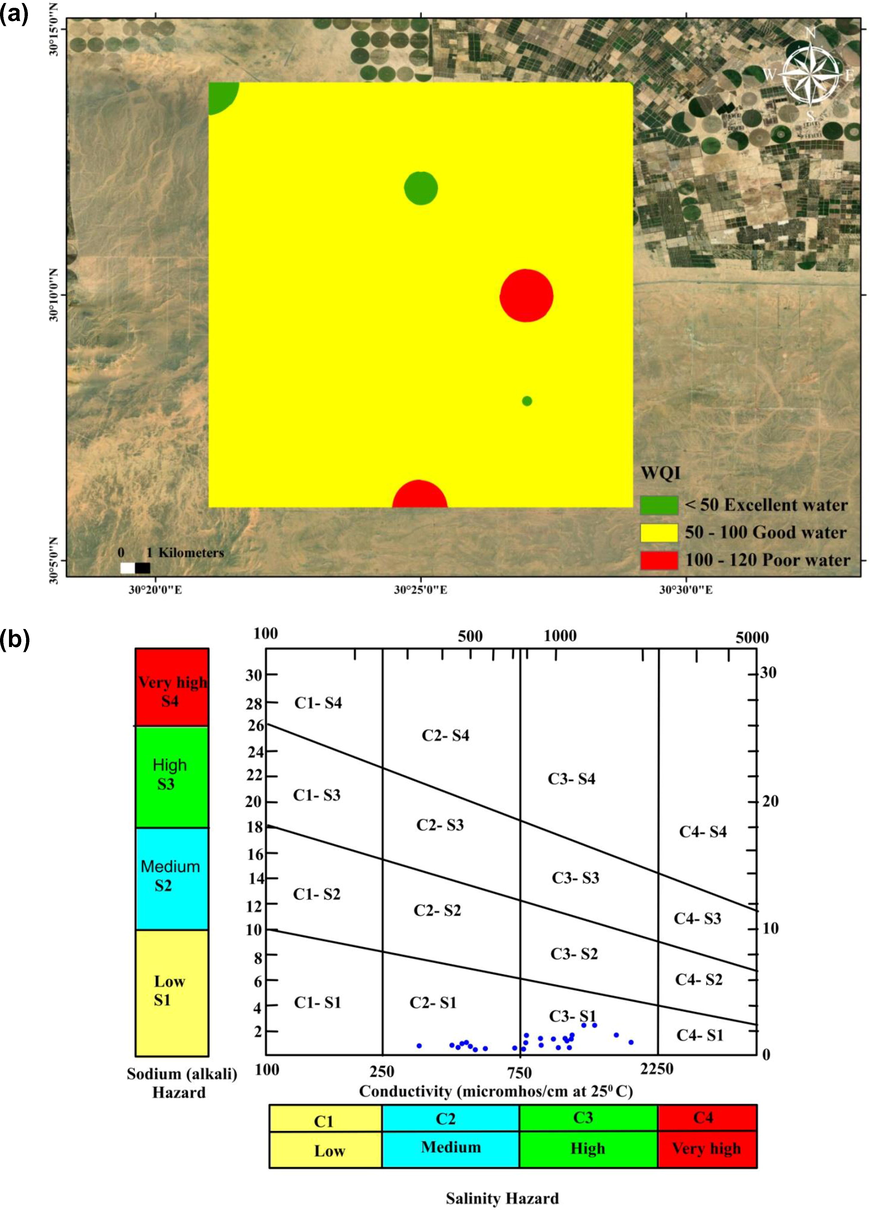
a) Water Quality Index map in the study area, b) USSL classification of groundwater samples in the study area (after Richards, 1954).
6.2 Irrigation water quality
The permeability of soil decreases as the Na+ percent becomes higher than the Ca2+ and Mg2+ concentrations, which negatively effects the growth of plants (Richards, 1954; Wilcox, 1955). It was noticed that the Na% ranges from 43.29% to 80.34%, with an average of 58.30%, with 60% of the studied samples at a permissible level for irrigation and 40% being doubtful. The environmental threats of sodium associated with water origin for irrigation can be clarified through measuring the sodium adsorption ratio (SAR). Determination of the alkali/sodium threats to crops was revealed that the SAR ranges between 0.63 and 3.36, with an average of 1.53. Depending on the Richards (1954) scheme, all the investigated samples were excellent for irrigation activities.
The outcomes of the irrigation water classification are shown by plotting SAR against EC values in the U.S. Salinity Laboratory diagram (Fig. 6b), where most of groundwater samples (64%) are fall in the field C3-S1, reflecting low sodium and high salinity, which are appropriate for irrigation for almost soil types, with little danger of transferrable sodium (Hem, 1989). However, ∼36% fall into the field of C2-S1, which is considered by low sodium (S1) and medium salinity (C2). This water type could be applied for the irrigation of majority plants for all soils if a modest quantity of leaching exists. The groundwater for two classes has no impact on soil infiltration and requires no additional effort, such as adding calcium, to enhance soil properties, but high salinity values have a negative effect on plant growth. Therefore, the best solution would be to grow crops that are highly resistant to salinity.
6.3 Hydrogeochemical modeling with NETPATH
Different geochemical models using NETPATH were conducted using hydrogeological, geological, and hydrogeochemical analysis to simulate groundwater evolution along flow-paths. Five models were recognized based on the flow direction of groundwater for 2017, as shown in Fig. 2. Consistent with the geochemical model, it was decided that silicate weathering, ion exchange, and halite dissolution are represent the main agents affecting the chemistry of groundwater. The ion exchange process led to a growth of Na concentration and a decrease in Ca and Mg concentration in solution, that increase the salinity of water. The degree of water saturation regarding carbonate and gypsum minerals decreased, which is clarified by the results of the saturation states of the pertinent minerals of the samples that are unsaturated in terms of gypsum, dolomite, and calcite minerals. Clay minerals, such as kaolinite and illite, were precipitated in the collected groundwater samples (Table 4), subsequent from the washing process of clay interbeds of the Miocene aquifer. The dissolution of Glauber mineral in water (Table 4) is another source for increasing Na in water, which was, in turn, confirmed from the ion relations.
Phase
Model 1
Model 2
Model 3
Model 4
Model 5
kaolinit
−2.2911
−0.0760
−0.06384
−0.00952
−0.01926
NaCl
5.5398
1.4131
2.87919
1.61062
0.22585
calcite
0.4032
1.04563
0.20433
2.85673
0.46164
dolomite
0.4785
0.01574
0.03377
0.36855
0.16883
gypsum
0.9175
0.38031
−0.06319
3.07520
−0.49245
illite
−0.0642
−0.06407
−0.02992
−0.00860
−0.01707
Na2SO4
0.6321
0.81814
0.08415
2.72113
0.64869
SiO2
−0.02153
−0.15208
−0.12768
−0.05125
−0.01073
CO2 gas
0.0563
0.97752
0.16351
3.67034
0.20293
7 Conclusions
Hydrochemical analysis on 25 water samples specified that the groundwater is fresh to brackish, with weak alkalinity. Depending on the calculated CAI 1 and CAI 2, it was noticed that 84% of the analyzed samples reflect an indirect base-exchange reaction, which confirms the ion exchange is a vital agent that affect the groundwater chemistry, while 16% of the samples give positive values. The sequence of the major ions was arranged as Na+ ˃ Ca2+ ˃ Mg2+ ˃ K+ and Cl− ˃ SO42− ˃ HCO3− ˃ CO32−. The predominant hydrochemical properties of groundwater were the (Na++K+) (Cl− + SO42-) type. Gibbs diagram illustrated that rock weathering and evaporation were the main agents controlling groundwater chemistry in Wadi El-Farigh area. Consistent with the calculated hydrochemical indices Mg/Ca and Cl/HCO3 and the cationic exchange value (CEV), it was clarified that the groundwater samples are of inland origin.
Evaluation of groundwater samples according to WHO (2011), reveals that 88% of the samples are appropriate for drinking utilities and the concentration of nitrate not exceed 10 mg/l in all samples. From the results of calculating water quality index it can be inferred that 80% of the samples are of good water type for drinking utilities, 8% are in poor class and 12% are in the excellent class. None of the samples are located in the unsuitable water type class. The evaluation of the groundwater for irrigation purposes was determined from Na%, SAR, RSC, PI and USSL plot which illustrate that all the studied samples are appropriate for irrigation utilities but the high salinity values can have bad effect on growth of plant. Therefore, the preferable solution will be to grow crops that are highly resistant to salinity. Results of geochemical modeling for groundwater of the Miocene aquifer reveal that the water is under saturated with respect to gypsum, calcite and dolomite and overestimated with kaolinite, illite along the flow paths. Silicate weathering, ion exchange and dissolution of halite processes are the main geochemical processes that control the chemical composition along groundwater flow-paths.
Acknowledgements
The authors extend their appreciation to the Deputyship for Research & Innovation, “Ministry of Education” in Saudi Arabia for funding this research work through the project number IFKSURG-1436-010.
Declaration of Competing Interest
The authors declare that they have no known competing financial interests or personal relationships that could have appeared to influence the work reported in this paper.
References
- Hydrogeology. Hoboken: John Wiley and Sons Inc; 1966. p. :463.
- Assessment of the geochemical evolution of groundwater quality near the El Kharga Oasis, Egypt using NETPATH and water quality indices. Environ. Earth Sci.. 2020;79(2)
- [CrossRef] [Google Scholar]
- Mechanisms controlling world water chemistry. Science. 1970;170(3962):1088-1090.
- [CrossRef] [Google Scholar]
- New approach in sustainable development based on groundwater resources, Wadi Dara, Eastern Desert, Egypt. Environ. Earth Sci.. 2020;79(13)
- [CrossRef] [Google Scholar]
- Hem, J.D., 1989. Study and interpretation of the chemical characteristics of natural water, 3rd ed. United States Geological Survey Water Supply Paper 2254.
- A graphical procedure in the geochemical interpretation of water. Trans Am. Geophys. Union. 1944;25:914-928.
- [CrossRef] [Google Scholar]
- An Interactive Code (NETPATH) for Modeling net Geochemical Reactions along a Flow Path Version 2.0. Water-Resources Investigations Report. Reston, Virginia: US Geological Survey; 1994. p. :94-4169.
- Assessment and modeling of groundwater quality using WQI and GIS in Upper Egypt area. Environ. Sci. Pollut. Res.. 2018;25(31):30808-30817.
- [CrossRef] [Google Scholar]
- Richards, L.A., 1954. (US Salinity Laboratory) Diagnosis and improvement of saline and alkaline soils. US Department of Agriculture hand book, p 60.
- RIGW, IWACO, 1991. Monitoring and control groundwater pollution in the Nile Delta and adjacent desert areas, El Kanater El Khairia, Egypt, TN 77.01300-91-12.
- Hydrochemical framework of the aquifer in and around East Kolkata Wetlands, West Bengal, India. Environ. Geol.. 2008;55(4):823-835.
- [CrossRef] [Google Scholar]
- The Geology of Egypt. Amesterdam, NewYork: Elsevier Publishing Co.; 1962. p. :380.
- Recharge mechanisms and geochemical processes in a semi-arid sedimentary basin, Eastern Cape, South Africa. J. Hydrol.. 1992;139(1-4):27-48.
- [CrossRef] [Google Scholar]
- Application of multivariate statistical technique for hydrogeochemical assessment of groundwater within the Lower Pra Basin, Ghana. Appl. Water Sci.. 2017;7(3):1131-1150.
- [CrossRef] [Google Scholar]
- Groundwater quality and hydrochemical properties of Al-Ula Region, Saudi Arabia. Environ. Monit. Assess.. 2015;187(3)
- [CrossRef] [Google Scholar]
- Guidelines for Drinking-Water Quality (fourth ed.). Geneva: Switzerland; 2011.


