

Translate this page into:
Antioxidant status and dietary pattern of Arab adults with and without metabolic syndrome
⁎Corresponding author. daldisi@ksu.edu.sa (Dara Aldisi)
-
Received: ,
Accepted: ,
This article was originally published by Elsevier and was migrated to Scientific Scholar after the change of Publisher.
Abstract
Background
Metabolic syndrome (MetS) is a major health problem in the Saudi Arabian population. The aim of this study was to determine the status of antioxidant enzymes, liver enzymes, and intake of selected nutrients in subjects with MetS among Saudi adults in Taif city.
Methods
In this case-control study, a total of 104 subjects (76 with MetS and 28 controls) were recruited. Demographic data was obtained from the participants. Evaluation of anthropometric variables, glucose, lipid profiles, antioxidant enzymes and liver profile were performed. Dietary intake was evaluated through FFQ.
Results
A positive correlation was observed between protein intake and alanine transaminase (ALT) among subjects with MetS (R = 0.33; p < 0.01). In all subjects, the macronutrients were significant predictors of body mass index [carbohydrates (β = 0.66; p < 0.001) followed by fats (β = 0.43; p = 0.003) and protein (β = 0.25; p = 0.04). Fat intake was the most significant predictor for waist circumference (β = 0.46; p = 0.001) followed by protein (β = 0.30; p = 0.01) and carbohydrates (β = 0.49; p = 0.02). Linoleic acid intake had a significant protective effect on diastolic blood pressure (p = 0.027). No significant differences were elicited in antioxidants, liver enzymes and dietary intake between MetS and controls.
Conclusion
Among the antioxidant and liver enzymes, only ALT was significantly associated with protein intake among MetS subjects. Moderate consumption of this macronutrient is recommended among subjects with MetS to prevent liver injury. Further studies are needed using a longitudinal design and with larger sample size to confirm present findings.
Keywords
Metabolic syndrome
Antioxidants
Arabs
Diet
Liver enzyme

1 Introduction
Metabolic syndrome (MetS) is a major health problem globally and can be described as the grouping of at least three risk factors for type 2 diabetes mellitus (T2DM) and atherosclerotic cardiovascular disease (ASCVD). The components risk factors for MetS include high blood glucose, dyslipidemia (increased levels of triglycerides (TG) and reduced levels of high-density lipoprotein; HDL-C), hypertension and abdominal obesity (Bitew et al., 2020).
In the United States, from 2003 to 2012, the overall prevalence of MetS was 33% (Aguilar et al., 2015). Similarly in Saudi Arabia, the prevalence of MetS as defined according to the National Cholesterol Education Program Adult Treatment Panel (NCEP ATP III) criteria was estimated to be 39.8% overall, 29.2% in women and men 34.4% in men. However, using the International Diabetes Federation (IDF) criteria, the prevalence of MetS is 31.6% (45% in men and 35.5% in women) (Al-Rubeaan et al., 2018).
Many studies demonstrated that MetS can be caused by the overproduction of reactive oxygen species (ROS) (Avelar et al., 2015). ROS can be defined as unstable molecules in isolation with potent oxidative impacts that can damage several cellular functions (Matsuda and Shimomura, 2013). ROS-related damage in MetS alter gene expression of inflammatory cytokines and chemokines in the body by up-regulating redox signaling passage which, in the long term, can lead to cardiovascular injury, diabetes and insulin resistance (Rani et al., 2016; Reuter et al., 2010). Additionally, the increase in oxidative stress (OS) is linked to decreased antioxidant defenses (Avelar et al., 2015). Antioxidant defenses include catalase (CAT), glutathione peroxidase (GPX), superoxide dismutase (SOD), and others such as glutathione (GSH), vitamin E and vitamin C (Matsuda and Shimomura, 2013). MetS is also assocated with high levels of aspartate aminotransferase (AST) and serum alanine aminotransferase (ALT) in several cross-sectional studies (Aliabadi et al., 2021; Hanley et al., 2005; Chen et al., 2021). The studies showed that increased ALT is linked to the accumulation of fat in the liver (Westerbacka et al., 2004) which is responsible for nonalcoholic liver disease (NAFLD) (Schindhelm et al., 2007). Additionally, NAFLD is also regarded as a hepatic outcome of MetS, therefore, increased AST and ALT could be major risk factors for MetS (Chen et al., 2016).
Unhealthy diet is established as one of the major risk factors in the development of MetS. However, it is not clear which dietary mode can be used effectively to deal with MetS, since it depends on the method used in nutritional research (Farhangi et al., 2016). Previous studies have suggested the protective effects of the healthy dietary patterns against MetS such as the Dietary Approaches to Stop Hypertension (DASH) and Mediterranean dietary pattern (MDP). MDP is composed of high intakes of olive oil, legumes, nuts, grains, fruits and vegetables daily, and intake of fish and poultry, low consumption of red meat and moderate intake of alcohol with meals weekly (Calton, 2010).
Previous studies suggest that lifestyle change and balanced diet positively affects OS and liver enzymes in patients with MetS (Straznicky et al., 2012), but such studies have yet to be conducted in an Arab ethnic population. Therefore, this study was done to assess the relationship between antioxidant enzymes activity, liver enzymes and eating pattern among Saudi adults with and without MetS.
2 Methodology
2.1 Setting and population
This case-control study was conducted at the family medicine clinics in Alhada Armed Forces Hospital, in Taif city, Kingdom of Saudi Arabia, using a pre-designed questionnaire to assess participant's demographic data, medication history, anthropometric parameters, and their dietary intake. A total of 104 subjects were screened according to the NCEP ATP III (Grundy et al., 2005) [76 with MetS (26 males and 50 females) and 28 controls (9 males and 19 females)]. Ethical approval was obtained from the Institutional Review Board (IRB) of the College of Medicine in King Saud University. The study was conducted in accordance to the ethical standards of IRB and the Declaration of Helsinki and its later amendments.
2.2 Inclusion criteria
Saudi adults (males and females, aged from 36 to 55 years) screened for MetS based on three or more criteria of the NCEP ATP III were included in the study.
NCEP ATP III Criteria
-
FBG level ≥ 5.6 mmol/L or on drug treatment for elevated glucose.
-
BP ≥ 130/85 mmHg or on antihypertensive drug treatment in a patient with a history of hypertension.
-
TG ≥ 1.7 mmol/L or on drug treatment for elevated TG.
-
HDL-C < 1.03 mmol/L for men and < 1.29 mmol/L for women or on medication for reduced HDL-C.
-
WC ≥ 102 cm for men and ≥ 88 cm for women.
2.3 Exclusion criteria
Saudi & expaatriate adults (males and females, aged below 36 and above 55 years) with known infectious disease at the time of the study were excluded. Pregnant women, those with severe kidney, liver or systematic disease, malignancy, and any medical condition that required immediate medical attention were also excluded.
2.4 Subjects
A total of 178 Saudi adults (males and females, aged from 36 to 55) were recruited at the beginning of the study, 74 were excluded (37 subjects did not meet the inclusion criteria while 27 refused to participate and 10 subjects their labs missed during a study. A total of 104 males & females Saudi adults met the inclusion criteria (Fig. 1). The participants had to fast for at least 12 h overnight, and they signed the consent form and filled the interview questionnaire and food frequency questionnaire (FFQ).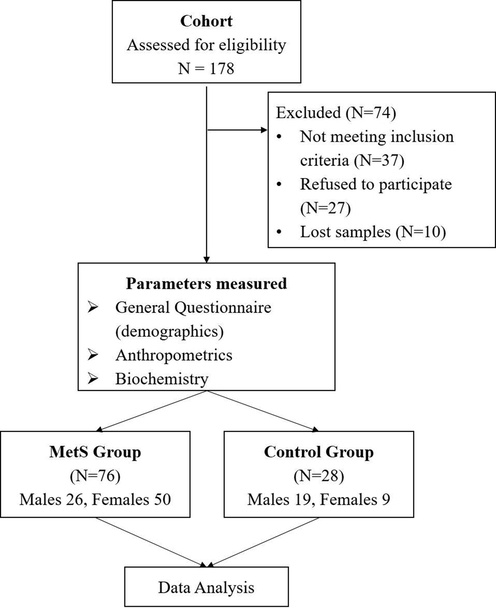
Flowchart of Participants.
2.5 Anthropometric measurements
Height (cm) and weight (kg) were measured with the subject wearing light clothing and standing barefoot using an appropriate international standing scale (Digital Person Scale, ADAM Equipment Inc., USA). Waist and hip circumferences were measured using a standardized non-stretchable fibre measuring tape. Body mass index (BMI) (kg/m2) was calculated. A standardized mercurial sphygmomanometer was used to assess blood pressure twice with 30-minute interval with the average noted (Al-Daghri et al., 2014, 2015).
2.6 Biochemical measurements
Blood was drawn after an overnight fast (>10 h) in the hospital labratory and was centrifuged on the same day by the lab technician. Serum was placed in plain polystyrene tubes and stored at −20 °C. All serum samples were transferred immediately to the Chair for Biomarkers of Chronic Diseases (CBCD) at King Saud University in Riyadh, Saudi Arabia for analysis. Fasting blood glucose and lipid profile were quantified using routine laboratory analysis (Konelab, Finland). This biochemical analyzer was calibrated routinely prior to the analysis of all serum samples using quality control samples provided (Thermo Fisher Scientific, Finland). Low density lipoprotein cholesterol (LDL- C) was calculated (Al-Daghri et al., 2017).
2.7 Liver and antioxidant enzymes
The enzymes ALT, AST were measured using standard clinical methods in an automated Hitachi 912 analyzer (Boehringer, Mannehim, Germany). Liver enzyme concentrations were reported as units/L. Circulating SOD, GPX and CAT were assessed using colorimetric assay kits (Abcam, Cambridge, MA, USA) following manufacturer instructions.
2.8 Nutritional assessment
Dietary assessment of select nutrients was done using food frequency questionnaire (FFQ) (Alkhalaf et al., 2015). Nutrient intake was calculated using the USDA database (18th−21st Ed, 2009, 2016) Program and the Saudi Arabic traditional dishes were analyzed using the Arabic food analysis program (version 1, 2007).
2.9 Data analysis
Data was analyzed using the SPSS (v.23) program (IBM, Chicago, IL, USA). Descriptive statistics was used (percentage for frequencies and mean ± standard deviation for continuous variables). Differences between MetS and control groups were done using Independent T-Test for continuous variables and Chi-Square test for categorical variables. Spearmann test was performed to find the coefficients (R) between antioxidant enzymes activity, liver enzymes and dietary intake. Linear regression analysis was performed to find the significant predictors of MetS components and selected dietary intake. Significance was set at p < 0.05.
3 Results
Table 1 shows the demographic characteristics in subjects with and without MetS. More than 60% were females in both groups and there was no significant difference in sex distribution (p = 0.84), age (p = 0.09), educational status (p = 0.19), job status (p = 0.30) and sector (p = 0.90) as well as smoking status (p = 0.66). An overwhelming 93% of participants from the control group are from the Western region and this was significantly higher as compared to MetS group (69.7%) (p = 0.049). It is worthy to mention that in the control group, almost half of the participants (46.4%) fell in the 36–39 age category while this was only 25% in the MetS group. In the education status, 71.4% of the participants had either secondary education or above as opposed to only 46% in the MetS group. In the MetS group, 59% of the participants were either unemployed or retired as opposed to only 42.8% in the control group. The rest of the characteristics are shown in Table 1. Note: Data presented as frequencies (%). Chi-Square test was done to compare groups; significance at p < 0.05.
Parameters
Control Group (N = 28)
MetS Group (N = 76)
P-Value
Gender
Male
9 (32.1)
26 (34.2)
0.84
Female
19 (67.9)
50 (65.8)
Age (years)
36–39
13 (46.4)
19 (25)
0.09
40–43
5 (17.9)
9 (11.8)
44–47
3 (10.7)
14 (18.4)
48–51
6 (21.4)
19 (25)
52–55
1 (3.6)
15 (19.7)
Education
Illiterate
1 (3.6)
13 (17.1)
0.19
Read/write
0 (0)
3 (3.9)
Primary
5 (17.9)
15 (19.7)
Intermediate
2 (7.1)
10 (13.2)
Secondary
9 (32.1)
19 (25)
Bachelor
8 (28.6)
14 (18.4)
Postgraduate
3 (10.7)
2 (2.6)
Job
Working
16 (57.1)
29 (40.8)
0.30
No work
10 (35.7)
32 (45.1)
Retired
2 (7.1)
10 (14.1)
Job Sector
Education
2 (12.5)
4 (13.3)
0.90
Health
3 (18.8)
5 (16.7)
Engineering
0 (0)
1 (3.3)
Administration
5 (31.3)
11 (36.7)
Military
6 (37.5)
8 (26.7)
Others
0 (0)
1 (3.3)
Region
West
26 (92.9)
53 (69.7)
0.049
South
2 (7.1)
22 (28.9)
North
0 (0)
1 (1.3)
Smoking
Yes
2 (7.1)
4 (5.3)
0.66
No
26 (92.9)
72 (94.7)
The mean differences in clinical and metabolic characteristics of controls and those with MetS are shown in Table 2. The MetS group had a significantly higher fasting blood glucose than controls (p < 0.001). As expected, the MetS group also had a significantly higher systolic and diastolic blood pressure as well as waist circumference (p-values < 0.001, 0.008 and 0.003, respectively) than controls. Serum triglycerides was also significantly higher in the MetS group (p = 0.006) than controls, while controls had a significantly higher mean HDL-cholesterol than the MetS group (p = 0.005). Lastly, no significant differences were seen with respect to levels of antioxidant and liver enzymes in both groups. Note: Data presented as mean ± standard deviation; **significant at p < 0.05.
Parameters
Control Group (N = 28)
MetS Group (N = 76)
P-value
Anthropometrics
BMI (kg/m2)
30.8 ± 8.0
34.7 ± 6.2
0.03
Waist Circumference (cm)
100.14 ± 16.2
110.5 ± 10.3
0.003
Hip Circumference (cm)
114.8 ± 15.2
119.7 ± 13.6
0.11
Waist/Hip Ratio
0.86 ± 0.06
0.92 ± 0.07
0.001
Systolic BP (mmHg)
118.8 ± 10.7
131.6 ± 16.3
<0.001
Diastolic BP (mmHg)
75.3 ± 8.9
81.1 ± 10.0
0.008
Glucose
Fasting Glucose (mmol/l)
5.3 ± 0.5
7.2 ± 2.6
<0.001
Lipid Profile
Triglycerides (mmol/l)
1.5 ± 1.2
2.2 ± 1.0
0.006
HDL-Cholesterol (mmol/l)
1.2 ± 0.3
1.0 ± 0.3
0.005
Total Cholesterol (mmol/l)
5.5 ± 1.0
5.4 ± 1.1
0.63
LDL-Cholesterol (mmol/l)
3.6 ± 1.2
3.4 ± 1.0
0.43
Antioxidant Enzymes
GPX (mU/ml)
4.1 ± 5.04
4.8 ± 5.7
0.54
CAT (mU/ml)
3.8 ± 1.7
3.6 ± 1.6
0.76
SOD (mU/ml)
0.6 ± 0.3
0.6 ± 0.2
0.40
Liver Profile
ALT enzyme (U/L)
9.64 ± 7.2
11.4 ± 7.4
0.29
AST enzyme (U/L)
12.1 ± 7.0
13.4 ± 7.6
0.43
The average macronutrient and trace mineral intake in both groups are shown in Table 3. A significant borderline significance in terms of SFA and fiber intake was observed, both of which are higher in the control group than MetS (p-values 0.07 and 0.06), respectively. The rest of the observations were not significant. Note: Data presented as mean ± standard deviation.
Control Group (N = 28)
MetS Group (N = 76)
P-value
Energy (Kcal/day)
2101.54 ± 584.9
2170.5 ± 538.1
0.57
Carbohydrate (g)
312.4 ± 114.8
321.6 ± 102.1
0.70
Protein (g)
89.3 ± 56.9
90.3 ± 61.8
0.94
Fat (g)
54.9 ± 29.1
58.1 ± 28.5
0.62
SFA (g/d)
19.6 ± 8.3
16.1 ± 8.7
0.07
USFA (g/d)
14.2 ± 6.4
16.0 ± 6.1
0.20
Linoleic Acid (g/d)
3.2 ± 2.2
3.7 ± 2.7
0.45
Linolenic Acid (g/d)
0.4 ± 0.3
0.3 ± 0.3
0.11
Fiber (g)
15.2 ± 3.5
13.9 ± 3.1
0.06
Vitamin C (mg/d)
23.8 ± 10.0
22.0 ± 9.8
0.41
Vitamin E (mg/d)
4.0 ± 2.5
3.4 ± 1.9
0.24
Zinc (mg/d)
2.5 ± 0.9
2.1 ± 0.8
0.06
Selenium (µg/d)
15.6 ± 6.3
14.6 ± 5.9
0.45
Manganese (mg/d)
2.7 ± 1.6
3.3 ± 1.7
0.11
Table 4 shows the bivariate associations of antioxidant enzymes analyzed and the selected nutrients in both groups. In the control group, GPX was significantly associated with SOD (p < 0.01). CAT was positively associated with Mn (p < 0.05). Vitamin C was positively associated with Zn (p < 0.05). Both Vitamin E and Se had no significant associations with any of the variables. In the MetS group, GPX was positively associated with SOD (p < 0.01). CAT was inversely associated with Mn (p < 0.05). Vitamin C was significantly associated with both Zn (p < 0.01) and Mn (p < 0.05). Vitamin E was inversely associated with Mn (p < 0.05). Se was positively associated with Mn (p < 0.05). The rest of the associations for the MetS group is found in table 4. Note: Data presented as coefficient (R); * denotes significance at 0.05 level; ** denotes significance at 0.01 level.
GPX
CAT
SOD
Vitamin C
Vitamin E
Zn
Se
Mn
CONTROL GROUP
GPX
–
0.31
0.52**
0.16
−0.16
0.06
0.27
−0.06
CAT
0.31
–
0.15
0.11
−0.01
0.14
0.25
0.38*
SOD
0.52**
0.15
–
0.26
−0.04
−0.02
0.17
−0.12
Vitamin C
0.16
0.11
0.26
–
−0.29
0.47*
0.23
−0.16
Vitamin E
−0.16
−0.01
−0.04
−0.29
–
−0.19
−0.34
−0.26
Zn
0.06
0.14
−0.02
0.47*
−0.19
–
0.08
−0.28
Se
0.27
0.25
0.17
−0.16
−0.34
0.08
–
0.05
Mn
−0.06
0.38*
−0.12
−0.03
−0.26
−0.28
0.05
–
METS GROUP
GPX
–
−0.005
0.44**
−0.03
0.20
−0.08
0.02
0.04
CAT
−0.005
–
0.003
−0.08
−0.09
−0.003
−0.10
−0.27*
SOD
0.44**
0.003
–
−0.01
0.04
−0.005
0.04
0.08
Vitamin C
−0.03
−0.08
−0.01
–
−0.14
0.32**
0.10
0.30*
Vitamin E
0.20
−0.09
0.04
−0.14
–
0.16
−0.22
−0.26*
Zn
−0.08
−0.003
−0.005
0.32**
0.16
–
−0.07
−0.21
Se
0.02
−0.10
0.04
0.10
−0.22
−0.07
–
0.28*
Mn
0.04
−0.27*
0.08
0.30*
−0.26*
−0.21
0.28*
–
Both liver enzymes (AST and ALT) were not associated with any of the selected nutrients in the control group (Table 5). AST however was significantly associated with ALT (p < 0.01). Within the selected nutrients the significant associations were as expected; energy intake was positively associated with carbohydrates (p < 0.01); fats (p < 0.05) and USFA (p < 0.05). Carbohydrate was also significantly associated with USFA (p < 0.05). Linoleic acid was significantly associated protein (p < 0.01), SFA (p < 0.05) and fiber intake (p < 0.05). Lastly, linoleic acid was significantly associated with linolenic acid (p < 0.01) (Table 5). In the MetS group, AST had no significant association with any of the selected nutrients but was positively associated only with ALT (p < 0.05). ALT on the other hand was positively associated with protein intake (p < 0.01). Other associations were shown in Table 5. Note: Data presented as coefficient (R); * denotes significance at 0.05 level; ** denotes significance at 0.01 level.
ALT
AST
Energy
CHO
CHON
Fat
SFA
USFA
Linoleic
Linolenic
Fiber
CONTROL GROUP
ALT
–
0.57**
−0.11
0.04
0.26
−0.14
−0.20
0.14
−0.04
0.20
−0.23
AST
0.57**
–
−0.26
−0.16
0.33
−0.13
−0.15
−0.09
−0.04
0.25
−0.10
Energy
−0.11
−0.26
–
0.78**
0.24
0.46*
0.02
0.42*
0.04
−0.02
0.34
CHO
0.04
−0.16
0.78**
–
0.05
−0.08
0.18
0.45**
0.14
−0.12
0.28
CHON
0.26
0.33
0.24
0.05
–
0.18
−0.13
0.11
0.56**
0.30
0.10
Fat
−0.14
−0.13
0.46*
−0.08
0.18
–
−0.16
−0.09
−0.19
0.13
0.26
SFA
−0.20
−0.15
0.02
0.18
−0.13
0.16
–
0.25
0.40*
0.28
0.36
USFA
0.14
−0.09
0.42*
0.45*
0.11
−0.09
0.25
–
0.25
0.48**
0.36
Linoleic
−0.04
−0.04
0.04
0.14
0.56**
−0.19
0.40*
0.25
–
0.53**
0.38*
Linolenic
0.20
0.25
−0.02
−0.12
0.30
0.13
0.28
0.48**
0.53**
–
0.34
Fiber
−0.23
−0.10
0.34
0.28
0.10
0.26
0.36
0.36
0.38*
0.34
–
METS GROUP
ALT
–
0.40*
0.16
−0.003
0.33**
0.19
−0.21
−0.14
0.08
0.04
0.19
AST
0.40*
–
0.16
0.18
0.22
0.09
−0.11
0.06
0.07
0.07
0.05
Energy
0.16
0.16
–
0.72**
0.43*
0.29*
0.11
0.08
0.37**
0.24*
0.44**
CHO
−0.003
0.18
0.72**
–
0.02
−0.18
0.14
0.10
0.30**
0.10
0.33**
CHON
0.33**
0.22
0.43**
0.02
–
0.22
−0.03
0.10
0.37**
0.15
0.18
Fat
0.19
0.09
0.29*
−0.18
0.22
–
−0.16
−0.16
−0.15
−0.005
0.07
SFA
−0.21
−0.11
0.11
0.14
−0.03
−0.16
–
0.04
0.01
0.08
0.12
USFA
−0.14
0.06
0.08
0.10
0.10
−0.16
0.04
–
0.22
0.11
0.05
Linoleic
0.08
0.07
0.37**
0.30*
0.37**
−0.15
0.01
0.22
–
0.32**
0.23*
Linolenic
0.04
0.07
0.24*
0.10
0.15
−0.005
0.08
0.11
0.32**
–
0.39**
Fiber
0.19
0.05
0.44**
0.33*
0.18
0.07
0.12
0.05
0.23*
0.39**
–
Using linear regression analysis, the significant predictors of the different MetS components for all participants with selected dietary intake is summarized in Table 6. Individual MetS components were used as dependent variable while energy, carbohydrates, proteins, fats, SFA, USFA, Linoleic acid, Linolenic acid and fiber were all entered as independent variables. Energy intake had a protective effect on BMI (β = −0.83; p < 0.001), while the major macronutrients had a direct effect on BMI, the highest of which is carbohydrates (β = 0.66; p < 0.001) followed by fats (β = 0.43; p = 0.003) and protein (β = 0.25; p = 0.04). The same positive significant relationships were observed with waist circumference, being also an indicator of obesity. Energy intake was inversely associated with waist circumference (β = −0.71; p = 0.002). Among the macronutrients, fat intake was the most significant predictor for elevated waist circumference (β = 0.46; p = 0.001) followed by protein (β = 0.30; p = 0.01) and carbohydrates (β = 0.49; p = 0.02). With the exception of diastolic blood pressure having linoleic acid intake as the only significant and protective predictor (β = -0.28; p = 0.027), the other MetS components (systolic blood pressure, fasting blood sugar, HDL-cholesterol and triglycerides) had no significant predictors for this specific cohort. Note: Linear regression analysis using MetS components as dependent variables; Data presented as β. Independent variables included energy, carbohydrates, proteins, fats, SFA, USFA, Linoleic acid, Linolenic acid and fiber; Significant at p < 0.05.
Predictor
Body Mass Index
Standardized β
P-Value
Energy
−0.83
<0.001
Carbohydrates
0.66
<0.001
Protein
0.25
0.04
Fats
0.43
0.003
Waist Circumference
Energy
−0.71
0.002
Carbohydrates
0.49
0.02
Protein
0.30
0.01
Fats
0.46
0.001
Systolic Blood Pressure
None
Diastolic Blood Pressure
Linoleic Acid
−0.28
0.027
Fasting Blood Sugar
None
Triglycerides
None
HDL-Cholesterol
None
4 Discussion
The present study aimed to assess differences in antioxidants, liver enzymes and trace dietary intake among Saudi adults with and without MetS. The present study observed no significant differences in antioxidant enzymes. Despite the non-significance, GPX enzymes was slightly higher in the MetS group as compared to the control group, while circulating CAT enzymes was modestly higher in the control group than MetS. The present study outcomes were not consistent with previous studies done which showed lower antioxidant enzymes for the MetS group compared to control group (Chen et al., 2016; Sabir et al., 2016). A similar pattern of results was obtained regarding CAT enzymes with a previous study (Vávrová et al., 2013). These differences can be attributed to either severity of MetS (Vávrová et al., 2013) or sex and age differences, for example CAT enzyme in serum could influenced by sex and age (Goth, 1989). While no significant differences in liver enzyme activity were observed, ALT was positively associated with protein intake only in the MetS group, suggesting that this macronutrient should be monitored in individuals with MetS as it is a risk factor for elevated ALT. It has been theorized that the main cause of elevated liver enzymes among individuals with MetS is the presence of non-alcoholic fatty liver disease (NAFLD) (Chen et al., 2016). This association of NAFLD with MetS is largely due to the co-existence of other metabolic disorders obesity, dyslipidemia, DM, and hypertension (Chen et al., 2016).
Dietary intake, including the choice of foods and frequency of meals are significant factors for obesity as well as the development of the MetS (Innocenti et al., 2015). In the present study, it was notable that both groups had a mean BMI well within the obese range. One of the most studied dietary patterns that is directly linked to MetS and T2DM is referred to as the “Western diet”, defined as high in protein (mainly from fatty domesticated and processed meats), saturated fats, refined grains, sugar, alcohol, salt, and corn-derived fructose syrup, with an associated decreased intake of fruits and vegetables (Statovci et al., 2017). This type of dietary pattern is prevalent in industrialised countries (including Saudi Arabia and its major cities such as Taif, where the present study was conducted) has been consistently shown to alter individuals’ metabolic profile leading to the progress of insulin resistance-related diseases such as MetS and over-all mortality (Lee et al., 2019).
While multivitamin intake was not assessed in the present study, it is worthy to note that the vitamins mentioned can reduce insulin resistance through its antioxidant properties (Ryan et al., 2010). The mean intake of micronutrients in the current study for both groups was below the requirements. It is clear that a large supply of nutrients and low antioxidant intake promotes obesity and MetS (Dandona et al., 2010). Individuals with MetS and obesity have a high consumption of fat and sugars derived from processed foods with high sodium content (Johnson et al., 2013) as well as low antioxidant intake (Francisqueti et al., 2017).
In addition, our study reported a positive correlation between energy, ALT and AST in the MetS group. ALT also correlated positively with protein intake in MetS group. It is known that the liver orchestrates protein and amino acid metabolism. Depending on severity, individuals with MetS have varying levels of liver damage, with NAFLD being the classic hallmark, and this can greatly alter protein metabolism, which most likely explains the associations elucidated in the present study (Charlton, 1996). In a cross-sectional study involving 187 adult men and 249 adult women, unhealthy food intake and liver enzymes were measured and found that higher intakes of energy from fast foods were associated with elevated serum levels of ALT and ALT to AST ratio (Mirmiran et al., 2019). In our study, the sources of protein were not determined.
The current study observed that macronutrients intake had a direct effect on measures of adiposity (BMI and waist), the highest of which is carbohydrates followed by fats and protein. Carbohydrate intake stimulates insulin secretion, which promotes fat storage and strongly inhibits adipose tissue lipolysis and fatty acid oxidation (Hyde et al., 2019). The possible biologic mechanisms of glycemic index on body weight are thought to be related to insulin levels, hunger and satiation, and basic metabolic processes (Warren et al., 2003). Body mass index was found to be positively associated with glycemic index, a measure of the glycemic response associated with ingesting different types of carbohydrates, but not with daily carbohydrate intake, percentage of calories from carbohydrates, or glycemic load (Ma et al., 2005). As well Trichopoulou et al. (2002) found that protein intake is conducive to obesity. Moreover, their data suggest that neither saturated or monounsaturated lipids nor carbohydrates are likely to play a major role in increasing BMI over and beyond that indicated by their energy content.
Lastly, linoleic acid intake was observed to be protective against elevated diastolic blood pressure. Miura et revealed that linoleic acid intake may contribute to prevention and control of hypertension levels in general populations which is consistent with our outcomes (Miura et al., 2008). Blood pressure-lowering effects of linoleic acid may be mediated through changes in prostaglandin (PG) metabolism. In animal studies of diets enriched with n-6 PFA, the vasodilator PGs (PGI2 and PGE2) increased in kidney, aorta, blood, or urine. In humans, there is evidence that production of PG in kidney as well as other human tissues from dietary polyunsaturated fatty acids (PFA) is involved in BP regulation (Iacono and Dougherty, 1993).
The present study has several limitations. First is the relatively small sample size with the unequal distribution of the control and MetS group. Also, stratification according to sex was not done, again because of sample size issues. This is important as several MetS parameters are sex-sensitive (HDL-cholesterol and waist circumference). Lastly, herbal medications were not determined among participants especially in the MetS group and this could partially explain the lack of differences in antioxidant and liver enzymes, considering that majority of obese individuals in Taif take herbal medications (Eldalo et al., 2017). Despite the limitations, the present study is one of the few to assess antioxidant and liver enzyme activity among Saudi adults with and without MetS.
5 Conclusion
In summary, antioxidant and liver enzyme activity are not significantly different among Saudi adults with or withour MetS living in Taif. Intake of linoleic acid was protective against elevated diastolic blood pressure. Protein intake was associated with elevated ALT among individuals with MetS, indicating that this macronutrient can be a risk factor for liver damage. Further studies are needed using a longitudinal design and with larger sample size to confirm present findings.
Funding
The authors are grateful to the Chair for Biomarkers of Chronic Diseases, Deanship of Scientific Research in King Saud University in Riyadh, Saudi Arabia for their support.
Declaration of Competing Interest
The authors declare that they have no known competing financial interests or personal relationships that could have appeared to influence the work reported in this paper.
References
- Metabolic syndrome among children and adolescents in low- and middle-income countries: a systematic review and meta-analysis. Diabetol Metab Syndr. 2020;12:93.
- [Google Scholar]
- Prevalence of the metabolic syndrome in the United States, 2003–2012. JAMA. 2015;313(19):1973-1974.
- [Google Scholar]
- Prevalence of metabolic syndrome in Saudi Arabia-a cross sectional study. BMC Endocr Disord. 2018;18(1)
- [CrossRef] [Google Scholar]
- Oxidative stress in the pathophysiology of metabolic syndrome: which mechanisms are involved? J Bras Patol Med Lab. 2015;51(4):231-239.
- [Google Scholar]
- Increased oxidative stress in obesity: implications for metabolic syndrome, diabetes, hypertension, dyslipidemia, atherosclerosis, and cancer. Obes Res Clin Pract.. 2013;7(5):e330-e341.
- [Google Scholar]
- Oxidative stress and metabolic disorders: Pathogenesis and therapeutic strategies. Life Sci. 2016;148:183-193.
- [Google Scholar]
- Oxidative stress, inflammation, and cancer: how are they linked? Free Radic Biol Med.. 2010;49(11):1603-1616.
- [Google Scholar]
- Perceived stress scores among Saudi students entering universities: a prospective study during the first year of university life. Int J Environ Res Public Health. 2014;11(4):3972-3981.
- [CrossRef] [Google Scholar]
- Association between liver enzymes and metabolic syndrome: results of the enrollment phase of Tabari cohort. Ir J Med Sci 2021
- [CrossRef] [Google Scholar]
- Liver markers and development of the metabolic syndrome: the insulin resistance atherosclerosis study. Diabetes. 2005;54(11):3140-3147.
- [Google Scholar]
- Prevalence of and risk factors for metabolic associated fatty liver disease in an urban population in China: a cross-sectional comparative study. BMC Gastroenterol.. 2021;21(1):212.
- [Google Scholar]
- Women and men have similar amounts of liver and intra-abdominal fat, despite more subcutaneous fat in women: implications for sex differences in markers of cardiovascular risk. Diabetologia. 2004;47(8):1360-1369.
- [Google Scholar]
- Alanine aminotransferase and the 6-year risk of the metabolic syndrome in Caucasian men and women: the Hoorn Study. Diabetic Med. 2007;24(4):430-435.
- [Google Scholar]
- Metabolic syndrome and serum liver enzymes in the general Chinese population. Int J Environ Res Public Health. 2016;13(2):223.
- [Google Scholar]
- Association between dietary patterns and metabolic syndrome in a sample of Tehranian adults. Obes Res Clin Pract.. 2016;10(Suppl 1):S64-S73.
- [Google Scholar]
- Prevalence of micronutrient deficiency in popular diet plans. J Int Soc Sports Nutr. 2010;7(1):24.
- [Google Scholar]
- The effects of dietary weight loss with or without exercise training on liver enzymes in obese metabolic syndrome subjects. Diabetes Obes Metab. 2012;14(2):139-148.
- [Google Scholar]
- Diagnosis and management of the metabolic syndrome. Circulation. 2005;112(17):2735-2752.
- [Google Scholar]
- Sensitivity of various adiposity indices in identifying cardiometabolic diseases in Arab adults. Cardiovasc Diabetol.. 2015;14:101.
- [Google Scholar]
- Serum Uric Acid to Creatinine Ratio and Risk of Metabolic Syndrome in Saudi Type 2 Diabetic Patients. Sci Rep. 2017 Sep 21;7(1):12104.
- [Google Scholar]
- Validation of a food frequency questionnaire specific for salt intake in Saudi Arabian adults using urinary biomarker and repeated multiple pass 24-hour dietary recall. Proc Nutr Soc. 2015;74(OCE5):E337.
- [Google Scholar]
- Oxidative stress among subjects with metabolic syndrome in Sokoto. North. Western Nigeria. Niger J Clin Pract. 2016;19(1):128.
- [CrossRef] [Google Scholar]
- Vávrová L, Kodydková J, Zeman M, Dušejovská M, Macášek J, Staňková B, Tvrzická E, Zák A. Altered activities of antioxidant enzymes in patients with metabolic syndrome. Obes Facts 2013; 6(1):39-47.
- Effect of age, sex, and smoking on serum catalase activity. Acta Biol Hung. 1989;40(4):395-399.
- [Google Scholar]
- Can Mediterranean Diet Counteract Metabolic Syndrome Diffusion? J Cardiol Ther. 2015;2(6):452-455.
- [Google Scholar]
- The impact of western diet and nutrients on the microbiota and immune response at mucosal interfaces. Frontiers Immunol. 2017;8:838.
- [Google Scholar]
- Identification of dietary patterns associated with incidence of hyperglycemia in middle-aged and older Korean adults. Nutrients. 2019;11(8):1801.
- [Google Scholar]
- Vitamin E and C supplementation reduces oxidative stress, improves antioxidant enzymes and positive muscle work in chronically loaded muscles of aged rats. Exp Gerontol. 2010;45(11):882-895.
- [Google Scholar]
- Macronutrient intake induces oxidative and inflammatory stress: potential relevance to atherosclerosis and insulin resistance. Exp Mol Med. 2010;42(4):245-253.
- [Google Scholar]
- Sugar, uric acid, and the etiology of diabetes and obesity. Diabetes. 2013;62(10):3307-3315.
- [Google Scholar]
- The role of oxidative stress on the pathophysiology of metabolic syndrome. Rev Assoc Méd Bras. 2017;63(1):85-91.
- [Google Scholar]
- Protein metabolism and liver disease. Baillière's Clinical Endocrinology and Metabolism. 1996;10(4):617-635.
- [Google Scholar]
- Elevated serum levels of aminotransferases in relation to unhealthy foods intake: Tehran lipid and glucose study. BMC EndocrDisord. 2019;19(1):100.
- [Google Scholar]
- Dietary carbohydrate restriction improves metabolic syndrome independent of weight loss. JCI. Insight. 2019;4(12)
- [Google Scholar]
- Warren JM, Henry CJK, Simonite V. Low glycemic index breakfasts and reduced food intake in preadolescent children. Pediatrics 2003; 112(5), e414-e414.
- Association between dietary carbohydrates and body weight. Am J Epidemiol. 2005;161(4):359-367.
- [Google Scholar]
- Lipid, protein and carbohydrate intake in relation to body mass index. Eur J Clin Nutr. 2002;56(1):37-43.
- [Google Scholar]
- Relationship of dietary linoleic acid to blood pressure: The international study of macro-micronutrients and blood pressure study. Hypertension. 2008;52(2):408-414.
- [Google Scholar]
- Effects of polyunsaturated fats on blood pressure. Ann Rev Nutr. 1993;13(1):243-260.
- [Google Scholar]
- Use of Herbal Medicines in the Treatment of Obesity in Taif, Saudi Arabia. Saudi J Med Med Sci.. 2017;5(2):149-154.
- [Google Scholar]


