

Translate this page into:
Analysis of the shoreline changes using geoinformatics in Ghoramara Island of Hugli Estuary, West Bengal in India
⁎Corresponding author. birajmondal.kolkata@gmail.com (Biraj Kanti Mondal),
-
Received: ,
Accepted: ,
This article was originally published by Elsevier and was migrated to Scientific Scholar after the change of Publisher.
Abstract
Conceptual Framework
Coastal decrepitude is the loss of topographical resources along the coast as a result of silt, temperature fluctuations, tidal shifts, and wave breaking. Hydraulic activity, scraping, abrasion, and erosion are the major causes of erosion; other factors that affect it include the condition of the shore, rocks, joints, fissures, marine chemical reactions, and wave force.
Objectives
The primary objectives of this study are to analyze the coastline changes between 1972 and 2022 utilizing remote sensing and GIS data and forecast the changes in the shoreline in 2032.
Methods
The study examined coastal areas from 1972 to 2022 using multi-temporal satellite data from Landsat TM and Landsat OLI/TIRS. Shoreline change and the calculations related to it were examined using the Digital Shoreline Analysis System using near-infrared bands and tasseled cap transformation, to determine the rate of change in the shoreline, the study also employed Shoreline Change Envelope and End Point Rate techniques.
Results
Coastal erosion caused substantial damage to the island between 1972 and 2022. The northern, southeastern, and western regions of the coast are seeing the highest levels of coastal erosion. The south coast experiences considerable erosion, whereas the west and southeast coasts experience the least. The EPR of Ghoramara Island has mean, minimum, and maximum changes of −10.59, −4.13, and −35.93, respectively. A notable inshore shift has occurred in the northern portion of Ghoramara, extending from 676 m to 855 m. The study also uses tidal gauge records and Revised Local Reference data from the Haldia Gauge Station to track long-term sea level variations. According to the study, Ghoramara Island's shoreline will change by 2032, with the greatest negative changes expected to occur around the island's western and southern borders.
Conclusion
The study shows a significant decrease in Ghoramara's shoreline regions between 1972 and 2022, with a 3,000-population shifted from the place in 2016 due to Lohachara's submergence. Changes in the island's morphology and human activities have reduced cultivation. The study suggests increasing mangrove vegetation to combat coastal erosion and prevent further displacement of people to neighboring islands.
Keywords
Coastal desolation
Geospatial techniques
End Point Rate
Shifting shoreline

- GIS
-
Geographic Information Systems
- LR
-
Linear regression
- EPR
-
Endpoint rate
- USGS
-
United States Geological Survey
- DSAS
-
Digital Shoreline Analysis System
- SCE
-
Shoreline change envelope
- UNHCR
-
The United Nations High Commissioner for Refugees
- UN
-
United Nations
- IPCC
-
Intergovernmental Panel on Climate Change
- IOM
-
International Organization for Migration
- TM
-
Thematic Mapper
- OLI
-
Operational Land Imagery
- TIRS
-
Thermal Infrared Sensor
- DN
-
Digital Number
- EROS
-
Earth Capital Observation and Analysis
- NIR
-
Near-infrared
- NSM
-
Net shoreline movement
- PSMSL
-
Permanent Service for Mean Sea Level
- SL
-
Sea Level
- RLR
-
Revised Local Reference
- Km2
-
Square Kilometer
Abbreviations
1 Introduction
Coastal dilapidation is the elimination of supplies from the coastal topography (Adarsa et al., 2012). The process of polishing at the beach's base often leads to soil degradation from the coastal periphery due to variations in supply and subcontracting. (Bandyopadhyay, 1996; Marchand et al., 2011). When the amount of residue source surpasses the ratio of sediment loss, erosion occurs and the shoreline is pushed inland (Central Water Commission, 2022). Factors such as coast state, rock nature, joints, fissures, marine chemical reactions, and wave power influence the strength of abrasion, erosion, hydraulic action, and scraping processes (Cai et al., 2009). It results from both anthropogenic activities and natural climate change and through dynamic processes upsets the balance of coastal systems (Jayappa et al., 2006). Long-term sediment deterioration supports coastline retreat and beach erosion (Kundu et al., 2014). Wave action causes sand from the coast to move messily to adjacent coastline sections, regulating the removal and release of materials and sediments onshore (Pramanick et al., 2022). Satellite data is crucial for coastal defense design, numerical model validation, sea level estimation, and danger zone design. Geographic Information Systems (GIS) and remote sensing have improved future shoreline estimates and enabled the monitoring and planning of alterations in coastal regions. Historical data analysis of shoreline projection models predicts future changes based on alteration rates (Emily and Himmelstoss, 2021). The linear regression (LR) model uses a linear projection system for temporary modification, while the Endpoint rate (EPR) forecasts changes. Advancements in remote sensing and GIS techniques improve coastal studies (Pramanick et al., 2022). The study utilizes the United States Geological Survey’s (USGS) Digital Shoreline Analysis System (DSAS) to analyze topographical and bathymetric data, identify coastal changes, forecast shorelines, and perform semi-automatic mapping and forecasting using the Net Shoreline Movement approach (Emily and Himmelstoss, 2021). The study is focusing on Ghoramara Island in the Indian Sundarbans, a site of previous multidisciplinary investigations. Researchers evaluate topographical and bathymetric data, anticipate shorelines, map periods, and use the Net Shoreline Movement approach (Emily and Himmelstoss, 2021). The objective is to use the DSAS-5.1 tool as an add-in to GIS software to approximate the rate of shoreline change (1972–2022) in Ghoramara Island using the Shoreline change envelope (SCE) and EPR Models (Caballero and Stumpf, 2020). The concept of environmental refugees has expanded to include internally displaced individuals, economic refugees, caring refugees, and environmental refugees. The United Nations High Commissioner for Refugees (UNHCR) Controlling Principles outline rights and safeguards for forced relocation, while organizations like the United Nations (UN) Environment Program, Intergovernmental Panel on Climate Change (IPCC), and International Organization for Migration (IOM) for Migration address resource strain, livelihood threats, and risks faced by migrant residents (Pramanick et al., 2022). Climate change is causing environmental migrants to migrate, with 150 million people expected to relocate by 2050, 50 million due to sea level rise, and 120 million in India and Bangladesh by 2100, causing resource shortages and increasing cyclone frequency and storm surge size (The United Nations High Commissioner for Refugees, 2023). The Sundarban Island Scheme's Hugli River estuary in the Gulf of Bengal shows island submersion, erosion, and migration, with Lohachara, Suparibhanga, and Bedford submerged, and Ghoramara Island suffering from erosion and aerial loss. Ghoramara island, home to significant settlements like Khasimara, Baishnabpara, Hatkhola, Mandirtala, Chunpuri, and Khasimara Char, is susceptible to damage from cyclones, storm surges, embankment collapse, and tidal erosion. This study analyzes coastline changes between 1972 and 2022 using remote sensing and GIS data, aiming to predict changes in shoreline in 2032 due to habitat degradation and ecosystem decline. The innovative and essential feature of the anticipated model is its comprehensive examination of the research area's spatial changes during the previous 50 years, allowing for the identification of predictions made ten years later. It must serve as the foundation for conversations on coastal risks linked to shoreline shifting in the early warning system.
2 Materials and methods
2.1 Study area and datasets
Ghoramara Island is situated in South Twenty Four Parganas district in West Bengal. To the north of Sagar Island lies the river that divides the mainland from the island of Ghoramara (Fig. 1). It spans 3.61 km2 and is situated between 21°53′56′′N and 21°55′37′′N as well as 88°06′59′′E and 88°08′35′′E on the southeasterly edge of Ghoramara is Sagar Island. The principal settlements on this island are Kashimara, Lakshmi Narayanpur, Raipara, Hathkola, and Chunpuri. For the past few years, Ghoramara's northern region has undergone a drastic degradation (Department of Environment, 2010). The specifications of the remotely sensed images are shown in Table 1.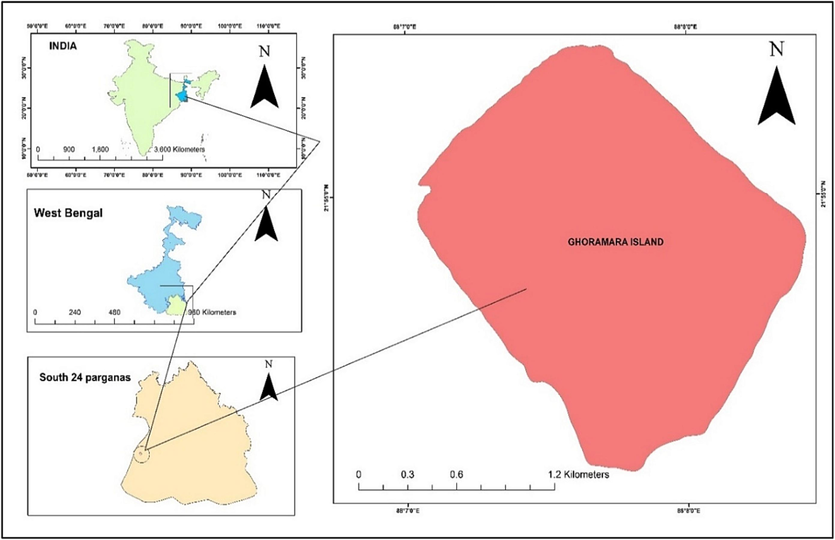
Location map of the study area.
Satellite & Sensor
Date of acquisition
Spatial Resolution
Path-Row
Landsat TM (Thematic Mapper)
5 November 1972
30 m (for all bands)
138–045
Landsat TM
2 February 1982
30 m
138–045
Landsat TM
2 June 1992
30 m
138–045
Landsat TM
10 August 2002
30 m
138–045
Landsat TM
20 December 2012
30 m
138–045
Landsat OLI/TIRS (Operational Land Imagery/Thermal Infrared Sensor)
21 October 2022
30 m (OLI Bands 1 to 7 and 9); 15 m (OLI Band 8); 100 m (TIRS Bands 10 and 11)
138–045
2.2 Digital Shoreline Analysis System (DSAS)
The DSAS 5.1 application is a crucial tool for the USGS's Coastal Change Hazards project due to its standardized and easy-to-repeat method for assessing and researching shoreline dynamics and changing morphologies. It uses five statistical methods to compute the rate of modification of coastline over the long and short term. The DSAS 5.1 tool is used to examine shoreline change and its associated computations from the EPR and SCE models as a delay of ArcGIS. The key inputs for this tool include the shoreline vector format, each shoreline's datum, and the transect spacing. This enables the assessment and research of fundamental aspects of shoreline dynamics and changing morphologies. A general methodological framework of the present study has been represented in Fig. 2.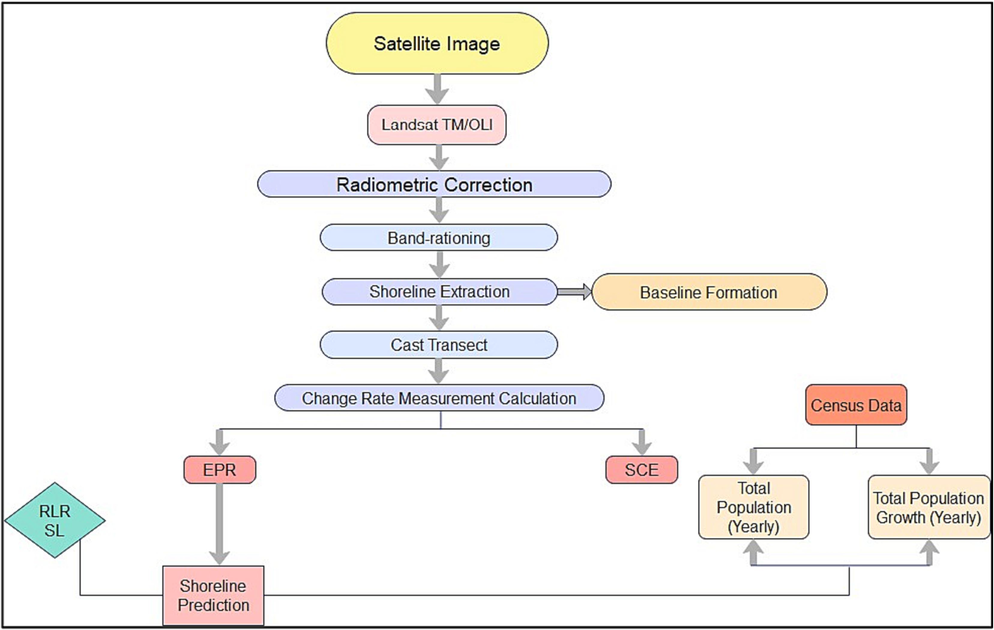
Flow chart showing the methodology of the present study.
2.3 Methods and techniques
2.3.1 Data processing and shoreline delineation
The study utilized Landsat TM and Landsat OLI/TIRS satellite pictures for radiometric correction, converting Digital Number (DN) values into radiance and reflectance values for each band of the satellite photos. Due to the numerous places along the land–water boundary that are saturated with water, automatic Shoreline delineation is a complicated procedure (Jangir et al., 2016; Mahapatra et al., 2014; Maiti and Bhattacharya, 2009; Saravanan et al., 2019. To delineate the coastline, active the tasseled cap transformation technique to excerpt the coastline from the tasseled cap Landsat data from the Earth Capital Observation and Analysis (EROS) data center using the resulting coefficients to modify the data (Cenci, et al., 2018; Hegde and Akshaya, 2015; Kuleli et al., 2011; Mukhopadhyay et al., 2012; Patel et al., 2021). The tasseled cap modification methods were applied to Landsat TM and Landsat 8 OLI & TIRS images to design the coastlines. Landsat TM Processed near-infrared (NIR) bands can be used to identify and outline shorelines from a single image due to minimal water reflection. The investigation used an average ratio between bands 2 and 4 and 2 and 5 to eliminate vegetation at the shoreline. The combined reflectivity of five means for water in band 2 and the bottom indicates that several vegetated regions should be designated as water. The binary raster image was transformed into a vector dataset, and the shoreline borders were displayed in Fig. 3.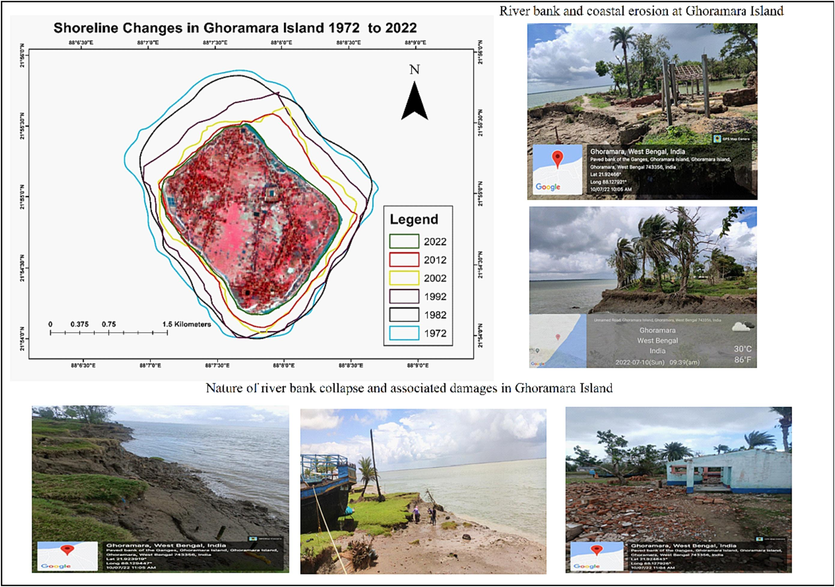
Shoreline changes and coastal erosion scenarios in Ghoramara Island.
2.3.2 Method of casting transect from baseline and determination of the net area change
The approach primarily focuses on statistics, with a single baseline established from the shoreline before drawing the transect, which can be defined using either a specific distance from the beach or the buffer method (Crowell et al., 1997; Nandi et al., 2016). Because it adopts the same sinuosity form as the nearby shoreline, the buffer approach is the most exact baseline demarcation method (Nassar et al., 2019). The DSAS software uses attribute values like SHAPE, OBJECTID, ID, Group, SHAPE Length, and CastDir, Offshore to start baseline computations. A baseline was established at a 1000-meter buffer distance from the nearby shoreline, and transect lines were laid orthogonally from the baseline over several years. The most commonly used statistical methods for measuring coastline change are LR and NSM, EPR, and SCE. EPR and SCE are two significant mathematical models used to calculate the rate of change of the shoreline of Ghoramara Island. EPR is predictive and takes into account the distance between the eldest and newest shorelines in the dataset, but it is only suitable for temporary assessments. SCE measures the total change in coastline movement and records the lengths of all available shoreline locations without referring to individual dates. The SEC is calculated as the separation between the farthest and nearest baseline shorelines. The total changes in coastline movement for each transect are shown for all accessible shoreline locations. The baseline site foundations comprise the rates of shoreline accretion and erosion. This procedure identifies erosion and accumulation areas on an island and calculates its area changes using spatial analysis in the GIS environment. A polygon is built around the GIS platform's boundary to reflect the island's area in that year and along the shoreline to determine its size. Net erosion is quantified by combining polygons from two consecutive years at ten-year intervals (1972–1982, 1982–1992, 1992–2002, 2002–2012, and 2012–2022). The length and diversity of erosion/accretion between polygons are calculated. The vector data is converted into raster data with a 10-meter grid scale to measure air changes. The application of the EPR and SEC methods is represented in Fig. 4.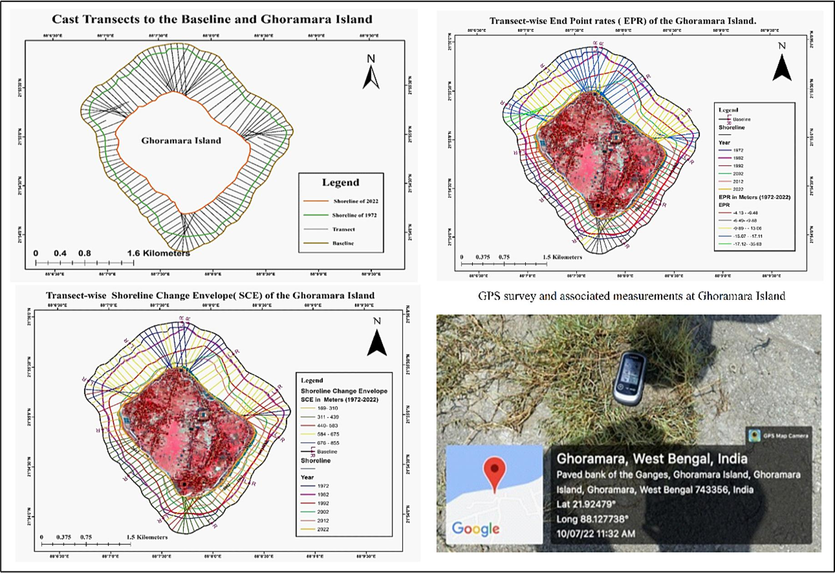
Calculation of net areal change using transect-wise Endpoint Rates (EPR) and Shoreline Change Envelope (SCE) around Ghoramara island.
3 Results
3.1 Endpoint rates
Net shoreline movement (NSM) is the distance (meters) between the oldest and youngest shorelines, and Endpoint rate (EPR) is the ratio between NSM and time between the eldest and newest shorelines. Fig. 5 displays the Ghoramara Island research area's predicted EPR based on DSAS. The EPR is calculated by separating the amount of shoreline movement by the distance in time between two shorelines. Fig. 5 also shows a plot of the transect-wise shoreline displacement rate. The graph primarily emphasizes the EPR in the negative values, demonstrating that the Ghoramara Island research region experienced more or less rapid erosion during the study's period of 1972 to 2022 considered for the study. The rate of change in shoreline per year to measure the EPR is calculated by using.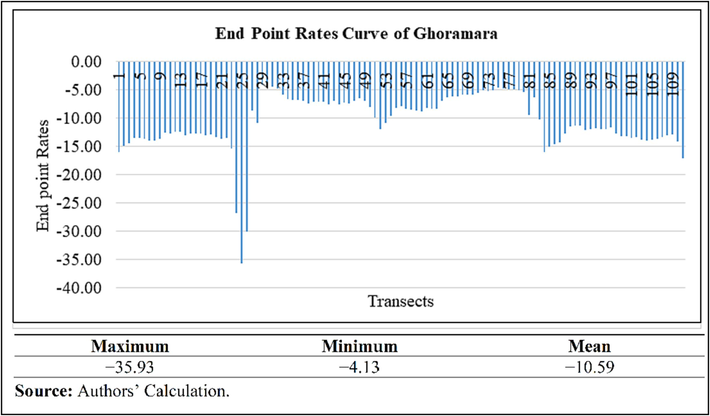
End Point Rate curve and its maximum, minimum, and mean changing values of Ghoramara island.
The following equation is shown as,
The study reveals a rapid erosion of Ghoramara Island's shoreline, with the early part showing a rate of up to 25 %. The middle part shows a significantly lower erosion rate, indicating variation in erosion rates. The rate of corrosion in this region is high, with a mean EPR of 10.59 and highest and minimum EPRs of −35.93 and −4.13 respectively. The EPR results are geographically emphasized on a map of the research region of Ghoramara Island, highlighting shoreline segments and directions where the coast has eroded to the greatest, middle, and smallest extents. From 1992 to 2022, the Northeastern, Northern, and Northwestern sides of the island saw the highest levels of erosion, while the Southern had some mild erosion. The least amount of erosion occurred at a few spots in the island's southern quarter, indicated by yellow transect lines. Ghoramara Island's displacement has been noticed since 1979, primarily due to rapid erosion on its northwest and marginal erosion on its southeast beaches. The study highlights the importance of understanding the erosion rate and its effects on Ghoramara Island's shoreline segments and directions.
3.2 Shoreline Change Envelope
The study's definition of the SCE statistical technique is the separation between shorelines at each transect that is closest to the baseline. At every shoreline location that was provided, the overall shift in coastal activities was predictable. Based on the baseline position, the rate of shore change has been measured (Ciritci and Türk, 2019; Dereli and Tercan, 2020; Oyedotun et al., 2018; Ozturk and Sesli, 2015). Using equation 2, which is denoted as Sd = df-dc, the function of the SCE is shown. df is the change in the distance between the baseline and the furthest shoreline at an assumed location, where Sd is the change in shoreline distance (meters). The Transect (xn) dc is the measurement at the same transect above between the baseline and the closest shoreline (xn). Fig. 6 shows SCE for the research region and the separations between the baseline and furthest away shorelines, showcasing the overall change in shoreline movement between 1972 and 2022. The northern part of Ghoramara Island experienced a significant shift inshore, spanning from 676 to 855 m, with deep blue-colored transact lines indicating this change. The range of 311–675 m change, indicated by red, dip green, and yellow-colored transect lines, moderated to sever over the Northwestern and southern shoreline. The least alteration occurred on the western and southeast coasts of Ghoramara Island, indicated by orange transect lines.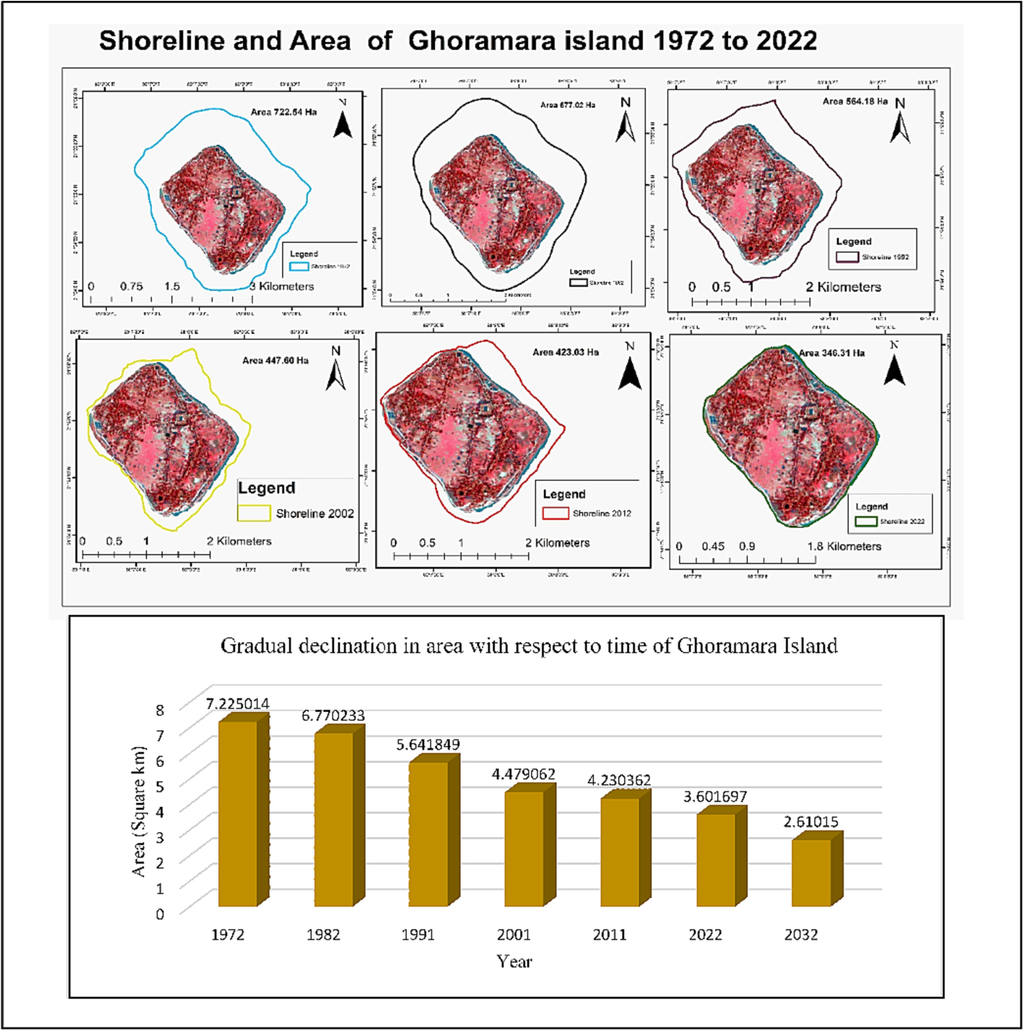
Shifting Coastline areas of Ghoramara island- 1972, 1982, 1992, 2002, 2012, and 2022.
3.3 Sea-level change relative
The Enduring Facility of the Mean Sea Level which is PSMSL, a global source of tide gauge records, provides statistics for the current inquiry. Established in 1933, the RLR records help track long-term changes in sea level (SL) and provide a trustworthy database of benchmark descriptions for each gauge. The Indian station Haldia, located near Ghoramara Island, has been used for the study due to its RLR records. The data spans over 50 years and is used to calculate the yearly rate of change in SL at Ghoramara Island (Fig. 7). The data shows dramatic changes in SL, with a mean value of 7055.69 mm and a range from lowermost in 1972 to greatest in 2013. The size of the research area on Ghoramara Island was significantly impacted by the change in SL between 1948 and 2013. Between 1967 and 2008, Ghoramara Island experienced a period of rampant erosion, losing around 4 km2.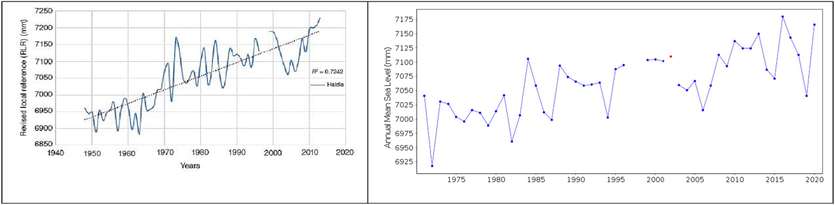
Temporal changes in annual sea level (1948–2019) at the Haldia station. Source: Based on Revised Local Reference (RLR) Diagram for Haldia, Haldia Tidal Gauge Station, Station ID:1270, Longitude 88.07°East, Latitude21.95°North (National Oceanography Centre, 2023).
3.4 Area-wise extent of erosion
The study uses GIS to determine the area of Ghoramara Island from 1972 to 2022. A polygon is generated along the land–water borderline for each year, generating the island's area and perimeter. The research area's annual areal change is determined, showing both positive and negative changes. The area change was primarily negative in 2002, indicating the worst erosion. However, 2012 saw the least area change (-0.2487), indicating a slower rate of erosion. The study also found that the area change was primarily negative (-1.162787 km2) in 2002, indicating the worst erosion. The study highlights the ongoing erosion of Ghoramara Island's shorelines from 1972 to 2022 (Fig. 6). The study reveals significant changes in Ghoramara Island's area from 1972 to 2022, including coastal erosion. The largest area was 7.225014 km2, with the largest change occurring between 1992 and 2002. The study also considers minimal changes between 2002 and 2012 due to less erosion. Total area changes from 1972 to 2022 was 3.62 km2 due to coastal erosion. The combined coastline analysis by year shows that erosion occurred over the years, resulting in a shift or modification of the island's shoreline. The shape of Ghoramara Island changed steadily from 1972 to 2022, with the shoreline rapidly changing between 1992 and 2002, mainly on the island's Northwestern and Southeastern sides. The study highlights the rapid change in the island's shape due to erosion.
3.5 Prediction of shoreline change rate
According to the amount of change throughout time, the EPR model is a key technique employed in the present study to forecast changes on the Shore of Ghoramara Island. Only the shorelines from the years 1972 and 2022 were used in this study to anticipate the shoreline for the year 2032 using the EPR model.
Source: Authors’ Calculation.
Year
Perimeter(km)
Area (Km2)
Change in Area (An + 1 − An)
Details
1972
10.261788
7.225014
Erosion
1982
9.680761
6.770233
−0.454781
Erosion
1992
8.672840
5.641849
−1.128384
Erosion
2002
8.525617
4.479062
−1.162787
Erosion
2012
8.181207
4.230362
−0.2487
Erosion
2022
7.420687
3.601697
−0628665
Erosion
2032
6.977026
2.61015
−0991545
predicted Erosion
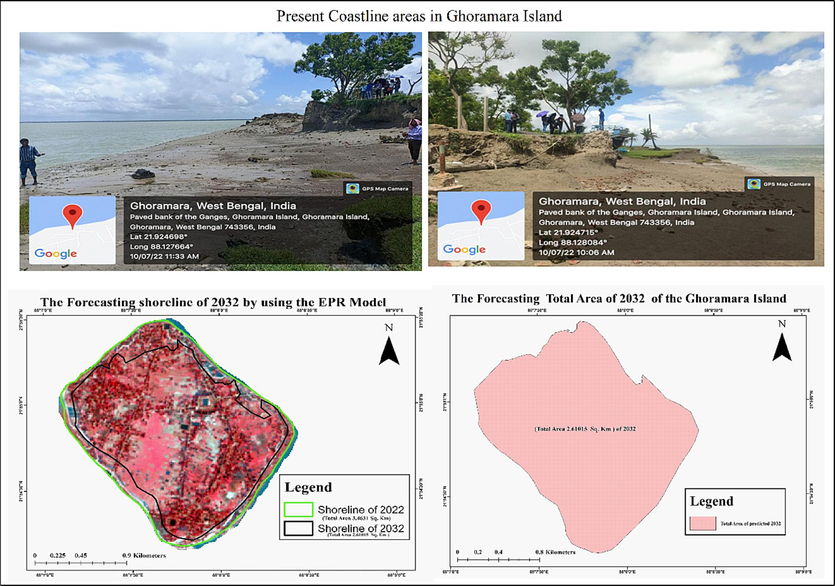
Present situation of shoreline at Ghoramara, and its forecast of area, and perimeter changes in 2032.
4 Discussion
The significance of comprehending the erosion rate and its consequences on the coastal segments and directions of Ghoramara Island is emphasized in the study. The study shows that the shoreline is rapidly eroding, with early erosion reaching up to 25 percent. The Northeastern, Northern, and Northwestern parts of the region had the most erosion, while the center region exhibited a lesser rate. The study examines the area and perimeter of Ghoramara Island between 1972 and 2022 using GIS. The worst erosion was indicated in 2002 when the area change was predominantly negative. The shorelines of the island have also undergone substantial modifications, with the biggest changes taking place between 1992 and 2002, according to the study. The coastline change rate for 2032 was estimated using the EPR model, showing larger retreats over the majority of the island's shoreline. The results of this study can be used for resilient planning and adaptive policy development. Some of the recent studies on West Bengal (Mondal et al., 2020; Nath et al., 2021a, b; Nath et al., 2022), Odisha (Jangir et al., 2016; Baral et al., 2018; Kar et al., 2021), and Tamil Nadu (Thomas et al., 2023) coastlines have resulted out shoreline changes and associated coastal hazard scenarios. Ghoramara Island's geomorphology is being influenced by the erosion of its coastline, which began in 1972 and continued until 1979. Human activities and natural events are altering the estuarine hydrodynamics on the Hugli estuary, affecting the island's shape. The island's freshwater supply was once abundant, but geological upheaval caused the river Hugli to shift east, leading to a significant drop in flow and an estuarine water shortage, causing severe damage and siltation of navigation channels. Ghoramara Island, once home to around 4,000 people, experienced a decline in population due to deteriorating land use, land cover, and reduced uncultivated and cultivated areas. The island's cyclical expansion, as evidenced by the sinking of Lohachara in 2016, necessitated a comprehensive understanding of coastal processes for restoration efforts and new preventative measures. Between 2001 and 2011, the island's population decreased from 5236 to 5139 (Census of India, 2011). The island's deterioration began in 2001 due to shrinkage and shoreline erosion, prompting locals to relocate, similar to the situation with Lochachar. Increased vegetation cover, such as mangroves, Caesarians, and bamboo, is necessary for the island to stop erosion. In densely vegetated areas beside rivers, the rapidity distribution throughout the river profile is impacted, resulting in a decrease in flow rapidity. Floodwaters still spill over even when there is forested vegetation along the banks of rivers or in naturally occurring river channels. Because of damaged bank areas, Ghoramara Island's vegetated portion may also experience coastal erosion.
5 Conclusion
The study utilizes satellite imagery from Landsat TM and Landsat OLI/TIRS to evaluate shoreline dynamics and morphologies. The net area change surrounding Ghoramara Island is computed using the DSAS 5.1 tool in conjunction with the EPR and SCE models. The shoreline of Ghoramara Island is rapidly eroding, with early studies indicating a rate of up to one-fourth of a percentage. While there is some minor erosion in the southern portion, the pace in the middle is noticeably lower. The study highlights how crucial it is to comprehend the erosion rate and how it affects the shoreline segments and directions of Ghoramara Island. The entire change in coastal activities between 1972 and 2022 was measured using the Shoreline Change Envelope statistical approach. The analysis shows that between 1972 and 2022, there were notable changes in the area of Ghoramara Island, including coastline erosion. An estimated shoreline of 3.62 km2 is predicted by the EPR model. Utilizing satellite imagery and computational techniques, the shoreline surrounding Ghoramara Island has been reconstructed. This has shown that the island's environs are eroding more quickly than the island itself, with endpoint forecasts demonstrating a notable decline throughout the entire island. Additional investigation into the subject matter indicates that physical processes such as deflation, tidal currents, wave action, and coastal currents are known to occur and are predictive variables for coastal erosion as well and anthropogenic activities also adversely impact the changes in the shoreline of the study area.
Disclosure of funding
Deep thanks and gratitude to the Researchers Supporting Project number (RSP2024R351), King Saud University, Riyadh, Saudi Arabia for funding this research article. The authors would also like to extend the thanks and appreciation to the Indian Council of Social Science Research (ICSSR-MOST (Taiwan)/RP-1/2022-1C) for providing the financial support, and appreciation to Netaji Subhas Open University for ensuring supportive research facilities for the research work.
Data availability statement
Due to the nature of this research, participants of this study did not agree for their data to be shared publicly, so supporting data is not available.
Acknowledgment
Deep thanks and gratitude to the Researchers Supporting Project number (RSP2024R351), King Saud University, Riyadh, Saudi Arabia for funding this research article.
Declaration of competing interest
The authors declare that they have no known competing financial interests or personal relationships that could have appeared to influence the work reported in this paper.
References
- Morphological change study of Ghoramara Island, Eastern India using multi temporal satellite data. Res. J. Recent Sci.. 2012;1(10):72-81.
- [Google Scholar]
- Sagar Island: Some environmental problems and man (in Bengali) Visvabiksha.. 1996;5(2):24-37.
- [Google Scholar]
- Shoreline change analysis at Chilika Lagoon Coast, India using digital shoreline analysis system. J. Indian Soc. Remote Sens.. 2018;46(10):1637-1644.
- [CrossRef] [Google Scholar]
- Towards routine mapping of shallow bathymetry in environments with variable turbidity: Contribution of Sentinel-2A/B satellites mission. Remote Sens.. 2020;12(3):451.
- [CrossRef] [Google Scholar]
- Coastal erosion in China under the condition of global climate change and measures for its prevention. Prog. Nat. Sci.. 2009;19(4):415-426.
- [CrossRef] [Google Scholar]
- Integrating remote sensing and GIS techniques for monitoring and modeling shoreline evolution to support coastal risk management. Gisci Remote Sens.. 2018;55(3):355-375.
- [CrossRef] [Google Scholar]
- Census of India, 2011. District Census Handbook South Twenty Four Parganas. Village and Town Wise Primary Census Abstract (PCA). Directorate of Census Operations, West Bengal, Series-20, Part XII-B. https://censusindia.gov.in/nada/index.php/catalog/1363.
- Central Water commission, 2022. Anunal Report 2021-2022. https://cwc.gov.in/sites/default/files/annual-report-21-22.pdf.
- Automatic detection of shoreline change by geographical information system (GIS) and remote sensing in the Göksu Delta, Turkey. J. Indian Soc. Remote. Sens.. 2019;47:233-243.
- [CrossRef] [Google Scholar]
- On forecasting future US shoreline positions: a test of algorithms. J. Coast. Res. 1997:1245-1255.
- [Google Scholar]
- Department of Environment, 2010. Integrated coastal zone management project. Department of Environment, Government of West Bengal. http://www.iczmpwb.org/main/coastal_erosion.php.
- Assessment of shoreline changes using historical satellite images and geospatial analysis along the Lake Salda in Turkey. Earth Sci. Inform.. 2020;13(3):709-718.
- [CrossRef] [Google Scholar]
- Emily A., Himmelstoss, R. E., 2021. Digital Shoreline Analysis System (DSAS) Version 5.1User Guide. Reston, Virginia: U.S. Geological Survey. https://pubs.er.usgs.gov/publication/ofr20211091.
- Shoreline transformation study of Karnataka coast: geospatial approach. Aquat. Procedia. 2015;4:151-156.
- [CrossRef] [Google Scholar]
- Delineation of spatio-temporal changes of shoreline and geomorphological features of Odisha coast of India using remote sensing and GIS techniques. Nat. Hazards. 2016;82:1437-1455.
- [CrossRef] [Google Scholar]
- Coastal geomorphological and land-use and land-cover study of Sagar Island, Bay of Bengal (India) using remotely sensed data. Int. J. Remote Sens.. 2006;27(17):3671-3682.
- [Google Scholar]
- Shoreline change along Odisha coast using statistical and geo-spatial techniques. J. Earth Syst. Sci.. 2021;130:1-20.
- [CrossRef] [Google Scholar]
- Automatic detection of shoreline change on coastal Ramsar wetlands of Turkey. Ocean Eng.. 2011;38(10):1141-1149.
- [CrossRef] [Google Scholar]
- Shifting shoreline of Sagar island delta, India. J. Maps. 2014;10(4):612-619.
- [CrossRef] [Google Scholar]
- Shoreline change analysis along the coast of South Gujarat, India, using digital shoreline analysis system. J. Indian Soc. Remote Sens.. 2014;42:869-876.
- [Google Scholar]
- Shoreline change analysis and its application to prediction: a remote sensing and statistics based approach. Mar. Geol.. 2009;257(1–4):11-23.
- [CrossRef] [Google Scholar]
- Concepts and science for coastal erosion management–An introduction to the Conscience framework. Ocean Coast. Manage.. 2011;54(12):859-866.
- [CrossRef] [Google Scholar]
- Spatio-temporal modelling of shoreline migration in Sagar Island, West Bengal, India. J. Coast. Conserv.. 2020;24:1-20.
- [CrossRef] [Google Scholar]
- Automatic shoreline detection and future prediction: a case study on Puri Coast, Bay of Bengal, India. Eur. J. Remote Sens.. 2012;45(1):201-213.
- [CrossRef] [Google Scholar]
- Shoreline shifting and its prediction using remote sensing and GIS techniques: a case study of Sagar Island, West Bengal (India) J. Coast. Conserv.. 2016;20:61-80.
- [CrossRef] [Google Scholar]
- Shoreline change detection using DSAS technique: Case of North Sinai coast, Egypt. Mar. Georesources Geotechnol.. 2019;37(1):81-95.
- [CrossRef] [Google Scholar]
- Identification of the coastal hazard zone between the areas of Rasulpur and Subarnarekha estuary, east coast of India using multi-criteria evaluation method. Model. Earth Syst. Environ.. 2021;7:2251-2265.
- [CrossRef] [Google Scholar]
- Evaluation of long-term shoreline changes between Rasulpur and Subarnarekha estuary, east coast of India using remote sensing and GIS techniques. Modern Cartography Ser.. 2021;10:337-351.
- [CrossRef] [Google Scholar]
- Geospatial analysis of short term shoreline change behavior between Subarnarekha and Rasulpur estuary, east coast of India using intelligent techniques (DSAS) GeoJournal. 2022;1–21
- [CrossRef] [Google Scholar]
- National Oceanography Centre, 2023. Revised Local Reference (RLR) Diagram for HALDIA. European Way, Southampton and Liverpool, United Kingdom. https://www.psmsl.org/data/obtaining/rlr.diagrams/1270.php.
- Contemporary shoreline changes and consequences at a tropical coastal domain. Geol. Ecol. Landsc.. 2018;2(2):104-114.
- [CrossRef] [Google Scholar]
- Shoreline change analysis of the Kizilirmak Lagoon Series. Ocean Coast. Manage.. 2015;118:290-308.
- [CrossRef] [Google Scholar]
- Shoreline change monitoring for coastal zone management using multi-temporal Landsat data in Mahi River estuary, Gujarat State. Appl. Geomat.. 2021;13:333-347.
- [CrossRef] [Google Scholar]
- Threats from sea level rise and erosion: a case study of an estuarine inhabited Island Ghoramara, Hooghly Estuary. Urban Ecol. Global Climate Change. 2022;321–345
- [CrossRef] [Google Scholar]
- Saravanan, S., Parthasarathy, K.S.S., Vishnuprasath, S.R., 2019. Monitoring spatial and temporal scales of shoreline changes in the Cuddalore Region, India. In: Coastal Zone Management. Elsevier, pp. 99-112. https://doi.org/10.1016/B978-0-12-814350-6.00004-5.
- The United Nations High Commissioner for Refugees, 2023. Global Report 2021. UN General Assembly (UNGA). https://reporting.unhcr.org/global-report-202.
- Statistical analysis of shoreline change reveals erosion and baseline are increasing off the northern Tamil Nadu Coasts of India. Environ. Monit. Assess.. 2023;195(3):409.
- [CrossRef] [Google Scholar]
- United States Geological Survey, 2022. Landsat Missions. U.S. Department of the Interior. https://www.usgs.gov/landsat-missions.


