

Translate this page into:
Analysis of major and trace elements in teff (Eragrostis tef)
-
Received: ,
Accepted: ,
This article was originally published by Elsevier and was migrated to Scientific Scholar after the change of Publisher.
Peer review under responsibility of King Saud University.
Abstract
Teff (Eragrostis tef) is one of the principal cereals grown in Ethiopia. It is a gluten free grain and can be suitable for use in the diet of patients with celiac disease. Mineral content of teff is poorly characterized and considerable variations in the concentration of elements such as iron, magnesium, and calcium have been reported. Therefore, in an effort to determine major and trace elements content of E. tef, inductively coupled plasma mass spectrometry (ICP-MS) was used. In this study, 44 major and trace elements were detected and quantified in white and red teff varieties. The most abundant elements were K, P, Ca, Mg, Na, B, Al, and Fe. Trace amounts of Er, Eu, and Sb were also detected.
Keywords
Eragrostis tef
Trace elements
ICP-MS

1 Introduction
Teff (Eragrostis tef) has been used for centuries as one of the main sources of nutrient in Ethiopia. It is grown majorly in the central and northern part of the country. Teff is reported to have higher nutrition and fiber content as compared to cereals such as wheat, rice, oats, and barley (Gebremariam et al., 2014). In addition, it is a gluten free grain that could be suitable for use in the diet of patients with celiac disease (CD), a disorder that leads to gluten intolerance (Hopman et al., 2008, Spaenij-Dekking et al., 2005).
Trace elements play a vital role in proper functioning of enzymes through modulating reactions, constitute their active sites, stabilize their structure, and mediate oxidation-reduction process (Fraga, 2005, Ingrao et al., 1995). They also play an important role in the proper functioning of the immune system (Rolla et al., 1983). While several metals like Cu, Zn, and Fe are essential micronutrients, metals such as Cd and Pb, constitute non-essential and toxic elements (Luis-Gonzalez et al., 2015). Contamination of food by these metals commonly occur from sources such as municipal and industrial discharges, irrigation water, geogenic, agricultural imputes, pharmaceutical, and atmospheric sources (Gimou et al., 2014; Hajeb et al., 2014; He et al., 2005). Despite the fact that various studies on teff grain have been published, only limited data are available regarding its major and trace element contents. Moreover, the data reported for elements such as Fe, Mg, and Ca are not consistent and show great variations in literature. Therefore, the present study aimed at detecting and quantifying trace elements in E. tef using ICP-MS.
2 Material and methods
2.1 Sample collection
To represent the grain as normally obtained by the consumers, 10 samples (5 from each variety) were purchased from markets in Addis Ababa, Ethiopia.
2.2 Sample preparation
One g of each sample was grinded into powder in liquid nitrogen using a mortar and pistil. From the powder, 0.2 g was digested in a falcon tube with H2O2 and HNO3 (Vrček and Vinković Vrček, 2012). Briefly, 3 ml of H2O2 was added to the samples. The mixture was sonicated in a water bath for 10 min and vortexed. This step was repeated followed by the addition of 4.5 ml of 2% HNO3 to the samples. The mixture was further vortexed and kept in boiled water for 10 min. Finally, the samples were centrifuged and the supernatant was used for ICP-MS analysis.
2.3 Multielement analysis
Perkin-Elmer SciexElan 6000 quadrupole coupled plasma mass spectrometry (ICP-MS) operating in a dual detector mode was used for the analysis. Internal standard (In, Bi, and Sc) correction and blank subtraction was done. Calibration curve (a four point) was used to quantify the elements (0, 0.025, 0.050, and 0.100 µg/g for Na; 0, 0.25, 0.50, and 1.00 µg/g for Ca, Mg, Fe, K; 0, 0.005, 0.010, and 0.020 µg/g for the remaining elements). The sample uptake rate was adjusted to 1 mL/min with 35 sweeps per reading. Certified reference standards (whole rock powders; BE-N and DR-N available from the SARM laboratory at the (Centre de Recherches Pétrographiqueset Géologiques (CRPG)) were used to evaluate the accuracy of the analytical protocol.
3 Results and discussion
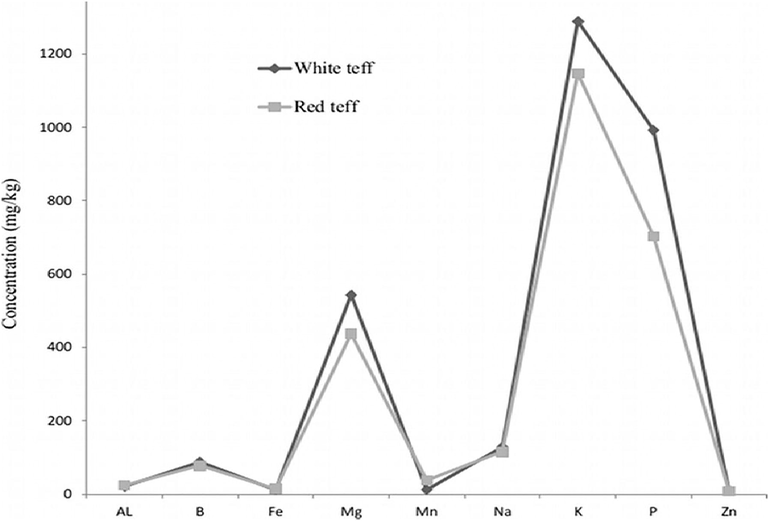
In the current study, a total of 44 elements were detected and quantified in teff grain samples (Table 1). The most abundant elements measured were K (1289 mg/kg), P (992 mg/kg), Ca (444 mg/kg), Mg (543 mg/kg), and Na (127 mg/kg) respectively (Fig. 1). The least abundant elements were Er, Eu, and Sb with a concentration of 0.001 mg/kg. While the number of major and trace elements detected and quantified using ICP-MS in this study represents the highest number of elements ever identified in E. tef, concentrations of few elements such as Fe and Mg have previously been reported in literature. Comparison of our result against the values reported in literature shows that the concentration of Fe in white (11 mg/kg) and red (14 mg/kg) teff varieties are comparable to concentrations reported for wheat (15 mg/kg) and corn (13 mg/kg) (Table 1). On the other hand, previous studies indicated that teff has the highest concentration (196 mg/kg) of Fe among cereals including wheat and corn (Mengesha, 1966). However, this conclusion was contradicted by a study done by Besrat et al. (1980), which suggested that soil contaminations contribute to the high Fe content observed in teff. Likewise, concentrations of Ba, Co, Ca, and Zn measured by ICP-MS in the current study were also lower than those previously reported in literature (Table 1). NANot available.
Analyte
DL (mg/kg)
White teff
Red teff
White teff
Red teff
Wheat
Corn
Concentration (mg/kg)
Aluminum (Al)
0.0002
20.80
24.21
0.12e
83e
6.2 ± 0.3 a
1.15d
Arsenic (As)
0.00006
0.34
0.16
0.00035f
NA
5.4 ± 0.4 a
0.006d
Boron (B)
0.002
87.41
77.67
13e
14e
0.62d
3.2d
Barium (Ba)
0.00003
2.12
3.63
23.5e
19e
2.04d
2.26 d
Calcium (Ca)
0.031
315
444
NA
NA
209.3 ± 10.1 a
434d
Cerium (Ce)
0.00003
0.04
0.21
NA
NA
<0.1 e
NA
Chromium (Cr)
0.00005
0.71
0.54
NA
NA
0.023c
0.08d
Cobalt (Co)
0.00003
0.05
0.05
0.64e
0.52e
6.6 ± 0.0 a
0.005d
Copper (Cu)
0.00003
1.65
1.64
0.043f
20.6 g
2.5 ± 0.3 a
2.54 d
Gallium (Ga)
0.00001
0.02
0.02
NA
NA
NA
NA
Iron (Fe)
0.0037
11.41
14.20
115e
196e
15.0 ± 1.8a
13.7d
Lanthanum (La)
0.00003
0.01
0.06
NA
NA
NA
NA
Lead (Pb)
0.00003
0.04
0.05
NA
NA
0.023c
0.122d
Lithium (Li)
0.00005
0.12
0.12
NA
NA
0.02b
NA
Magnesium (Mg)
0.002
543
437
0.005f
NA
360.7 ± 64.0a
787d
Manganese (Mn)
0.00003
12
38
NA
NA
9.4 ± 0.9 a
2.53d
Molybdenum (Mo)
0.00002
0.26
0.081
0.74e
0.78e
0.175b
0.255d
Niobium (Nb)
0.00004
0.01
0.01
NA
NA
NA
NA
Neodymium (Nd)
0.00003
0.01
0.07
NA
NA
NA
NA
Nickel (Ni)
0.00006
0.69
0.54
NA
NA
0.17c
0.14d
Osmium (Os)
0.00008
0.29
0.16
NA
NA
NA
NA
Palladium (Pd)
0.00001
0.02
0.01
NA
NA
NA
NA
Phosphorus (P)
0.005
992
703
NA
NA
2330d
158d
Potassium (K)
0.006
1289
1147
NA
NA
1172.9 ± 49.5 a
548d
Rubidium (Rb)
0.00004
0.73
1.79
NA
NA
2 c
NA
Selenium (Se)
0.0002
1.08
0.50
0.0009f
NA
0.067b
0.056d
Sodium (Na)
0.0005
127.85
115.43
212.2e
220e
17.0d
399d
Strontium (Sr)
0.00003
1.05
1.16
<0.1e
<0.1e
1.19c
4.56d
Titanium (Ti)
0.00009
0.30
0.51
NA
NA
0.001c
NA
Tin (Sn)
0.00009
0.23
0.04
NA
NA
0.032d
0.015d
Tungsten (W)
0.00009
0.05
0.02
NA
NA
NA
NA
Vanadium (V)
0.00005
1.17
0.59
NA
NA
1.1 ± 0.1 a
0.005d
Yttrium (Y)
0.00002
0.01
0.05
NA
NA
NA
NA
Zinc (Zn)
0.00008
9.58
8.71
0.27f
40.8 g
13.5 ± 0.7a
17.0d
Zirconium (Zr)
0.00009
0.04
0.03
NA
NA
NA
NA
Antimony (Sb)*
0.00001
1.00
1.00
NA
NA
0.2d
0.003d
Cadmium (Cd)*
0.00006
3.00
5.00
NA
NA
NA
27.50 a
Cesium (Cs)*
0.00002
2.00
3.00
NA
NA
12 e
NA
Dysprosium (Dy)*
0.00004
2.00
1.10
NA
NA
NA
NA
Erbium (Er)*
0.00004
1.00
6.00
NA
NA
NA
NA
Europium (Eu)*
0.00003
1.00
4.00
NA
NA
0.7e
NA
Gadolinium (Gd)*
0.00003
3.00
1.30
NA
NA
<220e
NA
Hafnium (Hf)*
0.00005
2.00
1.00
NA
NA
<11
NA
Samarium (Sm)*
0.00004
3.00
20.00
NA
NA
NA
NA
Selected element content in white and red teff grain.
According to Kibatu et al., concentration of iron is found to be 16.05 ± 1.63 (mg/100 g dry weight) in white teff (Kibatu et al., 2017) as measured by portable total X-ray fluorescence spectrometer (PTXRF). Similarly the previously reported concentrations of B in both white and red teff varieties and Al in white teff however, were less than the values we measured in this study. According to Abebe et al., Fe, Ca, and Zn contents of red teff were 37.7, 124, and 2.8 (mg/100 g) respectively, while their concentration in white teff were 150, 155, and 4.02 (mg/100 g) respectively (Abebe et al., 2007); these values are comparable with the concentrations we measured and lower than the values that were reported by Mengesha (Mengesha, 1966).
The elements concentration ranges observed among literature could be due to a number of factors, including the local environment (soil, pH, organic matter, water, and contaminants), and instrument differences both in sensitivity and accuracy. In addition, sample variations plays a role as the grain shows considerable diversity in terms of agronomic, genetic, and morphological characters (Assefa et al., 2015; Espelund et al., 2000). On the other hand, the values we obtained using ICP-MS agree reasonably well with the figures reported for wheat and corn standard samples (Table 1). Based on their overall abundance and their detection in other grains (corn and wheat), these trace elements appear to be normal constituents of teff but have not been previously reported. Since ICP-MS is a method of choice for the identification and quantification of trace metals in a biological sample, it is reasonable to accept the values derived via this instrument over those measured by other analytical tools (Benkhedda et al., 2000, Heitland and Koster, 2006).
4 Conclusions
In the current study we were able to identify and quantify a total of 44 major and trace elements in teff grain samples. This number represents the highest number of major and trace elements ever detected and quantified in teff grain. As this study, however, was conducted on a limited sample size, extensive study covering samples collected from the different teff growing areas in the country should be conducted in order to establish the level of major and trace elements in the grain.
Acknowledgements
The Author wish to thank Mr. Wondater Teklemariam for sample collection, Mr. Guangcheng Chen, Geochem Technician, Department of Earth Sciences and Atmospheric Sciences, University of Alberta, Canada for the ICP-MS instrumentation, and Dr. Ephrem D. Zegeye for his constructive comments on the manuscript.
References
- Phytate, zinc, iron and calcium content of selected raw and prepared foods consumed in rural Sidama, Southern Ethiopia, and implications for bioavailability. J. Food Compos. Anal.. 2007;20:161-168.
- [Google Scholar]
- Genetic diversity in tef [Eragrostis tef (Zucc.) Trotter] Front. Plant Sci.. 2015;6:177.
- [Google Scholar]
- Trace metal analysis of natural waters and biological samples by axial inductively coupled plasma time of flight mass spectrometry (ICP-TOFMS) with flow injection on-line adsorption preconcentration using a knotted reactor. J. Anal. At. Spectrom.. 2000;15:1349-1356.
- [Google Scholar]
- Critical study of the iron content of TEF (Eragrostis tef) Ethiop. Med. J.. 1980;18:45-52.
- [Google Scholar]
- Cynthia, B.E.P., Perkin, E., 2014. The Determination of Toxic, Essential, and Nutritional Elements in Food Matrices Using the NexION 300/350 ICP-MS. Waltham, MA 02451 USA.
- A Molecular Genetic Analysis of Eragrostis Tef (Zucc.) Trotter:non-Coding Regions of Chloroplast DNA, 18S rDNA and the Transcription Factor VP1. Hereditas. 2000;132:193-202.
- [Google Scholar]
- Relevance, essentiality and toxicity of trace elements in human health. Mol. Asp. Med.. 2005;26:235-244.
- [Google Scholar]
- Teff (Eragrostis tef) as a raw material for malting, brewing and manufacturing of gluten-free foods and beverages: a review. J. Food Sci. Technol.. 2014;51:2881-2895.
- [Google Scholar]
- Toxic elements in food: occurrence, binding, and reduction approaches. Compr. Rev. Food Sci. Food Saf.. 2014;13:457-472.
- [Google Scholar]
- Trace elements in agroecosystems and impacts on the environment. J. Trace Elem. Med. Biol.. 2005;19:125-140.
- [Google Scholar]
- Determination of major, minor and trace elements in Tef using portable total x-ray fluorescence (TXRF) spectrometer. EC Nutr.. 2017;9(1):51-59.
- [Google Scholar]
- Dietary exposure and health risk assessment for 14 toxic and essential trace elements in Yaounde: the Cameroonian total diet study. Food Addit. Contam. Part A, Chem. Anal. Control Exposure Risk Assess.. 2014;31:1064-1080.
- [Google Scholar]
- Biomonitoring of 37 trace elements in blood samples from inhabitants of northern Germany by ICP-MS. J. Trace Elem. Med. Biol.. 2006;20:253-262.
- [Google Scholar]
- Tef in the diet of celiac patients in The Netherlands. Scand. J. Gastroenterol.. 2008;43:277-282.
- [Google Scholar]
- Trace elements: biological role and nutritional aspects for humans. Ann. Ist. Super. Sanita. 1995;31:275-281.
- [Google Scholar]
- Essential and toxic metals in taros (Colocasia esculenta) cultivated in the Canary Islands (Spain): evaluation of content and estimate of daily intake. Environ. Monit. Assess.. 2015;187:4138.
- [Google Scholar]
- Chemical composition of teff (Eragrostis tef) compared with that of wheat, barley and grain sorghum. Econ. Bot.. 1966;20:268-273.
- [Google Scholar]
- Identification of IgA, IgG, lysozyme, albumin, alpha-amylase and glucosyltransferase in the protein layer adsorbed to hydroxyapatite from whole saliva. Scand. J. Dent. Res.. 1983;91:186-190.
- [Google Scholar]
- Metals in organic and conventional wheat flours determined by an optimised and validated ICP-MS method. Int. J. Food Sci. Technol.. 2012;47:1777-1783.
- [Google Scholar]
- Determining mineral elements in four kinds of grains from Beijing market by ICP-MS simultaneously. J. Saudi Chem. Soc.. 2012;16:31-33.
- [Google Scholar]


