

Translate this page into:
Analysis of aflatoxins in foods retailed in Saudi Arabia using immunoaffinity column cleanup and high-performance liquid chromatography-fluorescence detection
⁎Corresponding authors. naalfaris@pnu.edu.sa (Nora Abdullah AlFaris), swabaidur@ksu.edu.sa (Saikh M. Wabaidur)
-
Received: ,
Accepted: ,
This article was originally published by Elsevier and was migrated to Scientific Scholar after the change of Publisher.
Peer review under responsibility of King Saud University.
Abstract
A liquid–liquid extraction based high performance liquid chromatography-fluorescence method has been proposed for the quantitation of naturally producing aflatoxins in nuts and nut based products. Aflatoxins extraction from nuts and nut products was involved methanol – water extraction, immunoaffinity column cleanup followed by post column derivatization technique. The gel contents of monoclonal antibody of the column are very specific to the toxins of interest, which makes the extraction experiment rapid, simple, highly specific and sensitive. Additionally, the improve concentration of toxins from complex nuts and nut product matrices helps to reduced chromatography interference and lower limit of detection. The proposed method was authenticated to evaluate the performance in terms of linearity of the calibration, limit of detection, recovery, run-to-run (repeatability) and day-to-day precision (reproducibility). Good quality parameters with LOD between 0.003 and 0.007 ppb, recovery from 89 to 98%, linearity in the range of 0.02 to 100 ppb (r2 > 0.989) and precisions with RSDs were achieved below 4.5% at concentration level of 1.0 and 30.0 ppb. The developed method was effectively used to the analysis of aflatoxins (AFB1, AFB2, AFG1, and AFG2) in twenty nuts and nut products and were found up to 120.1 ng/mL AFB1 and 11.2 ppb AFB2 in few of the samples.
Keywords
Liquid chromatography
Fluorescence detector
Aflatoxins
Nuts and nut products

1 Introduction
Aflatoxins (AFs) are toxic chemicals that are generated by a variety of fungi and responsible for variety of food contamination (Paterson and Lima, 2010). AFs, which are naturally grow in the food, are AFB1, AFB2, AFG1, and AFG2 (Iqbal et al., 2011). The main fungi, Aspergillus, Aspergillus flavus and Aspergillus nominus are primarily responsible for producing these mycotoxins in the food and food products (El-Nagerabi et al., 2013; Hepsag et al., 2014). Among the various food stuffs, AFs have commonly been found to contaminate various dry fruits, such as, peanuts, almond etc. (Leong et al., 2010). In addition, the nuts and nut products is consumed not only as raw or roasted, but also for a number of nut products including peanut butter and peanut flour as well as few other products. All these food products also very sensitive to AFs contamination due to harvest, curing, transportation and storage. Because during the harvesting of dry food stuffs, the random tropical conditions including high temperatures, moisture, unseasonal rainfalls, monsoons, and floods help to fungal growth of AFs (Trucksess and Scott, 2008). All these tropical conditions are beyond the control limit of human, so the AFs contamination chances are very high. However, the inexperienced harvesting procedures, inadequate knowledge of storing, marketing and lack of ideal transport contribute profoundly to fungal growth and upsurge the risk of AFs contamination (Bhat and Vasanthi, 2003) and that can be control by proper handling the aforementioned man made risk factors.
The ingestion of these AFs polluted foods directly or from indirect ingesting of foods earlier exposed with AFs are the primary pathway of AFs exposure in human body. The exposure of AFB1 and mixture of AFs in human body can cause cancer since they are consider as group 1 carcinogen and it has been proved by IARC Health (World Health Organization, 2002; Marchese et al., 2018). The order of toxicological level of AFs can be expressed as AFB1 > AFG1 > AFB2 > AFG2 (Erkmen and Bozoglu, 2008). However, most importantly the level of AFs in contaminated foods could not be decrease by home cooking using microwave or conventional gas oven cookery (Midio et al., 2001). Therefore, it is almost impossible to remove the contaminated AFs from dry fruits and their products as they need very low level of heating process before consumed. Consequently, to avoid any AFs exposure and their vital adverse consequence towards humanity, it is highly demanded to develop a simple, sensitive and quantitative monitoring procedure to analyze AFs levels in dry fruits and fruit products.
Many analytical methodologies have been reported for the analysis and control of AFs in various environmental and agricultural fields (Iqbal et al., 2011; Sani et al., 2010). In our previous research we have analyzed and reported the AFs levels in non-alcoholic beer samples of various brands (Khan et al., 2013). Among the dry fruits, nuts and nuts product are the commodities, which shows highest risk of AFs contamination and serious health hazards (Francisco das Chagas et al., 2000). Hence, in the present research work AFs contamination levels in various nuts and nut-based products gathered from retail market (Riyadh, Saudi Arabia) has been analyzed and their respective contamination levels were determined. The contamination levels were found to be high for the analyzed samples may be due to hot climate of Saudi Arabia (Trucksess and Scott, 2008).
2 Experimental
2.1 Chemicals and material
HPLC status solvents were used during the experiments and were procured from Chemical Company (BDH, Poole, England). Formic acid was obtained from Panreac chemicals (Barcelona, Spain). Milli-Q water purification system of Millipore (Bedford, MA, USA) was used for water purification. Standard of aflatoxins were acquired from Fermentek Chemical Company (Jerusalem, Israel). The chemical structures of the studied AFs are shown in Fig. 1. Stock solutions of individual AFB1, AFB2, AFG1, and AFG2 of concentration 1000 ng/mL were made in acetonitrile (ACN) followed by proper dilution for further experiments. Standard solutions of aflatoxins of different concentration levels (0.005–100 ng/mL) were prepared by weight for the construction of calibration plots. All the standards and real samples were filtered through a PVDF (polyvinyl difluoride) syringe filter, 0.22 µm before injecting to the system.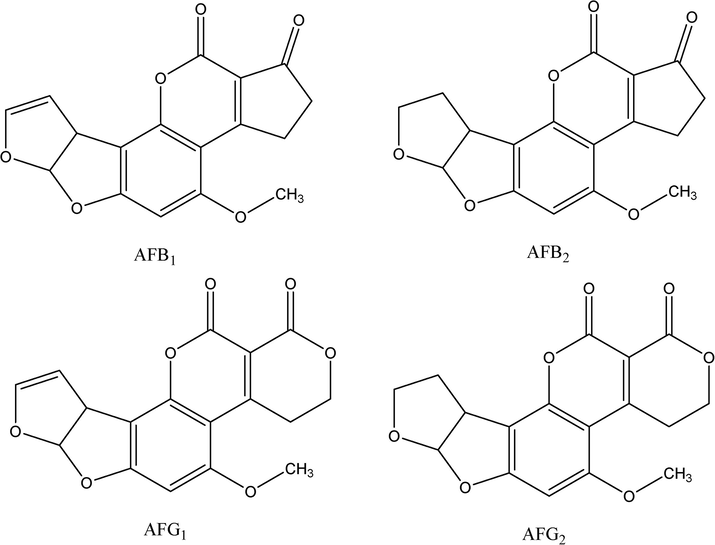
The chemical structures of the studied AFs.
2.2 Instrumentation
A mixing blender with a one-liter container was bought from local electronic market and a vacuum manifold manufactured by Agilent Technologies (Santa Clara, CA, USA) were used during the experiment. Alfaprep® immunoaffinity column (R-Biopharm Rhone Ltd, Glassgow, Scottland) was used for solvent extraction and cleanup. The chromatographic separations of AFs were performed on Agilent 1100 series HPLC system equipped with an isocratic pump (model G1310A), a degasser (G1379A), an auto-sampler (G1313A), a column oven (G1316A) and a fluorescence detector (G1321A) manufactured by Agilent Technologies. A Zorbax® 5 µm Eclipse-XDB-C18 80 Å of dimension 150 × 4.6 mm column (obtained from Agilent Technologies) was used to perform the chromatographic separations of AFs. Post-column derivatizations of the target compounds were performed with electrochemically produced bromine in Cobra cell using Coring System Diagnostics GmbH (Gernsheim, Germany) using a polytetrafluoroethylene reaction tubing of i.d. 340 × 0.5 mm.
2.3 Sample collection
Twenty cereals, nuts and their derivatives were analyzed for AFs determination. Fig. 2 shows few examples of analyzed nuts and nuts product samples. Each samples of about 250 g for packed and 500 g for unpacked were purchased arbitrarily from retail markets, groceries and supermarkets in Riyadh province of Saudi Arabia between January 2018 to August 2018. The samples were transferred to the research laboratory using an insulated container until analyzed. All food samples were grounded using mixing blender to prepare a uniform particle size and were stowed inside a refrigerator with a glass container until further analysis.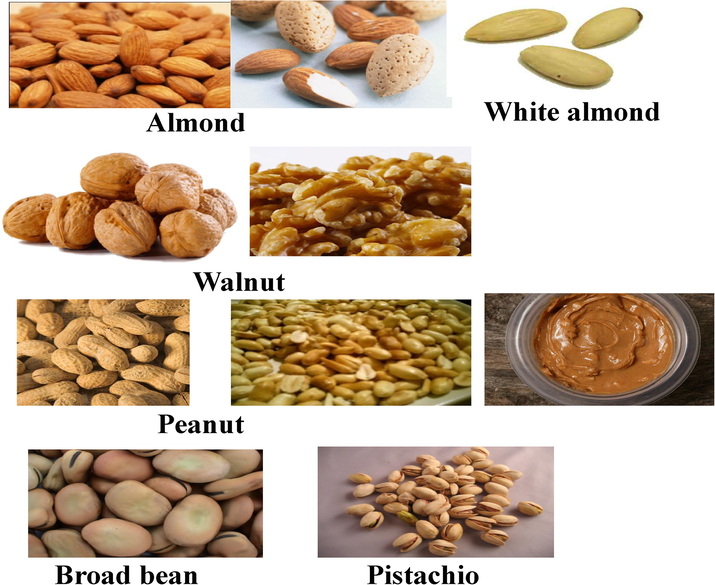
A Few analyzed nuts and nuts product samples.
2.4 Working solution preparation
Stock standards of aflatoxins mix was diluted to obtain final concentration of 100 ng/mL for individuals AFB1, AFB2, AFG1, and AFG2. The dilution was made using analytical grade methanol. The intermediate mixture solution was used to prepare a series of working standards of concentration 0.005, 0.02, 0.2, 1.0, 5.0, 20.0, 50.0 and 100 ng/mL. All these solutions were freshly prepared in optimized mobile phase which was comprising of water and methanol (30:70, v/v).
2.5 Extraction and cleanup
AOAC Official Method 999.31 was followed for extraction and clean-up of AFs from nuts and nut products samples (Trucksess et al., 1991). The reported method involves methanol – water extraction, immunoaffinity column (Alfaprep®, R-Biopharm Rhone Ltd, Glassgow, Scottland) cleanup and post column derivatization. Briefly the method could be explained as, in a blender jar 25 g of nuts and nut products sample was weighed then 5 g of sodium chloride and 125 ml of extraction solvent (70: 30, methanol: water; v/v) were added and blend exactly for 2 min at high speed followed by filter through the fluted filter paper. Pipette 15 ml of the aliquot of filtrate in a conical flask and add 30 ml of water with vigorous shaken and filtered through Whatman glass microfiber filter (GF/A, 125 mm, England). Take 15 ml of this diluted filtrate and pass it through the affinity column for the cleanup procedure with some external pressure at a good flow rate of 2–3 ml/min. Wash the affinity column with 20 ml Milli-Q water and allow to dry by pushing air through it. AFs bound to the particular antibody of the affinity column were eluted passing methanol (1 ml) through the affinity column and procured in HPLC vials. Two minutes wait time was adapted for passing methanol in order to release the toxins from the antibodies that are present inside the affinity column. Then elute was diluted with 1 ml of Milli-Q water and stored at 5 °C until HPLC analysis was performed.
2.6 Chromatographic separations
A mixture of methanol and water was isocratically delivered through the analytical column (Zorbax® 5 µm Eclipse-XDB-C18 80 Å) and the optimum separation was accomplished with a binary mixture of mobile phase comprising 70:30 (methanol: water; v/v) and the flow rate was set at 1.2 ml/min. The fluorescence detector parameters including excitation (λex) and emission (λem) were fixed to the wavelength of 362 nm and 455 nm, respectively. The total run time of the analysis was 10 min and the peak retention were obtained at around 4.8, 5.7, 6.5 and 7.9 min. AFB1, AFB2, AFG1, and AFG2 were identified on the basis of retention times which were 4.8, 5.7, 6.5 and 7.9 min, respectively. The column temperature was maintained at 60 °C during the experiment for achieving the faster separation with low column backpressure. The sample injection volume to the HPLC system was 75 µL.
The quality parameters including linear range, sensitivity, percent recovery and precision of the described method were established before the AFs analysis in real samples. Eight-point calibration graph was plotted to investigate the linearity over the range of AFs concentration 0.005 to 100 ng/mL and the coefficient of determination (r2) was found to be greater than 0.989 for each AFs. The limit of detection (LOD) and limits of quantification (LOQ) of the analytical assay were determined by spiked AFs to the blank samples based on S/N ratio of 3:1 and 10:1, respectively. The recovery studies were performed by analysis five typical samples spiked with AFB1, AFB2, AFG1, and AFG2 mixture at two different levels of 1.0 and 30 ng/mL and the percent recoveries were calculated using the formula,
The run-to-run (repeatability) and day-to-day precision (reproducibility) of the current method was evaluated by five-replicated measurement of spiked samples at concentrations level of 1.0 and 30 ng/mL of the AFs on the same day and five consecutive days and were articulated in terms of relative standard deviation (RSD).
3 Results and discussion
3.1 Optimization of chromatography-fluorescence parameters
The higher separation efficiency, higher sensitivity and accuracy of the HPLC using fluorescence detection has already made the method most suitable and frequently used technique in analytical chemistry for aflatoxins identification. In the current study, the proposed immunoaffinity column cleanup technology and high-performance liquid chromatography-fluorescence (HPLC-FL) detection method enabled simultaneous quantitation of AFB1, AFB2, AFG1, and AFG2 aflatoxins. The detection of AFs was performed by set the fluorescence detector to an excitation wavelength at 362 nm (λex) and emission at 455 nm (λem). Fig. 3 shows the HPLC-FL chromatogram of standard sample of AFs (20 ng/mL). A reversed phase C18 column was successfully employed for the separation of target AFs and optimum separation was achieved with mixture of binary mobile phase of methanol/water (70/30, v/v) by delivered at isocratic elution mode. The flow rate has effect on the separation of target analyte, so it was optimized and 1.2 ml/min was chosen for further experiments. The fully porous particles of the column with highest loading of the analyte was offered the excellent peak intensity and resolutions. All four AFs were separated in 8 min and the baseline was achieved after this indicating that the 10 min of analysis time is sufficient for the analysis. Very sharp and symmetrical peaks were observed and no interfering peaks due to co-existing metabolites were noticed in the same retention window of the chromatogram confirming good selectivity of the applied method. The appearance of peak sequence were according to the degree of polarity of AFs (Abdel-Azeem et al., 2015). The peaks were eluted at retention time 4.8, 5.7, 6.5 and 7.9 min and were identified as AFB1, AFB2, AFG1, and AFG2, respectively (Fig. 3). The mobile phase compositions were showed strong effect both on retention time and peak intensity. In order to get interference free separation for quantitative analysis of AFs at very low level, appropriate eluent was flushed through the HPLC column repeatedly to remove if any remaining matrices retained in the column while stripping out the real samples.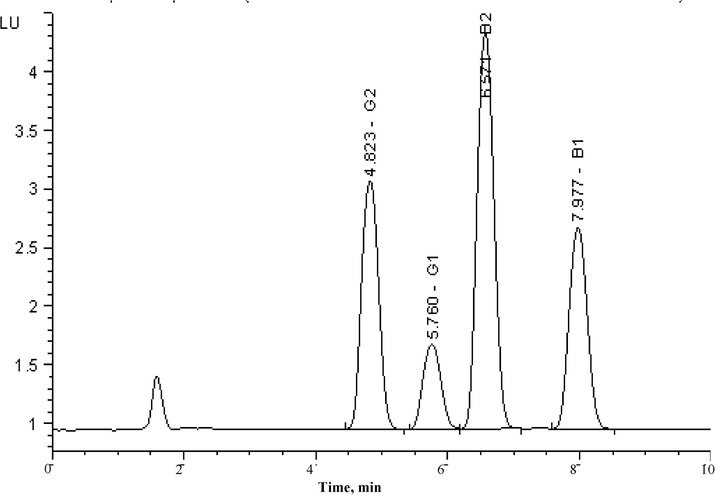
HPLC-FL chromatograms of aflatoxins standard of 20 ng/mL. The fluorescence detector conditions: 362 nm (λex) and 455 nm (λem), injection volume 75 µL.
3.2 Performance of the analytical method
Prior to the sample analysis for AFs determination, the developed method was evaluated in terms of different quality parameters including linearity, LOD, LOQ, precision (run-to-run and day-to-day). All the obtained values of validation parameters are enlisted in Table 1.
Aflatoxins
Range (ng/mL)
Regression line
Correlation coefficients (r2)
LODa (ng/mL)
LOQb (ng/mL)
Precisionc (RSD, %)
Slope
Intercept
run-to-run
day-to-day
AFB1
0.02–100.0
11.22
50.33
0.997
0.005
0.016
2.9
4.0
AFB2
0.02–100.0
8.16
2.93
0.998
0.003
0.011
2.7
4.5
AFG1
0.02–100.0
24.60
56.92
0.999
0.007
0.022
3.1
3.9
AFG2
0.02–100.0
12.60
2.08
0.989
0.004
0.014
2.5
4.2
To check the linear range of the proposed HPLC-FL method, an eight-point calibration curve was constructed using the concentration 0.005, 0.02, 0.2, 1.0, 5.0, 20.0, 50.0 and 100 ng/mL, which reveals excellent linearity for all four AFs. The linearity for AFs analysis was found to be in the range of 0.02–100 ng/mL with regression coefficient (r2) greater than 0.993 for each AF. The determinations of all the AFs were performed by comparing peak area with standard calibration curve.
The LOD and LOQ values for the proposed method were found to be in the range of 0.003–0.007 ng/mL and 0.011–0.022 ng/mL for all the analyzed AFs, respectively. These LOD and LOQ results are closer to those previously reported paper using the IAC techniques (Mably et al., 2005; Nakajima et al., 1999). The repeatability (run-to-run precision) of the applied method was evaluated by carried out five replicates extraction each at two concentration levels of 1.0 and 30.0 ng/mL AFs mixture. However, the reproducibility (day-to-day precision) of the described method was evaluated by performing 15 replicates extraction of the same solutions (1.0 and 30.0 ng/mL AFs mixture) across three consecutive days with five replicates for each AFs mixture per day. Excellent repeatability and reproducibility were obtained with RSDs below 4.5% in all cases. This indicates that the results are satisfactory and the method can be successfully applied for the accurate and routine analysis of AFs in nuts and nut products.
3.3 Analysis of AFs in nuts and nut products
The optimized HPLC-FL method was authinticat6ted by quantify AFB1, AFB2, AFG1, and AFG2 in the variety of nuts and nut products. Twenty cereals, nuts and their derivatives were analyzed and the obtained levels in the analyzed food samples have been shown in Table 2. The efficiency of the methanol – water extraction, immunoaffinity column (Alfaprep®, R-Biopharm Rhone Ltd, Glassgow, Scottland) cleanup and post column derivatization technique was evaluated by standard addition quantification method. During this, two non-fortified and four fortified real samples were analyzed in triplicate for each samples. The recoveries of AFs were found to be in the range of 89–98%. It was observed that the chromatograms of non-spiked and spiked nuts and nuts products samples indicating complete separation from other detectable constituents at the chosen wavelength. The levels of AFs were varied in each samples. Among all the analyzed samples, AFB2 and AFB1 were present in most of the nuts and nut products, and AFG2 and AFG1 were rarely found in the samples. In nuts samples, the highest concentrations of AFB1 and AFB2 were found in sample 7 (broad beans) of 120.1 ng/g and 11.2 ng/g, respectively. Only AFB1 was found at second highest level for the analyzed nuts of 68 ng/g (Sample 18). The levels of AFG1 were found only in two samples with the quantity of 0.46 ng/g (Sample 2) and 0.23 ng/g (Sample 3), where AFG2 was detected with the amount 0.11 ng/g and 0.1 ng/g in walnut (Sample 12) and almond sample (Sample 14), respectively. * Mean of each AFs in detected samples; ** Total of AFB1, AFB2, AFG1 and AFG2 in the detected samples.
Sample code
Samples name
AFB1 ± SD (% R)
AFB2 ± SD (%R)
AFG1 ± SD (%R)
AFG2 ± SD (%R)
Sample 1
Pistachio
0.59 ± 0.09 (97)
0.13 ± 0.03 (93)
– (90)
– (92)
Sample 2
Natural pistachio flavor
0.86 ± 0.11 (95)
0.13 ± 0.03 (91)
0.46 ± 0.07 (95)
– (90)
Sample 3
Almonds
0.47 ± 0.06 (98)
0.11 ± 0.02 (94)
0.23 ± 0.04 (97)
– (90)
Sample 4
Almonds
– (97)
– (89)
– (90)
– (91)
Sample 5
Broad beans
0.26 ± 0.05 (93)
0.92 ± 0.09 (95)
– (89)
– (94)
Sample 6
Broad beans
– (98)
0.21 ± 0.04 (97)
– (94)
– (94)
Sample 7
Broad beans
120.1 ± 0. 22 (93)
11.20 ± 0.10 (98)
– (97)
– (91)
Sample 8
Almonds
0.12 ± 0.02 (98)
0.83 ± 0.06 (90)
– (95)
– (91)
Sample 9
Almonds
0.56 ± 0.07 (97)
0.12 ± 0.04 (92)
– (95)
– (93)
Sample 10
White almonds
0.77 ± 0.10 (98)
0.14 ± 0.02 (95)
– (94)
– (90)
Sample 11
Almonds
– (97)
0.11 ± 0.03 (89)
– (94)
– (90)
Sample 12
Walnuts
– (95)
0.11 ± 0.02 (90)
– (95)
0.11 ± 0.02 (96)
Sample 13
Pistachio
– (95)
0.12 ± 0.03 (92)
– (92)
– (92)
Sample 14
Almonds
– (97)
– (93)
– (92)
0.10 ± 0.01 (97)
Sample 15
White almonds
– (92)
– (97)
– (91)
– (93)
Sample 16
Walnuts
– (89)
– (92)
– (94)
– (90)
Sample 17
Walnuts
– (92)
– (97)
– (94)
– (90)
Sample 18
Peanut
68.0 ± 0.23 (97)
– (93)
– (90)
– (93)
Sample 19
Peanut butter
54.0 ± 0.20 (96)
2.0 ± 0.10 (95)
– (97)
– (93)
Sample 20
Peanut butter
96.0 ± 0.29 (98)
17.6 ± 0.11 (90)
– (92)
– (93)
Total of each AFs
341.73
33.72
0.69
0.21
*Mean of each AFs
31.07
2.41
0.35
0.11
**Total AFs
376.35
In peanut butter the AFs, AFB1 were found in high contamination levels of 96.0 ng/g (Sample 20) and 54 ng/g (Sample 19), while the AFB2 were found to be 17.6 ng/g (Sample 20) and 2 ng/g (Sample 19). No other AFs were detected in the nuts product samples. The average quantity of AFB1, AFB2, AFG1, and AFG2 in the detected samples were 31.07, 2.41, 0.35 and 0.11 ng/g, respectively. Fig. 4 shows the typical chromatograms for broad beans (Sample 7), AFs-negative almond (sample 11) and white almond (sample 15) using 362 nm (λex) and 455 nm (λem). No detectable matrix peaks were observed in the chromatogram at the same retention time indicating interference free analysis of AFs. Additionally, the chromatogram of the raw nuts extract shows very weak signals in the respective retention time of each standard AFs.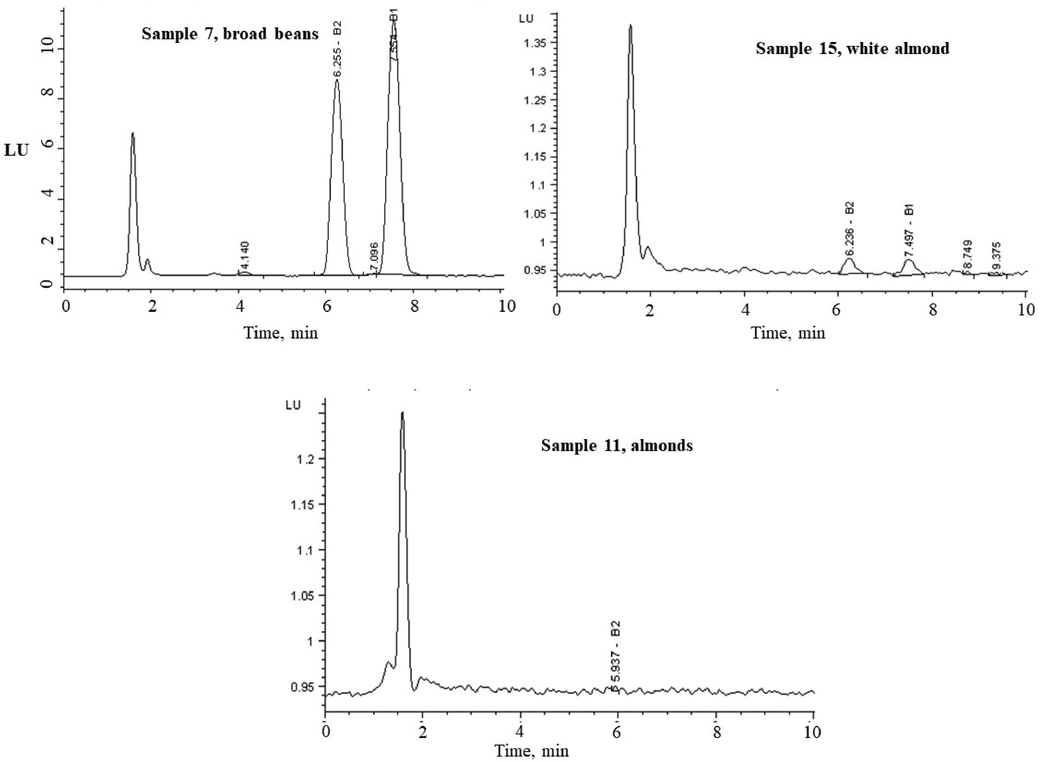
HPLC-FL chromatograms of aflatoxins in naturally occurring broad bean (sample 7); AFs-negative almond (sample 11) and white almond (sample 15). The fluorescence detector conditions: 362 nm (λex) and 455 nm (λem), injection volume 75 µL.
The recoveries of the analyzed AFs were obtained from the linear regression equation using slope of the added quantity versus the measured amount. The recoveries were found in the range of 89 to 98%. During the sample preparation step, the contradictory peak areas were recorded that comes for the sample matrices and the peaks were compared with the resulting chromatogram found for the remaining matrices. The area of contrasting peak was found to be higher than those obtained in the chromatogram demonstrating the high efficiency of immunoaffinity cleaning up.
4 Conclusion
A simple, efficient and remarkably sensitive liquid–liquid extraction based HPLC-FL detection method was developed to identify and determine AFB1, AFB2, AFG1, and AFG2 levels in nuts and nut products sold in Riyadh intended to human consumption. The developed HPLC-FL method involving methanol – water extraction, immunoaffinity column cleanup and post column derivatization. The extraction method showed excellent recovery for AFs even at trace levels and in the real sample of nuts and nut products the reveries were found to be 89–98%. Other quality parameters, such as, the LOD and LOQ values for the proposed method were in the range of 0.003 to 0.022 ng/mL for all the analyzed AFs. Twenty nuts and nut products were analyzed, and most of the sample shows contamination of AFB1 with highest level 120.1 ng/g (sample 7). The validation parameters of the proposed immunoaffinity cleanup and HPLC-FL approves that the method is highly sensitive, selective and reliable for AFs determination. The reported results in this research could be used to carry out an introductory risk assessment on AFs through nuts and nut products consumption. The results also indicate that the awareness of using AFs to the concerning people is necessary to provide healthy and AFs free foods.
Acknowledgement
This work was funded by the Deanship of Scientific Research at Princess Nourah bint Abdulrahman University, Riyadh, Saudi Arabia through the Research Groups Program Grant no. (RGP-1440-0021).
Declaration of Competing Interest
The authors declare that they have no known competing financial interests or personal relationships that could have appeared to influence the work reported in this paper.
References
- Ultra-high-pressure liquid chromatography–solid-phase clean-up for determining aflatoxins in Egyptian food commodities. J. Food Compos. Anal.. 2015;44:18-24.
- [Google Scholar]
- Bhat, R. V., Vasanthi, S., 2003. Mycotoxin food safety risk in developing countries.
- Biological activities of Boswellia sacra extracts on the growth and aflatoxins secretion of two aflatoxigenic species of Aspergillus species. Food Control. 2013;34(2):763-769.
- [Google Scholar]
- Food Microbiology III: Food Preservation. Ankara: İlke Publishing Company; 2008.
- Francisco das Chagas, O.F., Kozakiewicz, Z., Paterson, R.R.M., 2000. Mycoflora and mycotoxins in Brazilian black pepper, white pepper and Brazil nuts. Mycopathologia, 149(1), 13–19.
- Quantitation of aflatoxins in pistachios and groundnuts using HPLC-FLD method. Food Control. 2014;38:75-81.
- [Google Scholar]
- Aflatoxin concentrations in chilies vary depending on variety. Mycoscience. 2011;52(5):296-299.
- [Google Scholar]
- Analysis of aflatoxins in nonalcoholic beer using liquid–liquid extraction and ultraperformance LC-MS/MS. J. Sep. Sci.. 2013;36(3):572-577.
- [Google Scholar]
- Aflatoxin occurrence in nuts and commercial nutty products in Malaysia. Food Control. 2010;21(3):334-338.
- [Google Scholar]
- Survey of aflatoxins in beer sold in Canada. Food Addit. Contam.. 2005;22(12):1252-1257.
- [Google Scholar]
- Aflatoxin B1 and M1: biological properties and their involvement in cancer development. Toxins. 2018;10(6):214.
- [Google Scholar]
- Occurrence of aflatoxins B1, B2, G1 and G2 in cooked food components of whole meals marketed in fast food outlets of the city of Sa∼ o Paulo, SP, Brazil. Food Addit. Contam.. 2001;18(5):445-448.
- [Google Scholar]
- A survey of ochratoxin A and aflatoxins in domestic and imported beers in Japan by immunoaffinity and liquid chromatography. J.-AOAC Int.. 1999;82:897-902.
- [Google Scholar]
- Toxicology of mycotoxins. In: Molecular, Clinical and Environmental Toxicology. Springer; 2010. p. :31-63.
- [Google Scholar]
- Aflatoxin M1 contamination and antibiotic residue in milk in Khorasan province, Iran. Food Chem. Toxicol.. 2010;48(8–9):2130-2132.
- [Google Scholar]
- Mycotoxins in botanicals and dried fruits: a review. Food Addit. Contam.. 2008;25(2):181-192.
- [Google Scholar]
- Immunoaffinity column coupled with solution fluorometry or liquid chromatography postcolumn derivatization for determination of aflatoxins in corn, peanuts, and peanut butter: collaborative study. J.-Assoc. Off. Anal. Chem.. 1991;74(1):81-88.
- [Google Scholar]
- Some Traditional Herbal Medicines, Some Mycotoxins, Naphthalene and Styrene. World Health Organization; 2002.


