

An integrated approach for the identification of potential shallow groundwater zones in west-central Saudi Arabia
⁎Corresponding author. Ralyousefa@gmail.com (Rayan Alyousef)
-
Received: ,
Accepted: ,
This article was originally published by Elsevier and was migrated to Scientific Scholar after the change of Publisher.
Peer review under responsibility of King Saud University.
Abstract
This study aimed to identify groundwater resources at Harrat Khaybar to meet the increasing demand for groundwater for drinking and other purposes, including agricultural and industrial activities. Aquifers were assigned based on integrated electrical resistivity tomography (ERT) and hydrogeological data. Twenty-three ERT profiles ranging 590–890 m long distributed across Harrat Khaybar were acquired. The ERT data were processed to obtain 2D subsurface geoelectrical sections that indicated a variable depth for groundwater as 6–280 m. To investigate water quality, 69 groundwater samples were collected from intensively pumped wells distributed throughout the Harrat. The depth to groundwater measured in these wells ranged 1.5–80 m. It was concluded that Harrat Khaybar is composed of basaltic lava flows underlain by alluvial deposits, which represent two significant water-bearing formations: sub-basaltic alluvial deposits and basalt flows. The depth to the groundwater abruptly deepened from 1.5 to 80 m in the northeast and southwest directions, which could be due to groundwater-bearing formations dipping in these directions or northwest-orientated tension faults. The groundwater quality was assessed in terms of total dissolved solids (TDS), which ranged from 225 to 8340 mg/l, and a TDS-drilling zone encountered in the western part of the Harrat, the following similar most likely resulted from groundwater mineralization. The concentration of TDS generally decreased toward the east in the groundwater flow direction. The pH (6.5–8.1) of the samples indicated that the groundwater pH meets quality standards for domestic and irrigation purposes. It is concluded that, the application of both methods will be of great benefit to identify the groundwater sources and its quality as well.
Keywords
ERT
TDS
pH
Water level
Water quality
Harrat Khaybar
Saudi Arabia

- ERT
-
Electrical resistivity tomography
- TDS
-
Total dissolved solids
Abbreviations
1 Introduction
Harrat Khaybar is located in west-central Saudi Arabia north of Medina (Fig. 1). Residential communities in this Harrat are spread over its entire length, and although these communities are small, they are well populated. These populations depend on groundwater for all purposes. As these populations have steadily increased, the groundwater supply from existing wells has become insufficient, so there is an urgent need to increase this supply. This study aimed to identify groundwater resources extending under the basement rocks and assess the quality of this water and its suitability for drinking and other purposes, including agricultural and industrial activities.
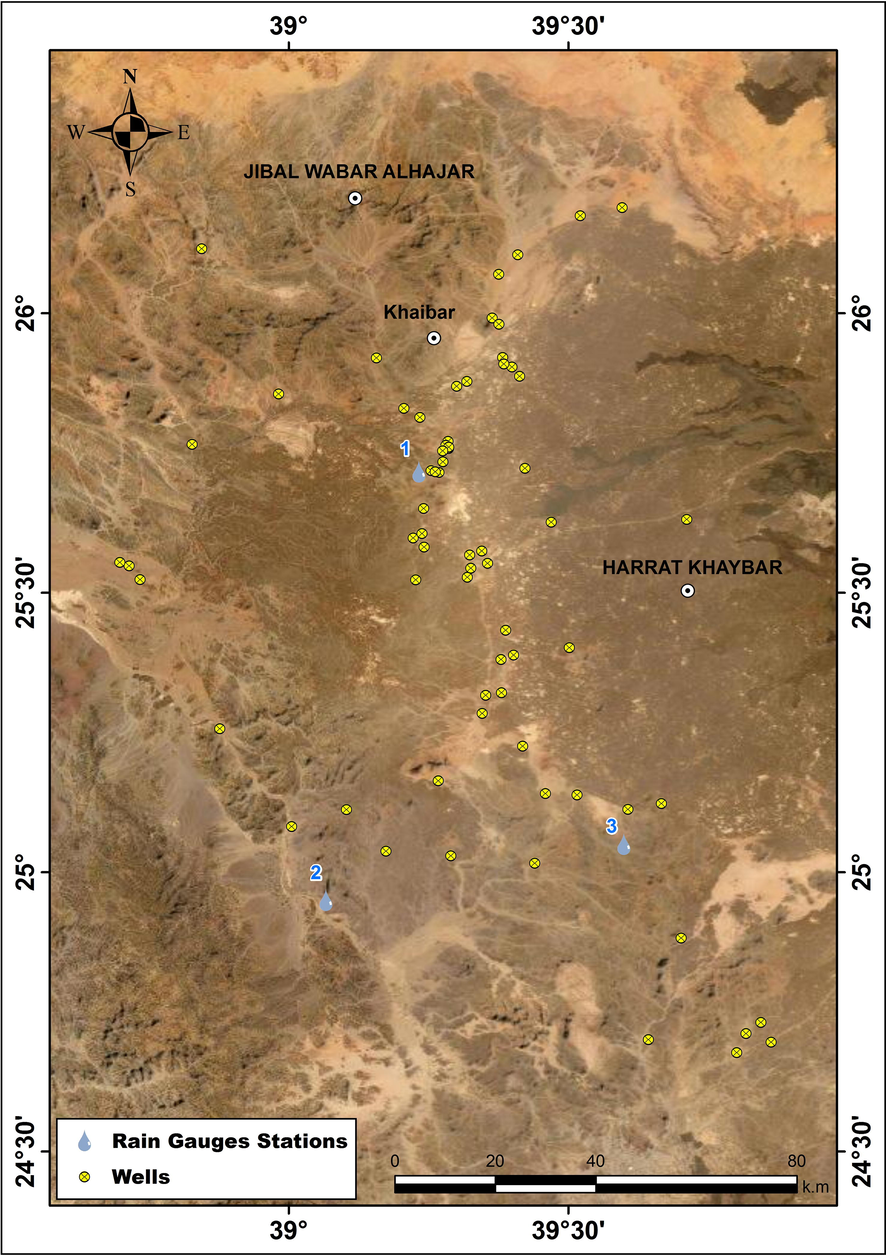
- Location map of the study area.
This study integrated geophysical data measurements, specifically electrical resistivity tomography (ERT), and groundwater hydrological data. These methods, tested globally in several areas, have proven to successfully detect and determine the quality of groundwater sources. 2D multi-electrode electrical imaging systems that simultaneously consider soundings and profiling have been successfully used to map areas with fairly complex geology (Dahlin and Loke, 1998; Griffiths and Barker, 1993; Amidu and Olayinka, 2006; Olayinka and Yaramanci, 2000; Aizebeokhai et al., 2010). Moreover, ERT has a wide variety of applications aimed at determining the physical parameters of rock formations and mapping geological structures for mineral and groundwater exploration and subsurface investigations (Telford et al., 1990; Lowrie, 1997; Soupios et al., 2007; Andrews et al., 2013; Rai et al., 2013; Aning et al., 2014; Arsène et al., 2018; Chen et al., 2018; Thiagarajan et al., 2018; Rizzo et al., 2019). Alshehri and Abdelrahman (2021) detected groundwater resources in Harrat Khaybar based on eleven ERT profiles at six locations.
2 Geological setting
The geological setting of Harrat Khaybar according to Johnson (2005; Fig. 2) comprises Al Ays Group volcanic and sedimentary rocks (Kemp, 1981; Pellaton, 1981) unconformably underlain by Phanerozoic sandstones and well-bedded volcaniclastic and epiclastic sedimentary rocks. The Khanzirah Complex (Fairer, 1986), represented by bodies of biotite-muscovite monzogranite and granophyre, covers the nearby area of the Khaybar (Johnson, 2005). In northeastern and central-eastern Harrat Khaybar, Hamra-Badi alkali feldspar granite is partly covered by Lower Paleozoic sandstone and Cenozoic flood basalt. Older Saq sandstone, represented by flat-lying, thickly bedded, weathered pink sandstone, crops out through the basalts. The Saq sandstone overlies Precambrian thickly bedded, medium-grained to conglomeratic quartzose, which is cross-bedded close to the southern end of the Harrat Khaybar. Cenozoic sedimentary rocks and a Tertiary boulder conglomerate crop out on the northeastern margin of Harrat Khaybar. These conglomerates comprise well-sorted and well-rounded boulders of coarse-grained pink porphyritic rhyolite with bipyramidal quartz and feldspar phenocrysts. Unconsolidated Quaternary deposits mostly overlie the Precambrian basement around the harrats: wadi alluvium of poorly sorted and unconsolidated sand and gravel, eolian sand as small dune fields, Sabkhah deposits formed in seasonal inland lakes, and undifferentiated gravel fan deposits and talus.
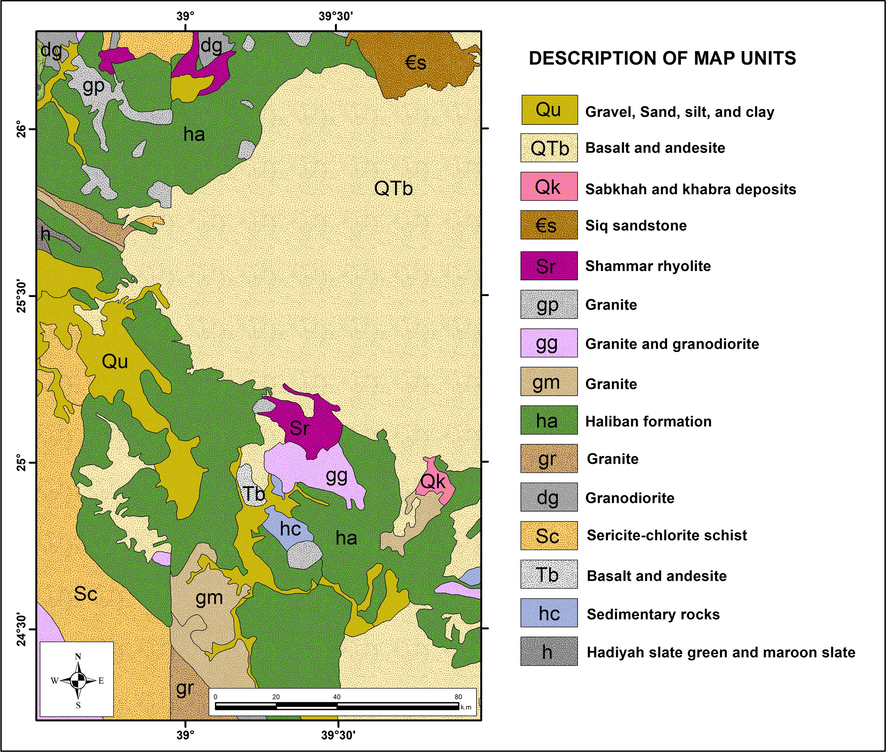
- Geologic map for the study area.
3 Hydrological setting
3.1 Rainfall and climate
In the Khaybar area, rainfall, which is occasional and sporadic within the Kingdom of Saudi Arabia, is the major source of natural water for storage, and rainfall is measured by rain gauges installed throughout the Harrat. The Harrat Khaybar receives < 13 mm of rain per year and is classified as an arid region with high year-round temperatures. The total annual rainfall in the study area varies yearly with strong seasonal variability; a high percentage of the rainfall occurs in the winter and spring (Sonbul, 2016a,b). In the study area, rainfall dispersal varies across time and space; however, according to available meteorological data, most rainfall occurs during spring and autumn, with the least occurring during summer (Al Wagdani et al., 2016).
Hydrogeologically, Harrat Khaybar is located in the Ar Rumah basin, one of the Arabian Peninsula’s biggest and longest wadis, being almost 600 km long. Heading toward the northeast, it connects with several smaller wadis. Wadi Ar Rumah was flooded after heavy rainfall from the end of 1997 to the start of 1998. The mean annual precipitation for the last ten years was 110 mm, which is very low, and it was characterized by an irregular distribution of both quantity and frequency (Sultan et al., 1998).
4 Materials and methods
The groundwater samples were acquired from 69 wells distributed through the study area (Fig. 1), where the depth to the groundwater level was measured. Most of the groundwater samples were collected from intensively pumped wells to avoid any local contamination or change in chemistry caused by evaporation or gas exchange in the wells. The water samples were analyzed in a laboratory for total dissolved solids (TDS) and pH (Figs. 3 and 4).
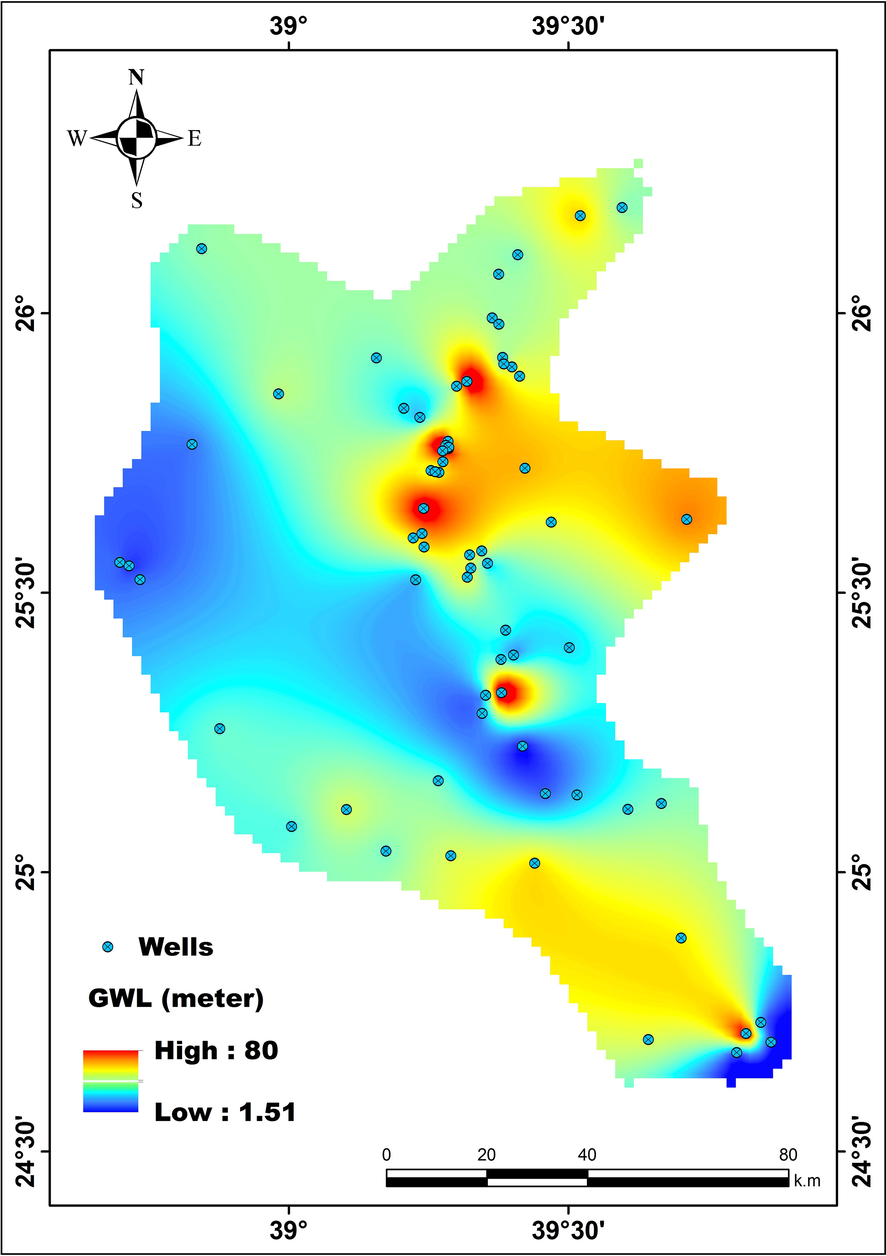
- Depth to groundwater table in the study area.
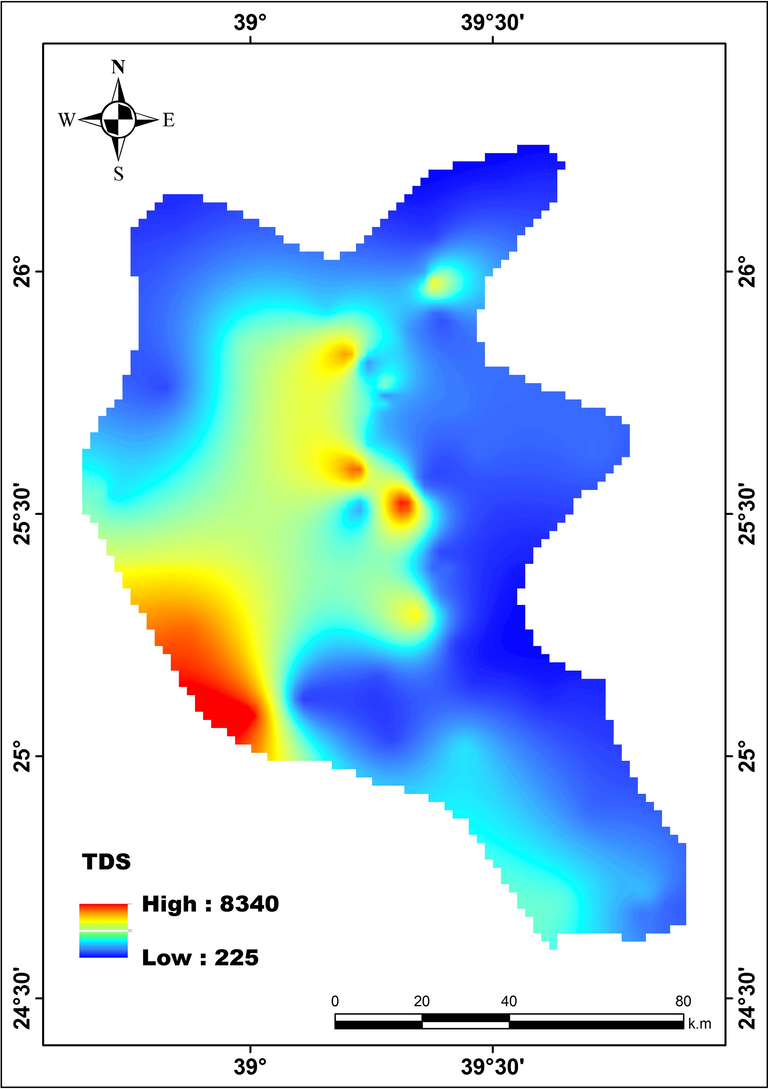
- Spatial distribution of TDS (mg/L) through the study area.
Electrical resistivity profiles were carried out at 20 accessible locations at Harrat Khaybar (Fig. 1). Electrical resistivity data were collected using a resistivity imaging system (SYSCAL Pro 96-channel; IRIS Instruments) with an electrode spacing of 10 m, giving a maximum length for each profile of 950 m. Reciprocal Wenner-Schlumberger arrays were used. Due to the length of the array and the requirement for good contact between the electrodes and the ground, the surveys could only be carried out in large areas covered by alluvium. Hence, the spacing of the electrical sites was somewhat irregular, but a reasonably good transect over the full width of the Harrat was achieved.
5 Data analysis
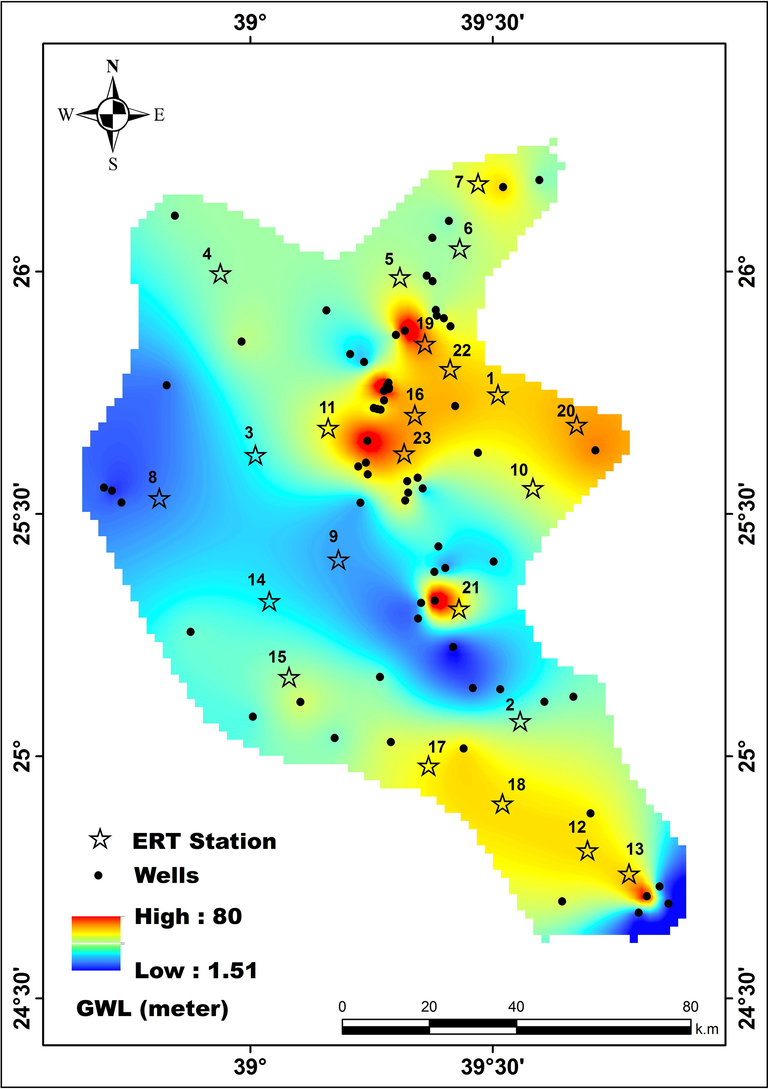
5.1 Groundwater level and quality
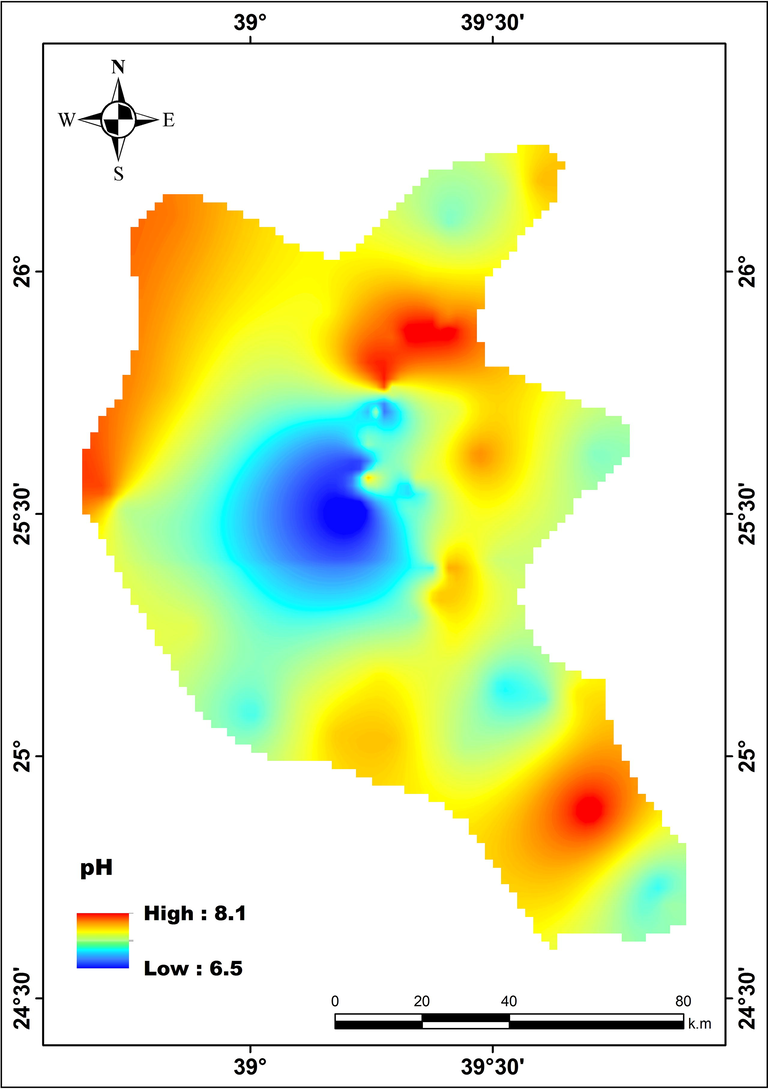
The depth to groundwater level, which ranged from 1.5 to 80 m below the ground surface, was contoured (Fig. 5). Greater depths were recorded in the northeastern and southeastern areas of the Harrat. The values of TDS ranged from 225 to 8340 mg/L, with a TDS-loading zone observed in the western part of the Harrat. The TDS generally decreased in the groundwater flow direction toward the northeast. The guideline value of 480 mg/L based on taste factors has been established (Davis, 1966; Table 1). In the TDS-loading zone, the acidic and alkaline properties of water can be used to evaluate its interaction with rock and other materials (Hem, 1985). Moreover, the permissible pH range for drinking water, as prescribed by global standards, is 6.5–8.5 (WHO, 2004). The pH of the study area samples ranged from 6.5 to 8.1 meet the global standards.
- Variation of Potential of hydrogen of one of the studied wells in the study area.
| Purpose | TDS (mg/L) |
|---|---|
| Drinking | <500 |
| Permissible for drinking | 500–1000 |
| Suitable for agriculture | >1000 |
| Unsuitable | 10,000 |
5.2 ERT data
The collected ERT field resistivity data were processed and inverted using RES2DINVx64 software. Bad data points having extremely high or low resistivity threshold values when compared with surrounding stations were removed, and the resulting data were iteratively inverted. The inversion process includes forward modelling and data inversion with well-modified inversion parameters to determine the true subsurface resistivity distribution using the least-square inversion method. The least-square inversion uses a mathematical inverse problem that determines the subsurface resistivity distribution from measurements of apparent resistivity datasets. This inversion technique tries to produce a subsurface-inverted model that agrees mostly with the field apparent resistivity measurements based on the predefined numbers of iterations for convergence.
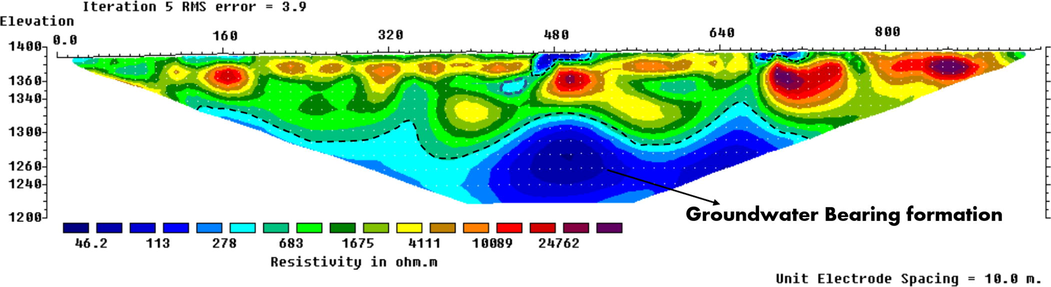
Along the entire length of geoelectric section No.1 (Fig. 6a), about 30–40 m of high resistivity material overlaid low resistivity material extending ∼200 m below the surface. The low resistivity section, probably a saturated zone possibly composed of gravel, extended across almost the entire width of the observed profile, but lateral variations suggested that the porosity or degree of saturation varied considerably within the zone. Low resistivity values (<1-ohm m) indicated that the salinity was possibly high in some places; however, high resistivity (up to ∼10-ohm m) can be consistent with relatively fresh water. Even if water quality is similar across an entire section, observed resistivity changes can be due to variations in porosity and saturation resulting from changes within the aquifer’s gravels or sediments.
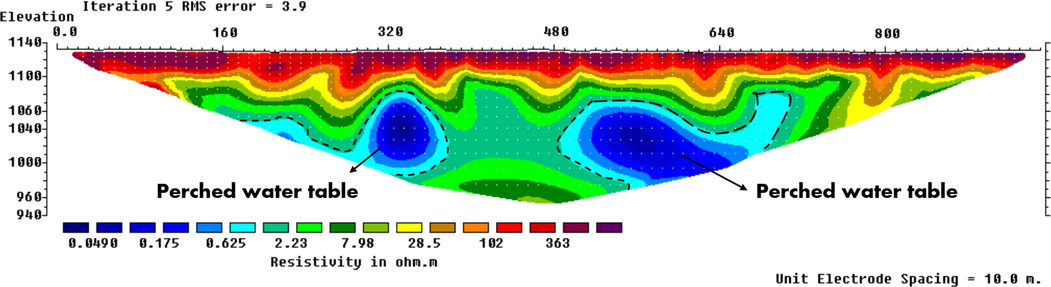
- The interpreted geoelectric section of profile No. 1.
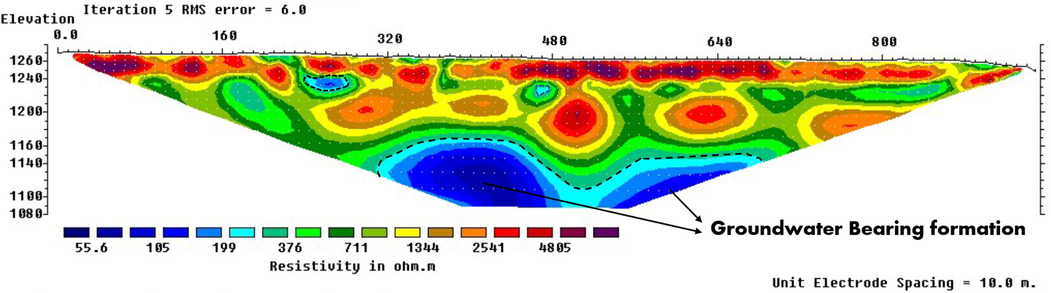
Section No.2 (Fig. 6b) indicated a thin (<10 m thick) discontinuous veneer of high resistivity basaltic material or gravel. Lower resistivity values extended across most of this profile, with a high resistivity block of Precambrian basement about 200–450 m along the profile at a depth of ∼100 m below the surface. The lowest resistivity values were reasonably continuous and extended across the entire profile to a depth of ∼50 m. However, even here, the resistivity values were high (50–100-ohm m) and may have represented a freshwater saturated zone. This is may be potential aquifer in terms of both water quality and quantity.
- The interpreted geoelectric section of profile No. 2.
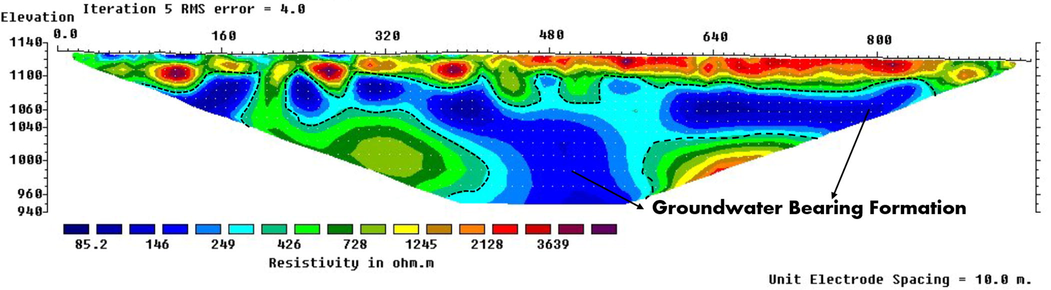
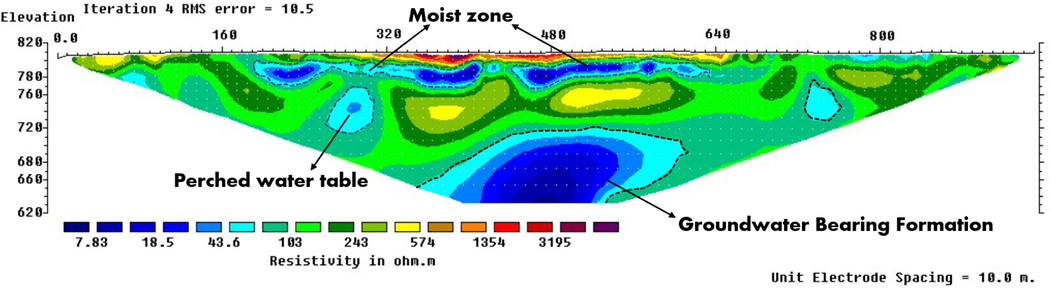
Section No.6 (Fig. 6c) revealed a relatively low resistivity, near-surface, <15 m thick alluvial layer that may have been a freshwater saturated zone. This was particularly evident from around 400 m onwards, and at about 750 m, the thickness increased to ∼40 m. Below this layer, the right half of the profile was underlain by high resistivities that may have represented by volcanic rocks. The high resistivities continued at shallow depth across the section as a 20 m thick layer. At distances of less than 480 m, most of the relatively low resistivity section at depths > 30 m may have represented alluvium or unconsolidated material saturated with fresh water.
- The interpreted geoelectric section of profile No. 6.
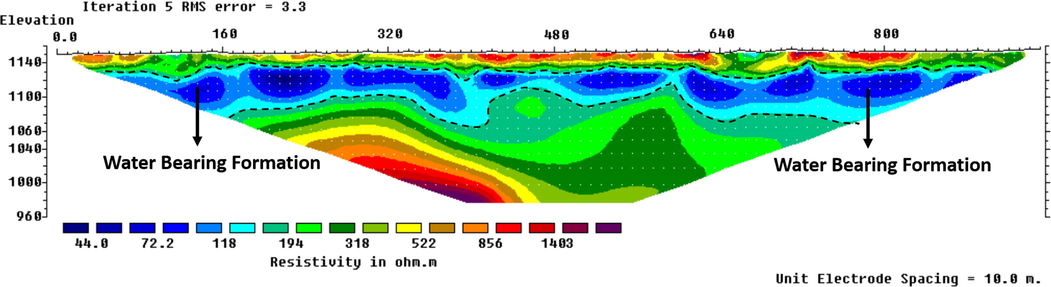
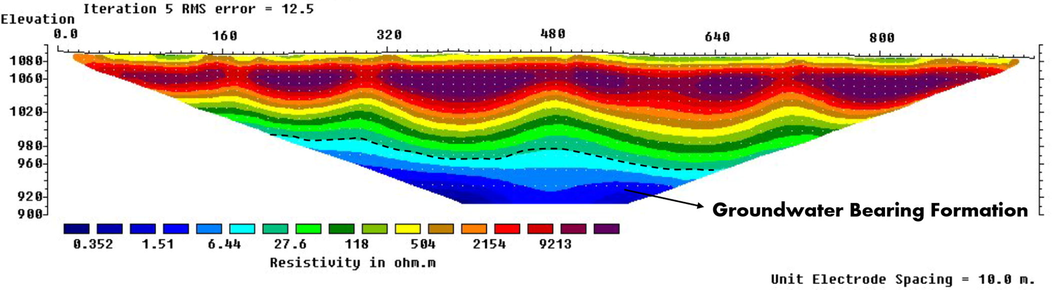
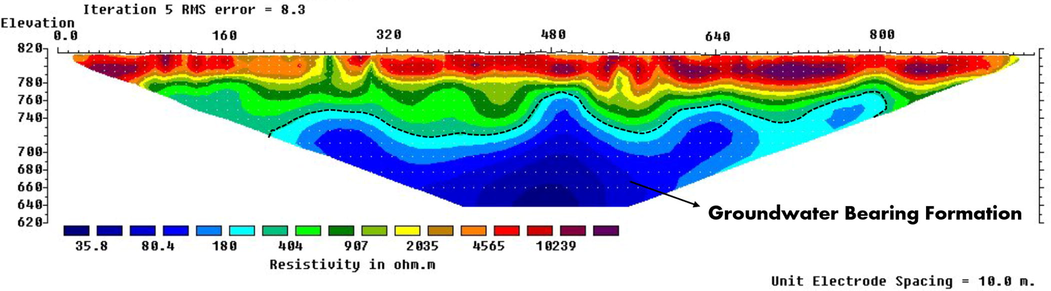
Patches of high resistivity were observed across section No.7 (Fig. 7a) at depths of < 80 m probably due to volcanic rocks. Below these, much lower resistivity values suggested that there was a thick layer of alluvium or unconsolidated material saturated with fresh water that may form a substantial aquifer worth testing. There were several localized areas near the surface that may have also been saturated, for example, at 480 m along the section. While lavas occupied most of section No.13 (Fig. 7b) down to ∼100 m, there appeared to be a zone at greater depth probably saturated with fresh water, but the thickness of this zone could not be determined. Section No.15 (Fig. 7c) indicated that the surface lavas were only 20–30 m thick and probably underlain by an extensive saturated zone of moderately fresh water. This zone may not be continuous or uniform across this section, but in places, it was thicker than 50 m, particularly near the center.
- The interpreted geoelectric section of profile No. 7.
- The interpreted geoelectric section of profile No. 13.
- The interpreted geoelectric section of profile No.15.
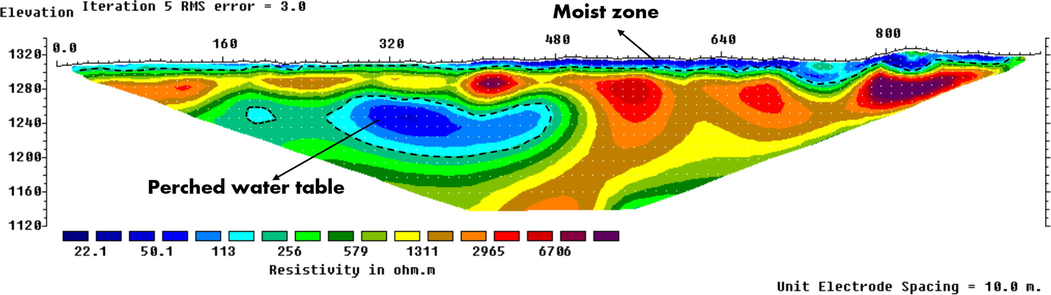
Section No.16 (Fig. 8a) illustrated that the harrat material was continuous and extended down to 30 or 40 m. There was a pronounced low resistivity saturated zone probably > 100 m thick ranging from 80 to 100 m below the ground surface. The surface lava, which was very thin from about 300 to 650 m along section No.20 (Fig. 8b), was underlain by a 10–20 m saturated zone, with low resistivity zone that indicates, to large extent, good quality of water. At about 100 m deep toward the center, low resistivity indicated a good volume of fairly fresh water. The surface lavas were continuous and about 50 m thick along section No.21 (Fig. 8c). These were underlain by an extensive saturated zone at least 80–100 m thick at about 60–80 m deep, where the resistivity values indicated that the water was quite fresh.
- The interpreted geoelectric section of profile No. 16.
- The interpreted geoelectric section of profile No. 20.
- The interpreted geoelectric section of profile No. 21.
6 Results and discussion
The hydrogeological data indicated that the depth to the groundwater table deepened from 1.5 to 80 m toward the northeast and southwest. Moreover, the groundwater TDS values ranged from 225 to 8340 mg/l, and a TDS-loading zone was encountered in the western part of the Harrat, most likely the result of groundwater mineralization. The TDS values generally decreased toward the northeastern part of the study area in the direction of the groundwater flow. The variation of pH between 6.5 and 8.1meets the requirements of domestic and irrigation purposes.
Surface lavas and underlying shallow aquifers were quite well defined in geoelectric sections 1–4, although it has a variable thickness. The aquifer in section No.1 was probably salty, but the other sections indicated fresh water. In sections from 5 to 7, the lava thicknesses were fairly variable, and the saturated zones, although not continuous, probably contain fresh water. Sections from 8 to 14 mainly indicated lava, as was expected for points near the center of the Harrat. The lavas thicknesses were very variable, but there were also localized generally discontinuous saturated zones throughout these sections that probably contain fresh water. Section No.15 indicated thin lavas and a more extensive freshwater saturated zone. In contrast, section No.16 indicated thick lavas and underlying salty water saturated zone. In section No.17, the lava was not as thick, and this was probably underlain by fresher water, possibly in an aquifer that was not continuous across the section. Sections from 18 to 20 show variable lavas and localized saturated zones with fairly fresh water at various depths. Section No.21 illustrates continuous surface lava overlying a thick freshwater aquifer at ∼60 m depth. In contrast, in section No.22, the lavas were thin and broken, with discontinuous saturated zones of fresh water. Section No.23 presents the surface lavas and Precambrian rocks, although there were indications of a deep aquifer.
7 Conclusions
Based on the above-mentioned results it could be concludes that, the inversions were smoothed as part of the inversion process, so while it is not always possible to precisely define resistivity boundaries, the main features noted here are probably realistic. Exploratory well should target the extensive, shallow, low resistivity zones shown in the sections: sections from 1 to 4 and 6 (near-surface), section No.14 (near-surface), and section No.15 would be a good start. Other sections with deeper aquifers that could be investigated including sections No. 7, 13, and from 16 to 21.
The integration between the hydrological and geoelectrical resistivity surveys conducted in Harat Khyber, indicates good results (Fig. 9). Hence, it is recommend applying these studies to the rest of the Harats distributed along the Arabian Shield to explore the sources of groundwater to serve their residents for living purposes, agricultural and industrial activities.
- The integration between both of the hydrogeological and ERT results.
Acknowledgements
The authors extend their appreciation to Researchers Supporting Project number (RSP-2021/327), King Saud University, Riyadh, Saudi Arabia
Declaration of Competing Interest
The authors declare that they have no known competing financial interests or personal relationships that could have appeared to influence the work reported in this paper.
References
- Assessment of the reliability of 2D inversion of apparent resistivity data. Geophys. Prospect.. 2000;48:293-316.
- [Google Scholar]
- Groundwater resources exploration of Harrat Khaybar area, northwest Saudi Arabia, using electrical resistivity tomography. J. King Saud Univ. Sci.. 2021;33(5):101468.
- [Google Scholar]
- Al Sultan S., Tanaka S., T. Sugimura, 1998. Desert greening in wadi Ar Rumah drainage system in 1998 observed by remote sensing. Proceedings of Japans 1998 Conference on Remote Sensing, 245-246. Kuwait-Japan and GCC Conference on Desert greening.
- Al Wagdani, E.O., Basamed, A.S., Al-Shorbaji, H.H., Thabit M., Al Ashi, W.A., Al Hery, H.A., 2016. The exploration and development of water resources in Harrat Khaybar: Saudi Geological Survey Technical Report, SGS-TR-2012-10, 73 p., 67 figs., 19 tables, 1 app.
- Application of 2D and 3D geoelectrical resistivity imaging for engineering site investigation in a crystalline basement terrain, southwestern Nigeria. Environ. Earth Sci.. 2010;61:1481-1492.
- [Google Scholar]
- Environmental assessment of sewage disposal systems using 2D electrical resistivity imaging and geochemical analysis: a case study from Ibadan, Southwestern Nigeri. Environ. Eng. Geosci.. 2006;7:261-272.
- [Google Scholar]
- Geophysical investigations at the proposed site of the knust teaching hospital building using 2d and 3d resistivity imaging techniques. Int. Res. Jour. Geol. Min.. 2013;3:113-123.
- [Google Scholar]
- Electrical resistivity as a geophysical mapping tool; a case study of the new art department, Knust-Ghana. Int. J. Sci. Res.. 2014;4:1-7.
- [Google Scholar]
- Hydrogeophysical investigation for groundwater resources from electrical resistivity tomography and self-potential data in the Méiganga Area. Int. J. Geophys.. 2018;2018:1-14.
- [CrossRef] [Google Scholar]
- Evaluating the application of electrical resistivity tomography for investigating seawater intrusion. Electronics. 2018;7:107.
- [CrossRef] [Google Scholar]
- Resolution of 2D Wenner resistivity imaging as assessed by numerical modelling. J. Appl. Geophys.. 1998;38:237-249.
- [Google Scholar]
- Hydrogeology. New York: John Wiley & Sons; 1966. p. :453.
- Geologic map of the Harrat Ithnayn quadrangle, sheet 26 D, Kingdom of Saudi Arabia. In: Saudi Arabian Deputy Ministry for Mineral Resources Geologic Map GM-106. 1986. p. :15.
- [Google Scholar]
- Two-dimensional resistivity imaging and modelling in areas of complex geology. J. Appl. Geophys.. 1993;29:211-226.
- [Google Scholar]
- Study and interpretation of the chemical characteristics of natural water. USGS Water Supply Paper. 1985;2254:117-120.
- [Google Scholar]
- Johnson, P.R., 2005. Proterozoic geology of western Explanatory notes to the map of Proterozoic geology of western Saudi Arabia, north-central sheet: Amended May 2005: Saudi Geological Survey Open-File Report SGS-OF-2005-5, 34 p.
- Kemp, J., 1981. Geologic map of the Wadi al ‘Ays quadrangle, sheet 25 C, Kingdom of Saudi Arabia: Saudi Arabian Deputy Ministry for Mineral Resources Geologic Map GM-53, 39.
- Fundamentals of Geophysics. UK: Cambridge University Press; 1997.
- Pellaton, C., 1981. Geologic map of the Al Madinah quadrangle, sheet 24 D, Kingdom of Saudi Arabia. Saudi Arabian Deputy Ministry for Mineral Resources Geologic Map GM-52, 19 .
- Electrical resistivity tomography for groundwater exploration in a granitic terrain in NGRI campus. Curr. Sci.. 2013;105:25.
- [Google Scholar]
- Deep Electrical resistivity tomography for the hydrogeological setting of Muro Lucano Mounts Aquifer (Basilicata, Southern Italy) Geofluids 20196594983
- [CrossRef] [Google Scholar]
- Hydrological and hydrochemical studies of the groundwater aquifer of Harrat Khaybar area, North of Saudi Arabia. IJSER7 2016:492-502.
- [Google Scholar]
- Application of integrated methods in mapping waste disposal areas. Environ. Geol.. 2007;53:661-675.
- [Google Scholar]
- Hydrological and Hydrochemical Studies of the Groundwater Aquifer of Harrat Khaybar Area, North of Saudi Arabia. Int. J. Sci. Eng. Res. 2016
- [Google Scholar]
- Delineation of groundwater resources using electrical resistivity tomography. Arab. J. Geosci.. 2018;11:212.
- [Google Scholar]
- Applied Geophysics. UK: Cambridge University Press; 1990.
- WHO Guidelines for Drinking-water Quality (4th edn.). World Health Organization; 2004.
Appendix A
Supplementary data
Supplementary data to this article can be found online at https://doi.org/10.1016/j.jksus.2022.101915.
Appendix A
Supplementary data
The following are the Supplementary data to this article:


