

Translate this page into:
An integrated approach for identification of seawater intrusion in coastal region: A case study of northwestern Saudi Arabia
-
Received: ,
Accepted: ,
This article was originally published by Elsevier and was migrated to Scientific Scholar after the change of Publisher.
Peer review under responsibility of King Saud University.
Abstract
Seawater intrusion of the northwestern Saudi Arabia, has been investigated through integrated geophysical techniques of electrical resistivity tomography (ERT), seismic refraction tomography (SRT), and time-domain electromagnetic (TDEM). These geophysical measurements were conducted along three parallel NW-SE profiles. Then, processed and interpreted with geotechnical data of four boreholes drilled in the studied area. The results indicate the presence of seawater intrusion at shallow depths between 4 and 10 m below the ground level. These results reveal three layers, which are used here to identify the seawater invasion zone in the study area. 1) The topmost layer with moderate resistivity (14–40 Ω.m) and low P-wave velocity (less than 1000 m/s) indicates a man-made fill and extends down to 5 m depth. 2) The second layer with low resistivity (3–14 Ω.m) corresponding to partially saturated fractured sandstone with P-wave velocity varies between 1000 and 2500 m/s. It is 5-m thick, filled with silty sand and gravel, and contains saline water. 3) The third layer with extremely low resistivity (less than 1 Ω.m) and high P-wave velocity (greater than 2500 m/s) and composed of hard, massive, slightly weathered sandstone. This third layer represents an invaded zone that is highly saturated with seawater. These subsurface characteristics were correlated well with the identified lithological variations obtained from the boreholes.
Keywords
Seawater intrusion
ERT
SRT
TDEM
Saudi Arabia

1 Introduction
Seawater intrusion is recognized as an increasing threat to coastal communities worldwide. Seawater contaminates groundwater making it unsuitable for consumption. The extent of intrusion is primarily driven by anthropogenic activities, human-induced climate change, and their synergy. Seawater intrusion causes enormous risks for the coastal environment, especially considering the increasing demand for groundwater by residents in coastal urban areas. The environmental risks of the seawater intrusion phenomenon have been studied by several researchers from around the world (Abdelbaki et al., 2015; Alfaifi et al., 2019; Alfarrah et al., 2017; Deng et al., 2017; Felisa et al., 2013; Han and Currell, 2018; Hussain et al., 2019; Zia et al., 2017; Ketabchi et al., 2016; Khadra and Stuyfzand, 2018; Mansour et al., 2017; Panjaitan et al., 2018; Safi, 2019; Sefelnasr and Sherif, 2014; Soupios et al., 2015; Uddameri et al., 2014; Werner, 2017; Chang et al., 2018; Zeng et al., 2016).
Moreover, electrical resistivity tomography (ERT), seismic refraction tomography (SRT), and time-domain electromagnetic (TDEM) survey techniques have been widely applicable for monitoring saltwater intrusion in coastline plains (e.g., Hazreek et al. (2018); Nassir et al. (2000); Sherif et al. (2006); Vafidis et al. (2014); Hamdan et al. (2015); Alfaifi et al. (2019). The study in the northwestern part of Saudi Arabia along the Red Sea coast (Fig. 1).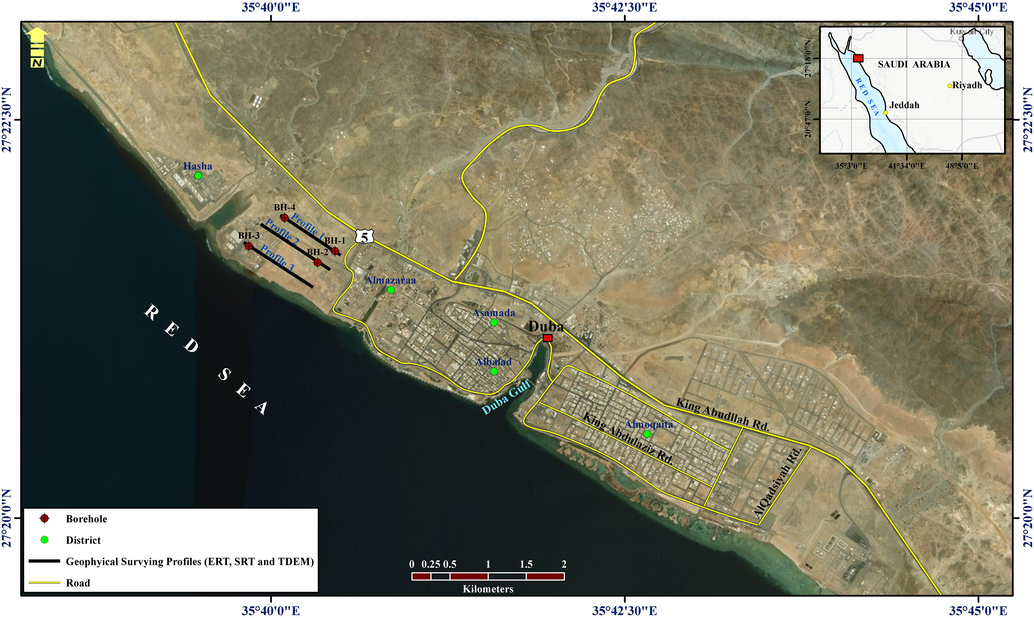
Location of the study area including the geophysical profiles.
2 Geological and hydrogeological setting
According to Johnson (1983), the study area comprises the following rock units, arranged from the older to the younger (Fig. 2). Bayda group (ba) is moderately deformed and weakly to moderately metamorphosed. The group contains abundant volcanic rocks. Muwaylih suite (mw) (Ramsay et al., 1986) consists of mafic plutons that intrude the Zaam and Bayda groups and the Najah granodiorite. Qazaz granite super suite (qa) was introduced by Johnson (2005) as a collective term for numerous Ediacaran granite plutons emerging in the Midyan terrane on 1:250,000-scale source maps (Davies, 1985) and as described by Ramsay et al. (1986). However, here, these are grouped as a super suite, because of their common lithology, apparent age, and juxtaposition in the northwestern shield. The suite is predominantly monzogranite, but individual plutons also contain granodiorite, diorite, syenogranite, and locally gabbro. The Oligo–Miocene (CS) sedimentary succession consists mainly of intercalations of sandstones, conglomerates, siltstones, and thin carbonate beds. Mainly, the wadi alluvial represents the Quaternary deposits.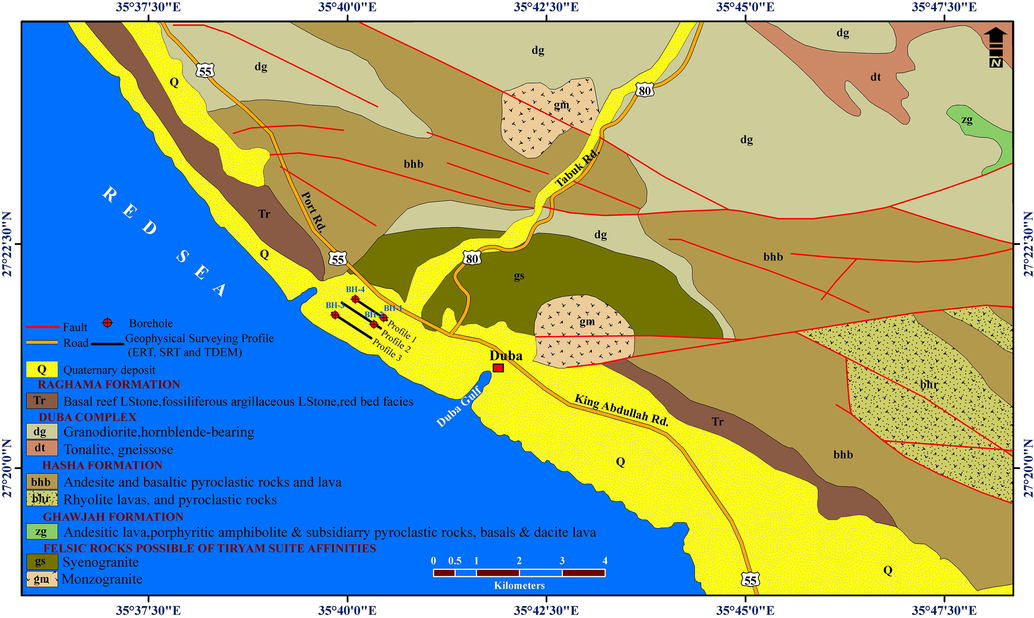
Geological map for the study area.
The subsurface geological setting of the study area has been inferred from four boreholes passing through the survey profiles (Table 1). The maximum penetrated depth of these boreholes is 20.0 m. These boreholes reveal three layers: 1) a man-made fill composed of brownish–gray to gray, medium dense to dense; 2) compacted soft and fractured sandstone recovered as silty sand with gravel; and 3) light brown to gray, hard, and massive sandstone. The average annual rainfall is about 20 mm, while the annual evaporation is almost 40 mm (Al-Sagaby, 1978). The groundwater level lies at 8–9.4 m depth, as recorded through the recently drilled boreholes in the study area Fig. 1 and Table 1.
Borehole No.1
Borehole No.2
Borehole No.3
Borehole No.4
Depth (m)
Lithology
Depth (m)
Lithology
Depth (m)
Lithology
Depth (m)
Lithology
0–7
Man-made fill
Silty sand with gravel0–8.5
Man-made fill
Silty sand with gravel0–5.5
Man-made fill
Silty sand with gravel0–4
Man-made fill
Silty sand with gravel
7–8
Compacted soft and fractured sandstone rock.
Brownish-gray to gray, medium dense to dense8.5–10
Compacted soft and fractured sandstone rock.
Brownish-gray to gray, medium dense to dense5.5–7
Compacted soft and fractured sandstone rock.
Brownish-gray to gray, medium dense to dense4–5
Compacted soft and fractured sandstone rock.
Brownish-gray to gray, medium dense to dense
8–20
Sandstone bedrock
Light brown to gray, hard, massive, slightly weathered10–20
Sandstone bedrock
Light brown to gray, hard, massive, slightly weathered7–20
Sandstone bedrock
Light brown to gray, hard, massive, slightly weathered5–20
Sandstone bedrock
Light brown to gray, hard, massive, slightly weathered
3 Data acquisition
In this study, three two-dimensional (2D) profiles were obtained with the ERT technique. These data were collected using an IRIS Instrument Syscal Pro multi-electrode receiver and a 12-V battery as a source. Field measurements were recorded using a Syscal pro resistivity meter with a Werner-Schlumberger configuration due to the fact that it has the strongest signal strength and its ability to detect vertical changes and horizontal structures. It provides a clear image of groundwater as well as saltwater intrusion. The electrode spacing has interval of 5.0 m, including 54 electrodes for each traverse line. The readings were then recorded with an RMS error usually less than 2%. At each measurement point, if the RMS error much was larger than that, we repeated the measurement. However, RMS error values of 5% were generally acceptable.
Moreover, three of seismic refraction (SR) and SRT profiles were obtained using the multi-channel signal-enhancement seismograph model of Geode-model (Geometrics Inc.) equipped with 48 channels. These profiles had different lengths, and the distance between two consecutive geophones, (inter-geophone spacing) was 5 m. The data file included the precise positions of the geophones and the shot point, which were measured by a synchronized G.P.S. instrument in the field. Furthermore, nine shooting points were used for each SR survey while 48 shotpoints were applied for SRT measuremnets. Field measurements were performed using a sledgehammer with a mass weight of 10 kg and accelerated weight drop as the seismic energy source for SR and SRT respectively to generate P-wave data through vertically repeated impacts on a metal striker plate and using vertical geophones.
While for TDEM data acquisition, three-loop configurations were applied to control the optimum response of the near-vertical conductors present at the site of interest. In addition, one sounding was selected from a profile, for analysis. The TDEM field data were collected using a moving-in-loop setup with a high-speed sampling receiver (Rx) model (GDP-32) and a battery-powered fast turn-off transmitter (Tx) model (NT-20) as the signal source. The set-up used in this study was a 20 m × 20 m square loop for the Tx, and a 5 m × 5 m loop for Rx. The transient decay voltage is measured by as many as 32channels spaced in time between the cut-off of one pulse cycle to the initiation of the next. The system used allows for stacking and averaging of as many as 2048 measurement cycles. Any number of individual stacked measurements can be averaged to determine very accurately the transient voltage decay curve.
4 Data processing and interpretation
4.1 Electric resistivity tomography (ERT) data
The ERT field data was downloaded from the Syscal Pro resistivity meter using the Prosys II software. The RES2DINV software (Loke and Barker, 1996) transformed the apparent resistivity values into true resistivity using the inversion process. First, these data were filtered and then any unsuitable data, that had too high or too low apparent resistivity values, were removed. The filtered data were processed through a series of least-squares inversion trials to produce pseudo-sections. Finally, the 2D resistivity image of the subsurface was mapped. The penetrated depth of these 2D geoelectric cross-sections indicated a three-layer model, including the central portion with less resistivity than those of the overlying and underlying layers. These pseudo-sections have been interpreted according to Table 1.
Profile 1 illustrates three geoelectric layers (Fig. 3a), where the topmost layer extends down with 4 to 8.5 m in depth with resistivity ranges between 16 and 40 Ω m. This layer corresponds to man-made filled sediments containing silty sand with gravel. The resistivity of layer 2 varies between 1 and 16 Ω m. This layer corresponds to fractured sandstones filled with silty sand and gravel saturated partially with saltwater and its thickness approaches 5 m. The base layer represents an invaded zone that is highly saturated with saltwater, as indicated by the very low resistivity values (0.1–1 Ω m). According to the geological data, this third layer corresponds to bedrock sandstones saturated with saline water.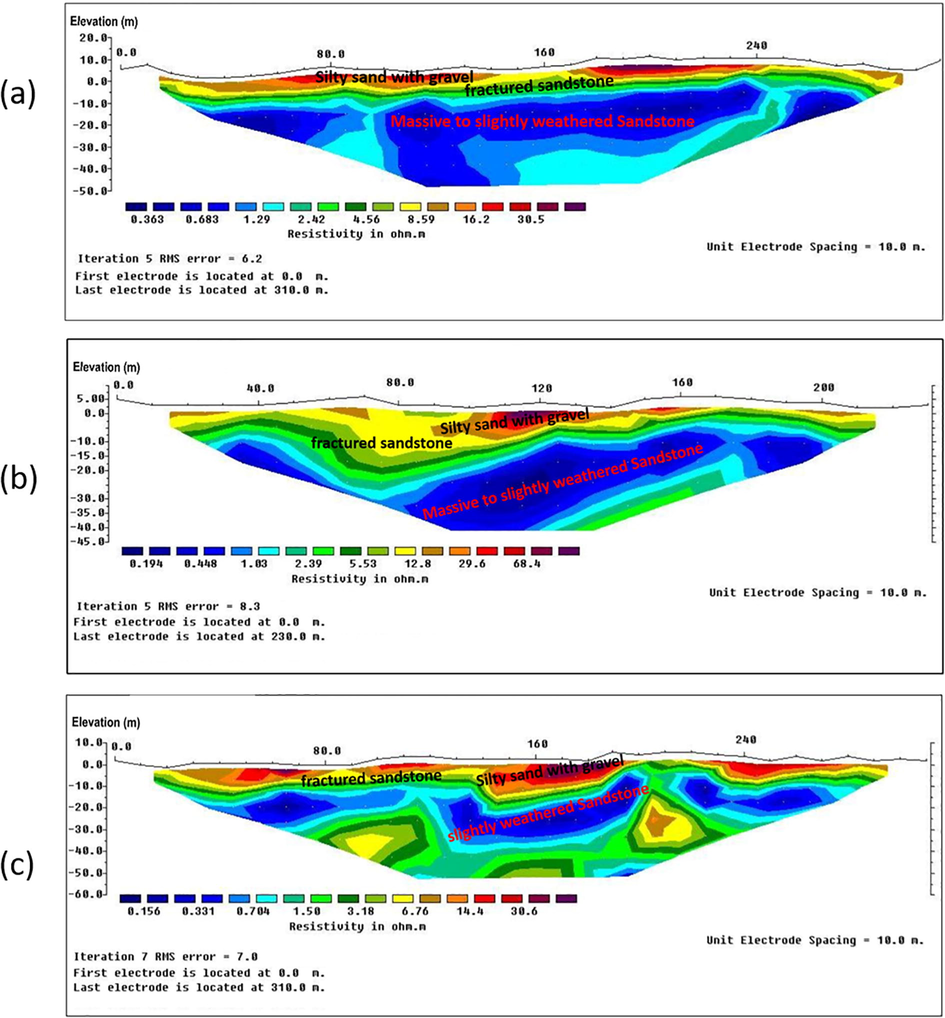
a) 2D geoelectric resistivity model of Profile No.1; b) 2D geoelectric resistivity model of Profile No.2; c) 2D geoelectric resistivity model of Profile No.3.
Profile 2 is of 240-m long (Fig. 3b) and reveals three distinct resistivity variations. The first layer has a 10-m thickness and a resistivity exceeding the range of 13–100 Ω m. This large range of resistivity indicates that this layer is inhomogeneous. This layer corresponds to landfill sediments, containing silty sand with gravel. The second layer has low resistivity (1–13 Ω m). This layer indicates an invaded zone saturated with saline water. It corresponds to fractured sandstone filled with silty sand and gravel saturated partially with saltwater with 20 m thickness. The deepest layer represents an invaded zone that is highly saturated with saline water, as indicated by its extremely low resistivity values (less than 1 Ω m). According to the geological data, this third layer corresponds to bedrock sandstone saturated with saline water.
Profile 3 has a total length of 310 m (Fig. 3c) and reveals three layers. The first layer represents landfill sediments containing silty sand with gravel. The resistivity ranges from 16 to 40 Ω m with depth in the range from the ground surface down into 10 m. The second later exhibits resistivity in the range of 1–10 Ω m and has a thickness of 5 m. The deepest layer has a highly low resistivity (less than 1 Ω m). It represents bedrock sandstone saturated with saline water.
4.2 Seismic refraction tomography (SRT) data
The seismic refraction data were analyzed using the SeisImager software, based on a non-linear travel-time methodology. The collected waveforms were filtered by applying the Fuzz filter, to attenuate the high-frequency noise. Low- and high-cut filters were applied to all traces, whereas notch filters were applied to eliminate the electromagnetic noise from AC power lines. Baseline correction was conducted for all the recorded traces. After these corrections, the data were subjected to the following sequence of processing steps: 1) break-picking of the digitized seismic waveforms for all the channels, 2) constructing the travel-time–distance (T–D) curve for each profile based on nine shot-points, 3) assigning each layer of each T–D curve, and 4) Time-term inversion to construct the 2D geoseismic velocity model. These sections have been interpreted according to Table 1.
The SRT Profile 1 has a length of 235 m including 48 channels, which were placed at 5-m intervals. Based on the first arrivals of the P-wave, the developed subsurface 2D geoseismic velocity model (Fig. 4) presents three layers. The average thickness reaches approximately 0.5 m and the P-wave velocity is less than 1000 m/s. The second layer varies in thickness from 5 m to 10 m along the profile. This layer has a P-wave velocity between 1000 and 2500 m/s, which corresponds to fractured sandstone. P-wave velocity greater than 2500 m/s characterizes the third layer, which indicates the presence of hard sandstone.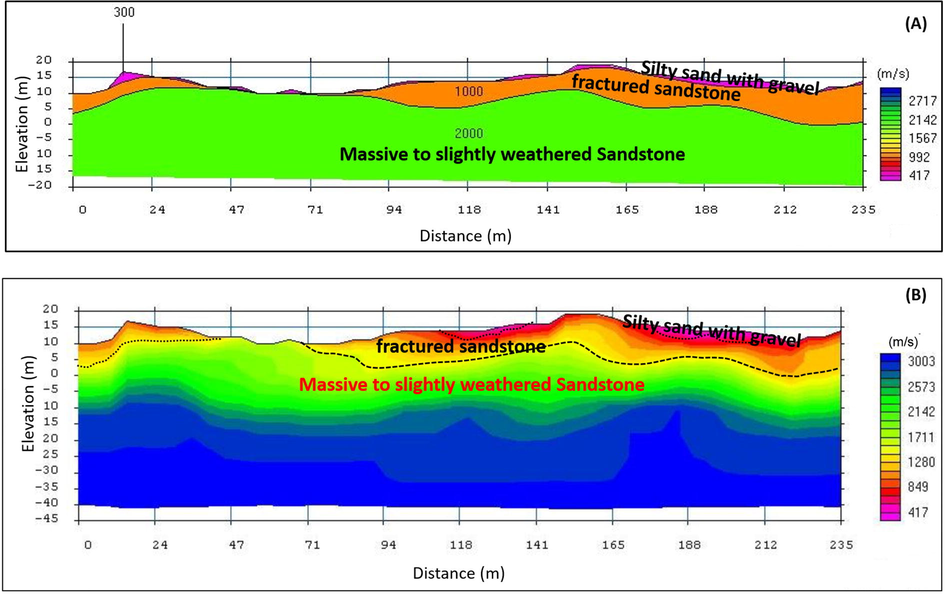
Seismic ground model for the P-waves of profile no. 1.
Profile 2 spreads over 235 m, containing 48 geophones with 5-m geophone spacing. The obtained subsurface 2D geoseismic velocity model (Fig. 5) exhibits three layers. The first layer is extremely thin, with the maximum thickness of approximately 0.7 m. For this surface layer, the P-wave velocity is less than 1000 m/s, which suggests sand soil. The thickness of the second layer varies from 5 m to 10 m. The P-wave velocity of this layer is less than 2500 m/s, which indicates fractured sandstone. The third layer has a P-wave velocity greater than 2500 m/s, corresponding to hard sandstone.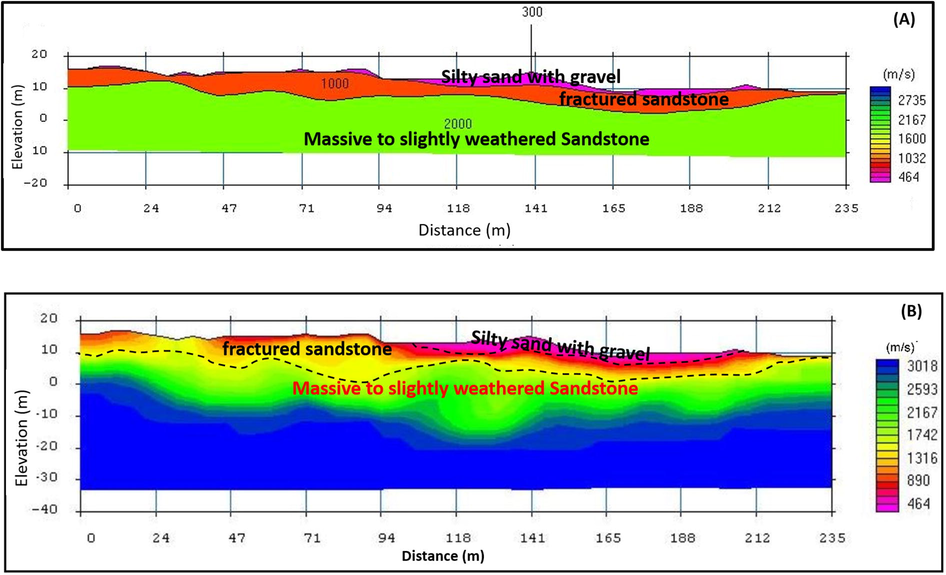
Seismic velocity model for the P-waves of profile no. 2.
Profile 3 with 235-m length was obtained using 48 geophones and 5-m geophone intervals. Based on the first arrivals of the P-wave, the resultant subsurface 2D velocity model (Fig. 6) has three layers. The topmost layer reaches approximately 0.5 m, with a P-wave velocity less than 1000 m/s indicating a sandy soil. The second layer varies in thickness from 2 m to 10 m with a P-wave velocity less than 2500 m/s. This layer is composed of fractured sandstone. The third layer has a P-wave velocity greater than 2500 m/s, revealing hard sandstone.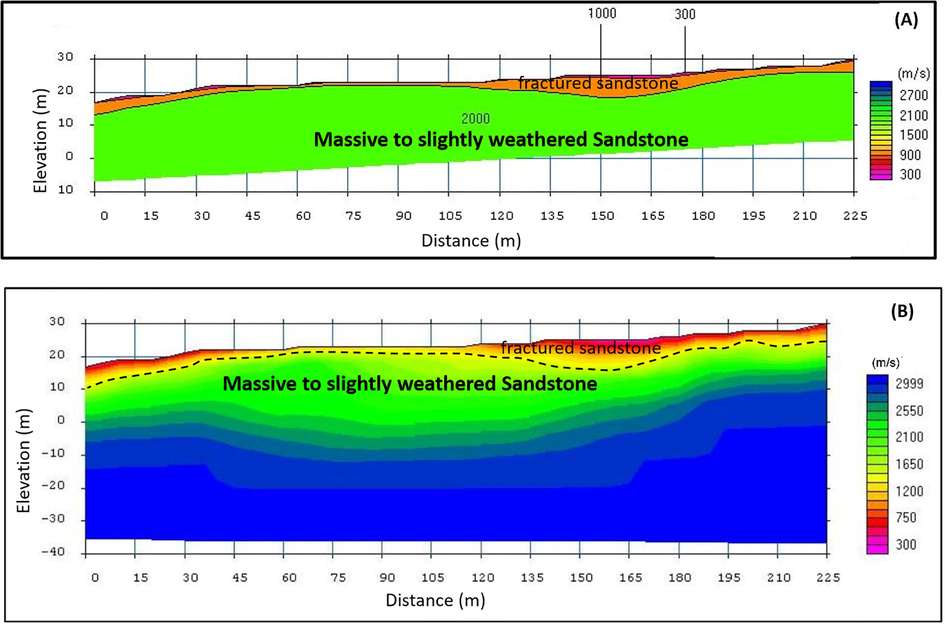
Seismic velocity model for the P-waves of profile no. 3.
4.3 Time-Domain elecrtomagnetic (TDEM) data
The collected TDEM field raw data were downloaded and then transformed to resistivity versus time. These data were edited, smoothed, analyzed, and processed using the Zonge TEM inversion program. The smooth-model inversion is a robust method for converting electromagnetic EM measurements to profiles of resistivity versus depth using STEMINV software. These sections have been interpreted according to Table 1.
Profile 1 has a length of 300 m, and the distance between the measuring stations is 20 m (Fig. 7a). This profile presents three layers. The first layer extends up to 5 m in depth with a resistivity of 10–80 Ω m. This layer represents dry to wet beach sediments. The second layer extends down to 9 m depth with a resistivity of 1–10 Ω m. The third layer represents an invaded zone saturated with saline water, as indicated by its extremely low resistivity values (less than 1 Ω m).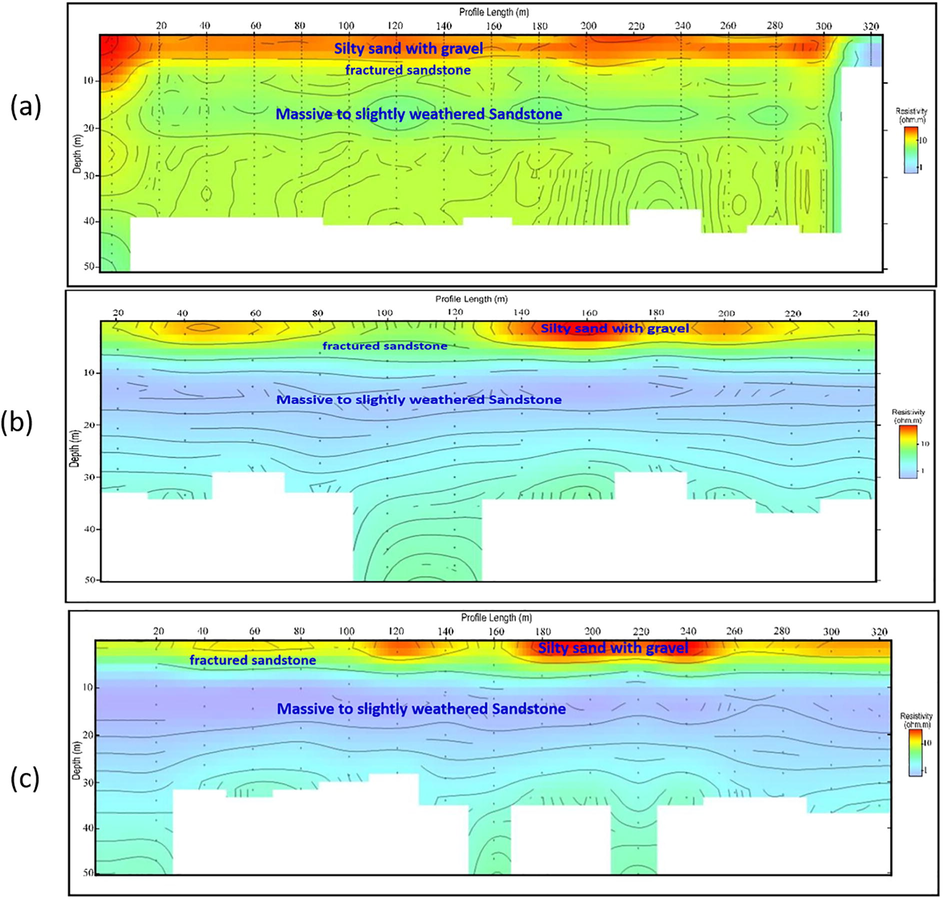
a) 2D resistivity model along electromagnetic profile no. 1; b) 2D resistivity model along electromagnetic profile no. 2; c) 2D resistivity model along electromagnetic profile no. 3.
Profile 2 is 240 m long and the measuring stations were placed every 20 m (Fig. 7b), and it illustrates three zones. 1) The first zone extends down to 5 m depth with a resistivity greater than 10 Ω m. This layer represents dry to wet beach sediments. 2) The second layer has a resistivity in the range of 1–10 Ω m, and the third layer is characterized by very low resistivity values (less than 1 Ω m) indicating an invaded zone saturated with saline water.
Profile 3 has a maximum length of 310 m and a station interval of 20 m (Fig. 7c). This profile reveals three layers. The topmost layer extends down to 5 m depth with a resistivity greater than 10 Ω m. This layer represents dry to wet beach sediments. The second layer extends down to 10 m depth with a resistivity range from 1 to 10 Ω m. The third zone is characterized by extremely low resistivity values (less than 1 Ω m). This zone corresponds to the invaded second zone saturated with saline water.
5 Conclusions
Based on these results, three layers, with high conformability, are associated with the seawater intrusion in the investigated area. These are 1) the topmost layer with a moderate resistivity (14–40 Ω m) and low P-wave velocity (less than 1000 m/sec), which corresponds to a landfill of silty sand and gravel above the water table; 2) the second layer with low resistivity (3–14 Ω m), which is correlated with fractured sandstones of P-wave velocity in the range of 1000–2500 m/s and filled with silty sand and gravel saturated partially with saltwater; and 3) the third layer of very low resistivity (<1 Ω m) and high P-wave velocity (3000 m/s), which is likely well-graded sand and slight silt, with traces of gravel and a high clay content. The third layer represents an invaded zone that is highly saturated in seawater.
By comparing the results of the geophysical methods with the results of the recently drilled boreholes in the study area, it indicated that good agreement with regard to the three lithological layers, their depths, and lateral extension (Table 1). Accordingly, it can be concluded that, the ERT, SRT, and TDEM geophysical techniques work well in tandem, and are powerful tools for detecting the changes in the sphysical features of subsurface lithological units, quality of water content, and clay content as well.
Acknowledgments
The author would like to extend their sincere appreciation to the King Abdulaziz City for Science and Technology (KACST) for funding this research work (Project No. 20-0133).
Declaration of Competing Interest
The author declare that he has no known competing financial interests or personal relationships that could have appeared to influence the work reported in this paper.
References
- Stochastic modeling of saltwater upconing under pumping wells due to variability in hydraulic conductivity. J. Al Azhar Univ. Eng. Sect. (JAUES). 2015;10:592-600.
- [Google Scholar]
- Integrated geophysical and hydrochemical investigations for seawater intrusion: a case study in southwestern Saudi Arabia. Arab. J. Geosci.. 2019;12:372.
- [CrossRef] [Google Scholar]
- Degradation of groundwater quality in coastal aquifer of Sabratah area. NW Libya. Environ. Earth Sci.. 2017;76
- [CrossRef] [Google Scholar]
- Al-Sagaby, I.A., 1978 Groundwater potentiality of Tabuk and saq aquifer in Tabuk area [M. Sc. Thesis]. Institute of Applied Geology, King Abdulaziz University, Jeddah, Saudi Arabia.
- Numerical simulation of seawater intrusion to coastal aquifers and brine water/freshwater interaction in south coast of Laizhou Bay. China. J. Contam. Hydrol.. 2018;215:1-10. PubMed: 29935809
- [CrossRef] [Google Scholar]
- Davies, F.B., 1985. Geologic Map of the Al Wajh Quadrangle, sheet 26B. Text. Saudi Arabian Deputy Ministry for Mineral Resources Geoscience MapGM, Kingdom of Saudi Arabia 83A, scale 1:250,000, 27.
- The integrated impacts of human activities and rising sea level on the saltwater intrusion in the east coast of the Yucatan Peninsula. Mexico. Nat. Hazards. 2017;85:1063-1088.
- [CrossRef] [Google Scholar]
- Saltwater intrusion in coastal aquifers: A primary case study along the Adriatic coast investigated within a probabilistic framework. Water. 2013;5:1830-1847.
- [CrossRef] [Google Scholar]
- Imaging the saline/fresh water interface at Bafra, Turkey using joint inversion of seismic refraction and ERT data. In: 8th Congress of the Balkan Geophysical Society, 05 October 2015. 2015. DOI, https://doi.org/10.3997/2214-4609.201414146
- [Google Scholar]
- Delineating multiple salinization processes in a coastal plain aquifer, northern China: hydrochemical and isotopic evidence. Hydrol. Earth Syst. Sci.. 2018;22:3473-3491.
- [CrossRef] [Google Scholar]
- Seawater intrusion mapping using electrical resistivity imaging (ERI) at Malaysian coastal area. Int. J. Civ. Eng. Technol. (IJCIET). 2018;9:1185-1193. Article ID: IJCIET_09_09_114
- [Google Scholar]
- Management of seawater intrusion in coastal aquifers: a review. Water. 2019;11:2467.
- [CrossRef] [Google Scholar]
- A preliminary lithofacies map of the Saudi Arabian shield. An interpretation of the lithofacies and lithostratigraphy of the Late Proterozoic layered rocks of Saudi Arabia. In: Saudi Arabian Deputy Ministry for Mineral Resources, Technical Record RF-TR-03-2. 1983.
- [Google Scholar]
- Johnson, P.R., 2005. Proterozoic geology of Western Saudi Arabia, northwestern sheet: amended May 2005. -File Report SGS-OF-2005-7. Saudi Geological Survey, Open.
- Sea-level rise impacts on seawater intrusion in coastal aquifers: review and integration. J. Hydrol.. 2016;535:235-255.
- [CrossRef] [Google Scholar]
- Simulation of saltwater intrusion in a poorly karstified coastal aquifer in Lebanon (eastern Mediterranean) Hydrogeol. J.. 2018;26:1839-1856.
- [CrossRef] [Google Scholar]
- Rapid least-squares inversion of apparent resistivity pseudosections by a quasi-Newton method. Geophys. Prospect.. 1996;44:131-152.
- [CrossRef] [Google Scholar]
- Modeling of seawater intrusion in a coastal aquifer of Karaburun Peninsula, western Turkey. Environ. Earth Sci.. 2017;76:775.
- [CrossRef] [Google Scholar]
- Salt-water intrusion mapping by geoelectrical imaging surveys. Geophys. Prospect.. 2000;48:647-661.
- [CrossRef] [Google Scholar]
- Panjaitan, D., Johannes, T., Nababan, E.S.M., 2018. Determining sea water intrusion in shallow aquifer using chloride bicarbonate ratio method. IOP Conf. S. Earth Environ. Sci.. International conference on Agribussines, Food and Agro-Technology 205, 012029. https://doi.org/10.1088/1755-1315/205/1/012029.
- Ramsay, C.R., Drysdall, A.R., Clark, M.D., 1986. Felsic Plutonic Rocks of the Midyan region, Kingdom of Saudi Arabia-I, Distribution, Classification, and resource potential, in. Journal of African Earth Sciences (1983) AR Drysdall, CR Ramsay & DB Stoeser (Eds.) Bulletin, 4, 63–77. https://doi.org/10.1016/S0899-5362(86)80068-9.
- Stochastic Modeling Of Saltwater Intrusion In Highly Heterogeneous Coastal Aquifers. Department of Civil and Environmental Engineering, Faculty of Engineering and Architecture, American University of Beirut; 2019. [Ph.D. Thesis]
- Impacts of seawater rise on seawater intrusion in the Nile Delta aquifer. Egypt. Groundwater. 2014;52:264-276. PubMed: 23600466
- [CrossRef] [Google Scholar]
- Geoelectrical and hydrogeochemical studies for delineating seawater intrusion in the outlet of Wadi Ham. UAE. Environ. Geol.. 2006;49:536-551.
- [CrossRef] [Google Scholar]
- Modeling saltwater intrusion at an agricultural coastal area using geophysical methods and the FEFLOW model. In: Engineering Geology For Society And Territory, 3: River Basins, Reservoir Sedimentation And Water Resources. 2015. p. :249-252. https://doi.org/10.1007/978-3-319-09054-2_51
- [Google Scholar]
- Impacts of sea-level rise and urbanization on groundwater availability and sustainability of coastal communities in semi-arid South Texas. Environ. Earth Sci.. 2014;71:2503-2515.
- [CrossRef] [Google Scholar]
- Seawater intrusion imaging at Tybaki, Crete, using geophysical data and joint inversion of electrical and seismic data. Near Surf. Geosci. First Break. 2014;32:107-114.
- [Google Scholar]
- On the classification of seawater intrusion. J. Hydrol.. 2017;551:619-631.
- [CrossRef] [Google Scholar]
- Assessing the pollution risk of a groundwater source field at western Laizhou Bay under seawater intrusion. Environ. Res.. 2016;148:586-594. PubMed: 26620978
- [CrossRef] [Google Scholar]
- Assessment of sea water inundation Along Daboo Creek area in Indus Delta region, Pakistan. J. Ocean Univ. China (Oceanic and Coastal Sea Research). 2017;16:1055-1060.
- [CrossRef] [Google Scholar]


