

Translate this page into:
An expedient and rapid High-Performance Liquid Chromatographic method for the kinetic study of Ketoprofen
⁎Corresponding authors. asmashafiqe246@gmail.com (Asma Shafique), muhammad.mushtaq@gcu.edu.pk (Muhammad Mushtaq)
-
Received: ,
Accepted: ,
This article was originally published by Elsevier and was migrated to Scientific Scholar after the change of Publisher.
Peer review under responsibility of King Saud University.
Abstract
A convenient and rapid High-Performance Liquid Chromatography (HPLC) based protocol was optimized for the routine analysis and kinetic study of Ketoprofen (KP) in plasma and urinary execration of patients. The optimized HPLC method was found to be linear over the wide range of KP concentration (1–90 µg/mL) with substantial recovery rates (95.5–97.63%) of calibration standards at an improved detection (0.02 μg/mL LoD) and quantitation limit (0.06 μg/mL LoQ) and acceptable inter and intraday variability (RSD ≤ 7.75%). The maximum amount (μg/mL) of KP was excreted through the urine of all participated patients during the first two hours (h) of oral administration. Likewise, a fast depletion in blood plasma concentration started early after oral administration. Overall, the present method provided a convenient, rapid, and reliable solution for the routine analysis and kinetic study of KP in biological samples.
Keywords
HPLC
Ketoprofen
Rapid analysis
Urinary and plasma excretion

1 Introduction
Ketoprofen (KP); chemically known as (2RS)-2-(3-benzoylphenyl) propanoic acid is a chiral and potent anionic non-steroidal anti-inflammatory drug (NSAID) of aryl propionic acid family (Glowka et al., 2011; Ong et al., 2008; Tettey-Amlalo and Kanfer, 2009). KP is often advised in clinical medicine to manage pain caused by inflammation or to minimize the symptoms of traumatic pain, rheumatic pain, (Carlucci et al., 2004; Magallanes et al., 2016) dysmenorrhea and postoperative pains (Koppala et al., 2016) due to its anti-inflammatory, (Mustonen et al., 2012) analgesic, and antipyretic properties (Champeau et al., 2016). KP has low water solubility and available in both systemic (oral, suppository or injectable) and local topical (patches, poultices, ointments, gels, creams, and lotions) formulations (Roda et al., 2002).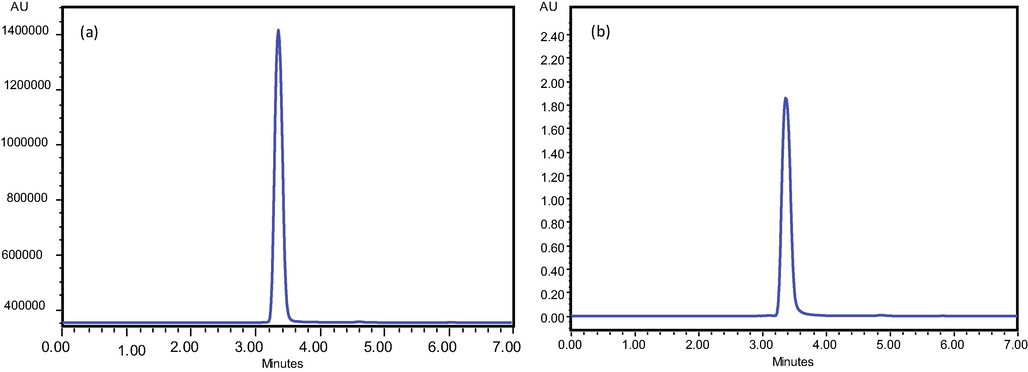
Typical Chromatograms of Ketoprofen standard at 90 μg/mL (a) and 2 μg/mL (b).
The intake of KP may cause gastrointestinal lesions, serious cardiovascular thrombotic events, myocardial infarction, peptic ulcers or stroke, which can be fatal sometimes (Nagai et al., 2015). All the side effects of KP such as photo-induced lipid peroxidation, DNA damage, and photo hemolysis are due to its phototoxic and photoallergic reactions (Li et al., 2012; Nanda et al., 2017). The epidemiological studies indicate that NSAIDs users have at higher risk of gastrointestinal ulceration than patients who are not taking NSAIDs. Due to specificity in its action, KP when administered orally is mainly absorbed in intestine before coming to colon (Xi et al., 2005). The KP from intestine is rapidly eliminated mainly by metabolism and urinary excretion conjugated with glucuronic acid and it is also thought that KP usually acts by inhibiting the synthesis of prostaglandins (Misra and Kishore, 2013). Residence time of this drug in stomach depends upon various behavioral and physiological factors like smoking, sex, amount, and mode of administration (Magallanes et al., 2016).
Various analytical methods involving the use of capillary electrophoresis (Li et al., 2003; Samakashvili et al., 2013; Zhou and Li, 2004), High-performance liquid chromatography (Assaf et al., 2017; Eichhold et al., 2000; Jedziniak et al., 2010; Lopez-Munoz et al., 2014; Patrolecco et al., 2013; Ye and Yu, 2003), isotopic dilution (Macià et al., 2006) or Liquid chromatography with multiple detectors like UV diode array and spectrofluorimetric detectors (Santos et al., 2005) have been followed for the determination of KP. Though, LC-MS methods for the determination of KP propose more sensitive and robust quantification, these instruments are either costly or very complex for routine analysis like kinetic studies or toxins screening (Hložek et al., 2014). The main objectives of the present study were to optimize and validate a convenient and fast chromatographic method for the routine analysis of KP. Moreover, the optimized and validated method was followed for the kinetic study of KP in blood and urine samples of human volunteers.
2 Materials and methods
The major portion of the present research was carried out in Analytical and Physical Chemistry Laboratories of Chemistry Department, Govt. College University, Lahore, Pakistan. All the experiments, documents, subjects, and samples were handled following guidelines laid for Good clinical practices (GCP), ICH Method development and validation, and World Health Organization (WHO) Ethical obligations.
2.1 Subject selection
A total of 50 male and female patients (10 from surgical unit-3 of Jinnah Hospital and 40 from Ghurki Trust Teaching Hospital) not having the symptoms of heart problem and hepatitis C, with average age 30–60 years and body weights 50–80 kg participated in the present work. Patient consent forms and information leaflets were signed by all the patients involved in the study.
2.2 Procurements of standards, supplies, and drugs
The drug used in this study project was KP 200 mg (Ketoflex Retard Tablets, Everest Pharmaceuticals). KP Standard was purchased from Sigma (St. Louis, USA), Ultrapure deionized water (In-vitro diagnostic laboratories, Pakistan) and HPLC grade solvents (Merck, Germany) were used during analysis.
A 200 mg dose of KP was given orally to all patients and urine and blood plasma samples were collected in sterilized vials at 2, 4, 6, 12, and 24 h. The urine and blood samples were frozen at −6 °C until analysis.
2.3 Calibration standards (STDs), quality controls (QCs) and mobile phase
The stock solution of KP (1.0 mg/mL) was prepared in ultra-pure deionized water and stored at 4.0 °C for further use. Eight calibration standards of 1, 5, 10, 20, 30, 40, 60, 90 µg/mL were prepared by diluting the stock solution with the determined volume of the mobile phase. Three quality control (QCL, QCM, and QCH) containing 2, 50 and 80 μg of standard KP/mL of plasma and urine were processed separately and run in triplicate daily for three consecutive days. The mobile phase was prepared by mixing HPLC grade CH3OH and deionized water in the 70:30 v/v ratios and pH was adjusted at 3.3 by the addition of CH3COOH. The mobile phase were blended (Gallen Kamp, England), filtered through cellulose acetate micro-filter (Sartorius, AG. 37,070 Goettingen, Germany) having a pore size and an internal diameter of 0.45 μm and 47 mm, respectively, and passed through the column with a flow rate of 1.0 mL/min.
2.4 HPLC system and analysis conditions
A Shimadzu HPLC system CBM‐20 A/20 equipped with a BDS Hypersil C18 column (250 × 4.6 mm and 5 μm internal diameter), LC‐10AT pumping system having FCU‐10AL VP flow controller valve, online degassing system DGU‐20 A3/DGU‐20 A5, LC‐20AT mobile phase distribution module and photodiode array detector. The chromatographic station CSW was used for regression analysis and data acquisition. Different concentrations of KP standards were run under various column conditions in isocratic mode until the well‐resolved peaks were obtained at 260 nm.
2.5 Sample preparation
The blood and urine samples of healthy volunteers were collected in previously sterilized glass tubes free of any additives. The both type of samples were simultaneously transferred to the analytical chemistry laboratory via specimen transporter kept at 4.0 °C. The 100 mL of subject blood samples were extracted with chloroform and phenol (1:1). The resultant aliquot was diluted with an equal volume of 1 M sodium bicarbonate solution and shaken with n-hexane to separate lipids (Koppala et al., 2016). The upper layer of solution was discarded and in the bottom layer of solution, a mixture of isopropanol and iso-octane (50:50) was added and vortex for 30 min at 200 rpm. The upper layer was collected, evaporated and dissolved in 5 mL of HPLC grade CH3OH. The sample was passed through a syringe filter of 0.45 µm pore size (Sartorius, AG. 37,070 Goettingen, Germany) and 20 µL of the final solution was injected into the HPLC column.
2.6 HPLC method validation and quality characterization
The developed method was validated using eight different concentrations of KP standards for three successive days in accordance with ICH (Guideline, 2005). Every day duplicate run of eight calibration standards (STD) was made to plot calibration curve and six replicates of each quality control (QCH, QCM, and QCL), extracted following the same procedure as documented above were carried out to assess the robustness of the analytical method.
2.7 Linearity
The linearity of the developed HPLC‐based method was assessed over a wide concentration range of KP (1–90 μg/mL). Duplicate calibrations were performed using eight selected concentrations for three consecutive days.
2.8 Recovery, detection limit, and quantification limit
The percent recovery of three quality control samples QCH, QCM, and QCL having 80, 50 and 2 μg/mL of standards (KP) was found. The detection limit (DL) and quantification limit (QL) were assigned as the analyte concentration producing a signal 3 and 10 times as compared to noise, respectively. The mean noise level was assigned to RSD of six blank runs (pure solvent) as documented in the International Conference on Harmonization (ICH, 2005).
2.9 Selectivity and stability
To see the selectivity of the developed method for the analyte, six different blank samples of blood serum and urine were injected and confirmed by the absence of a peak on the respective retention time. Moreover, the stability of the method was examined by increasing the concentrations of KP, freezing and storing standard solutions for 2 months.
2.10 Precision and accuracy
The QCs of each low (2 μg/mL), medium (50 μg/mL) and high concentration (80 μg/mL) were processed separately as mentioned above and run in triplicate daily for three consecutive days. Precision (inter and intraday reproducibility) of the developed method was assessed in terms of relative standard deviation while relative error (percentage) between observed mean concentration and spiked was applied to determine accuracy.
2.11 Carryover
The pure mobile phase was injected in the same volume to check the presence of contaminations, system errors or any other carryover.
3 Results and discussion
3.1 HPLC conditions and system suitability
The analytical and instrumental parameters were optimized to establish a quality separation of KP standards using a BDS Hypersil C18 column in isocratic mode (concentration of solvent to elute analyte remained constant). Initially, various mobile phases and stationary phases were checked to obtain the best results for the separation of KP and for the good resolution of peaks. For the development of a suitable method, the separation was started with less polar and more acidic mobile phases however, no peaks were obtained at acceptable retention time with appreciable resolution.
The polarity and pH of the mobile phase were then enhanced by the addition of CH3OH and CH3COOH. Finally, a mobile phase containing Methanol: water (70:30) was used and pH was adjusted at 3.3 by the addition of acetic acid. At a flow rate of 1 mL/min quite sharp and well resolved peak was observed at retention 3.384 min as shown in Fig. 1.
3.2 Method validation
3.2.1 Linearity
The detector response (peak area), when plotted against the injected concentration of the standard (KP) was found to be linear over the concentration range 1–90 μg/mL. The linearity of the developed assay was further manifested by repetitive chromatograms under the same chromatographic conditions. The observed values of the regression coefficient (R2), i.e. 0.9974 for KP were larger than required by the ICH Guidelines (ICH, 2005). In addition, the developed assay was linear over a wider concentration range than many previously reported methods. The data assembled in Table 1 indicates the precision and accuracy of analytical validation carried out following the calibration curve shown in Fig. 2. Moreover, following the slope and blank standard deviation approach, the limit of detection (LoD) and limit of quantification (LoQ) were found to be 0.02 μg/mL and 0.06 μg/mL which were reasonably higher than Dvořák et al. (2004)and equal to the assay devised by Garcia et al. (2001). The analysis time of the present method was shorter than previously document chromatographic methods by Dvořák et al. (2004) and Garcia et al. (2001).
Conc. Added µg/ml
Found (Mean ± SD)
Error (%)
Precious (RSD%)
1
1.04 ± 0.05
4.00
4.81
5
6.05 ± 0.48
9.54
7.77
10
10.7 ± 0.30
4.21
2.80
20
19.4 ± 0.73
6.32
3.77
30
28.6 ± 0.07
4.42
0.27
40
41.9 ± 0.63
6.25
6.61
60
62.9 ± 0.09
5.01
2.33
80
82.8 ± 1.71
5.62
1.90
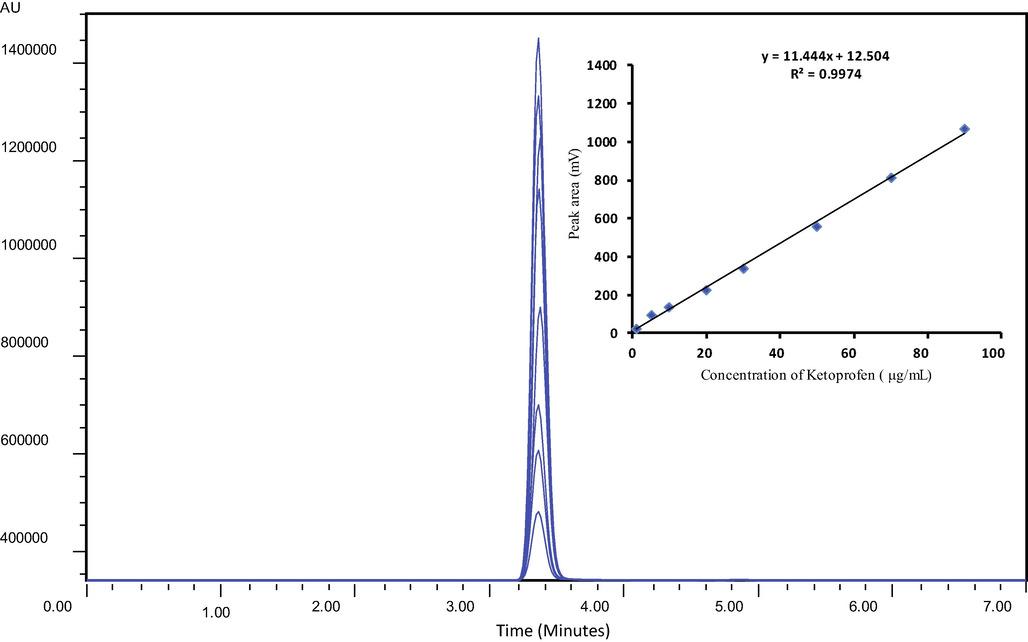
Overlay plot showing excellent linearity of peak area vs concentration.
3.2.2 Recovery, carryover, and selectivity
The analytical data assembled in Table 2 indicates inter-day (RSDr) and intraday variability (RSDR), recovery, and accuracy of the developed chromatographic method. Overall, the observed values of repeatability (RSDr), reproducibility (RSDR) of the assay were below the acceptable range of the ICG Guidelines (International Conference on Harmonization, 2005). An appreciable recovery rate (95.5–97.63%) of KP from QCs indicated good compatibility of extraction media for the analyte. Furthermore, the absence of a signal at the retention time (5 min) for carryover substances and blank authenticated the selectivity of the proposed analytical method. The standard concentration able to produce a peak 3 times the noise (LD) was 0.02 μg/mL and the LQ was 0.06 μg/mL. In general, relative standard deviation (RSD) less than 8% shows the stability of developed HPLC protocol.
Quality control
Spiking level (μg/mL)
Recovery (mean ± SD)
RSD (%)
Accuracy (% Error)
Present Study
Intraday
QCL
2
1.91 ± 0.15
7.853
95.5 (4.5)
QCM
50
48.41 ± 1.21
2.499
96.82 (3.18)
QCH
80
78.11 ± 2.14
2.739
97.63 (2.36)
Inter day
QCL
2
1.89 ± 0.15
7.930
94.6 (5.5)
QCM
50
47.30 ± 1.21
2.558
94.6 (5.4)
QCH
80
78.10 ± 1.89
2.419
97.62 (2.37)
Garcia et al., 2001
Intraday*
200
205.21 ± 5.09
2.48
2.6
800
805.59 ± 9.53
1.25
0.75
Inter day*
200
202.20 ± 4.56
2.21
1.02
800
778.33 ± 24.11
3.35
2.72
Dvořák et al. (2004)
Intraday*
Data not found
Data not found
1.22
2.6
–
–
Data not found
0.4
Inter day*
–
–
0.22
Data not found
–
–
Data not found
–
Allegrini et al. (2009)
Intra-day
30.0
24.6 ± 12.1
14.7
–
150.0
106.5 ± 3.1
4.30
–
350.0
280 ± 7.90
9.8
–
3.2.3 Precision and accuracy
The precision of the developed methodology for Inter day and intraday analysis of KP quality controls at higher (QCH), lower (QCL) and intermediate concentration (QCM) was observed and calculated in terms of relative standard deviation. Observed values of RSD (percentage) for intraday determination of KP were 7.853, 2.499 and 2.739. Similarly, for inter-day analysis RSDs (percentage) were 7.930, 2.558 and 2.419. Accuracy, assessed in terms of percentage error was 3.18–4.5 and 2.37–5.5% for KP. The overall variability in precision and accuracy did not exceed the ICG limit (15%) for a valid analytical method. The precision and accuracy of the present method were good as compared to previously documented RP-HPLC-DAD determination by Allegrini et al. (2009) and comparable with Dvořák et al. (2004) and (Garcia et al., 2001) as shown in Table 2.
3.2.4 Method robustness
The system robustness was checked for infinitesimally small variation in different conditions like extraction time, mobile phase composition, pH, and flow rate, temperature, and wavelength of the detector. A typical chromatogram indicated that these changes did not affect the stability of the developed assays. Similarly, freezing and multiple thaw cycles did not produce a signal intensity with RSD (percentage) >1%. Moreover, deviation in retention times of KP was observed to be small enough to be neglected within the permissible limits of the ICH Guidelines (ICH, 2005) for the validation of analytical procedures.
3.3 Urinary and plasma excretion of KP
The optimized and validated RP-HPLC-DAD method was finally applied to monitor the level of KP in blood and urine plasma of healthy volunteers. Fig. 3(a & b) indicates a typical chromatogram obtained for KP in urine and blood plasma of selected subjects after 2 h of oral administration of 200 mg tablet.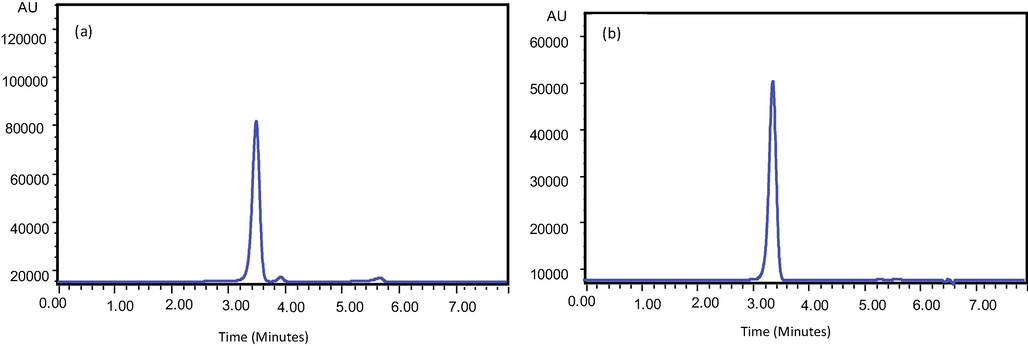
Typical chromatogram of Ketoprofen in human urine (a) and blood (b) collected after 2 h of 200 mg oral administration.
Overall, the maximum concentration of KP in urine and blood samples was observed after 2 h of dose administration. The kinetic curve for the concentration for KP in urine (Fig. 4) indicates an exponential decrease in its level during the first 6 h of oral administration.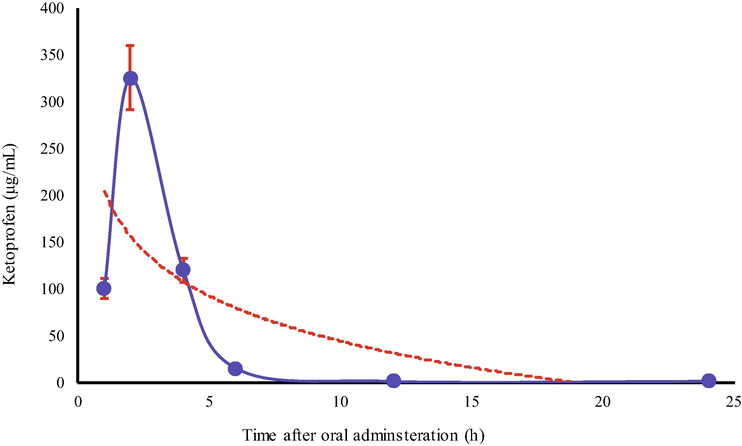
Kinetic curve for Ketoprofen in Urine samples of Healthy volunteers.
This kind of behavior indicates that a major fraction of administered KP excretes via urine during the first 2 h and then there happens a sharp decrease in its concentration. Unlikely, the concentration of KP depleted linearly with the passage of time (Fig. 5). In general, it can be predicted with reasonable confidence that drug binds reversibly with blood components and excrete during the first 24 h of oral administration. The majority of previously devised chromatographic methods (Dvořák et al., 2004; Garcia et al., 2001) have been applied to determine the active pharmaceutical ingredients (API) of pharmaceutical formulations, except Allegrini et al. (2009) who assessed systemic bioavailability of topically administered KP. The authors, likewise in the present study found that systemic bioavailability of KP was low enough to cause any gastrointestinal adverse effect.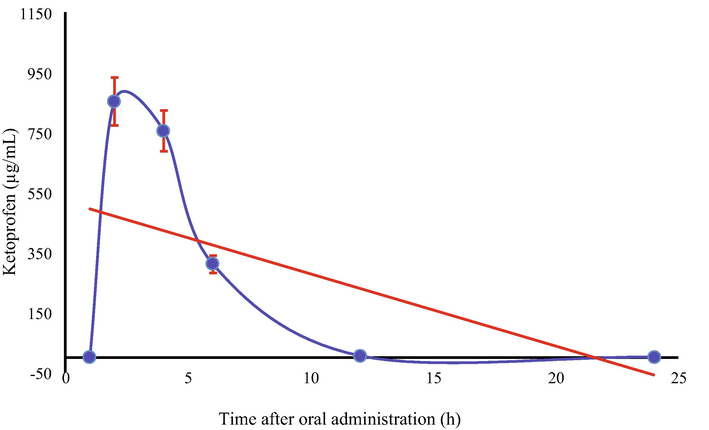
Kinetic curve of blood plasma concentration of Ketoprofen in Healthy volunteers.
4 Conclusion
The KP falls among the most frequently administered non-steroidal anti-inflammatory agent to cope with pains, particularly in surgical departments. The current study delivers a convenient and fast RP-HPLC-DAD based method for the routine analysis of KP from blood and urine plasma. The method was assessed against ICH guidelines which was found to be linear over 1–90 µg/mL with the regression coefficient (R2) value ≥ 95.74. Likewise, the recovery rate was also higher than 95 percent at acceptable precision and accuracy. The devised method was successfully applied to monitor the KP level in blood and urine samples of healthy volunteers which disclosed that a major fraction of KP excretes unbound simultaneously after its oral administration. The bound form of KP also depleted to very low during 24 h of oral administration.
Acknowledgments
The authors are thankful to Dr. Tayyab Abbas, Medical unit, Jinnah Hospital Lahore, Pakistan for the assistant regarding sample collection. The King Saud University, Riyadh, Saudi Arabia, provided finacial assistant under the project Researchers Supporting Project (RSP-2019/1).
Declaration of Competing Interest
The authors declare that they have no known competing financial interests or personal relationships that could have appeared to influence the work reported in this paper.
References
- Fast HPLC method for the determination of ketoprofen in human plasma using a monolithic column and its application to a comparative bioavailability study in man. Arzneimittelforschung. 2009;59(3):135-140.
- [Google Scholar]
- Photostability testing using online reactor HPLC hyphenation and mass spectrometric compound identification illustrated by ketoprofen as model compound. J. Pharm. Biomed. Anal.. 2017;145:414-422.
- [Google Scholar]
- Physicochemical compatibility between ketoprofen lysine salt injections (OKi Fiale, PG060) and pharmaceutical products frequently used for combined therapy. Boll. Chim. Farm.. 2004;143(1):15-19.
- [Google Scholar]
- Solubility and speciation of Ketoprofen and aspirin in supercritical CO2 by infrared spectroscopy. J. Chem. Eng. Data. 2016;61(2):968-978.
- [Google Scholar]
- Simultaneous HPLC determination of ketoprofen and its degradation products in the presence of preservatives in pharmaceuticals. J. Pharm. Biomed. Anal.. 2004;36(3):625-629.
- [Google Scholar]
- Determination of (R)- and (S)-ketoprofen in human plasma by liquid chromatography/tandem mass spectrometry following automated solid-phase extraction in the 96-well format. J. Mass. Spectrom.. 2000;35(4):504-511.
- [Google Scholar]
- Determination by HPLC of Ketoprofen in aqueous medium used for in vitro skin permeation studies. Anal. Lett.. 2001;34(11):1865-1874.
- [Google Scholar]
- Clinical pharmacokinetics of ketoprofen enantiomers in wild type of Cyp 2c8 and Cyp 2c9 patients with rheumatoid arthritis. Eur. J. Drug. Metab. Pharmacokinet.. 2011;36(3):167-173.
- [Google Scholar]
- I.H.T., 2005. Guideline Validation of analytical procedures: text and methodology. Q2 (R1) 1.
- Fast ibuprofen, ketoprofen and naproxen simultaneous determination in human serum for clinical toxicology by GC–FID. Clin. Biochem.. 2014;47(15):109-111.
- [Google Scholar]
- Determination of non-steroidal anti-inflammatory drugs residues in animal muscles by liquid chromatography–tandem mass spectrometry. Anal. Chim. Acta. 2010;672(1–2):85-92.
- [Google Scholar]
- Development and validation of a novel stability-indicating RP-HPLC method for the simultaneous determination of related substances of Ketoprofen and omeprazole in combined capsule dosage form. J. Chromatogr. Sci.. 2016;54(5):765-775.
- [Google Scholar]
- Study on the protein binding of ketoprofen using capillary electrophoresis frontal analysis compared with liquid chromatography frontal analysis. J. Chromatogr. Sci.. 2003;41(3):137-141.
- [Google Scholar]
- Direct observation of triplet state mediated decarboxylation of the neutral and anion forms of ketoprofen in water-rich, acidic, and PBS solutions. J. Phys. Chem. B. 2012;116(20):5882-5887.
- [Google Scholar]
- Lopez-Munoz, F.J., Vara Gama, N., Soria-Arteche, O., Hurtado y de la Pena, M., Dominguez-Ramirez, A.M., Medina Lopez, J.R., 2014. HPLC method with solid-phase extraction for determination of (R)- and (S)-ketoprofen in plasma without caffeine interference: application to pharmacokinetic studies in rats. J. Chromatogr. Sci. 52(10), 1204–1210.
- Different sample stacking strategies to analyse some nonsteroidal anti-inflammatory drugs by micellar electrokinetic capillary chromatography in mineral waters. J. Chromatogr. A. 2006;1117(2):234-245.
- [Google Scholar]
- Sex and food influence on intestinal absorption of Ketoprofen gastroresistant formulation. Clin. Pharmacol. Drug. Dev.. 2016;5(3):196-200.
- [Google Scholar]
- Differential modulation in binding of ketoprofen to bovine serum albumin in the presence and absence of surfactants: spectroscopic and calorimetric insights. Chem. Biol. Drug. Des.. 2013;82(1):81-98.
- [Google Scholar]
- Enantiospecific ketoprofen concentrations in plasma after oral and intramuscular administration in growing pigs. Acta Vet. Scand.. 2012;54:55.
- [Google Scholar]
- Pharmacokinetics and antiinflammatory effect of a novel gel system containing Ketoprofen solid nanoparticles. Biol. Pharm. Bull.. 2015;38(12):1918-1924.
- [Google Scholar]
- Nanda, S., Sharma, G., Katare, O.P., 2017. Systematically optimized Ketoprofen-loaded novel proniosomal formulation for periodontitis: in vitro characterization and in vivo pharmacodynamic evaluation. AAPS Pharm. Sci. Tech. 18(5), 1863–1880.
- Enantioseparation of (R, S)-ketoprofen using Candida antarctica lipase B in an enzymatic membrane reactor. J. Sep. Sci.. 2008;31(13):2476-2485.
- [Google Scholar]
- Simultaneous determination of human pharmaceuticals in water samples by solid phase extraction and HPLC with UV-fluorescence detection. Microchem. J.. 2013;107:165-171.
- [Google Scholar]
- Bioavailability of a new ketoprofen formulation for once-daily oral administration. Int. J. Pharm.. 2002;241(1):165-172.
- [Google Scholar]
- Comparative enantioseparation of ketoprofen with trimethylated alpha-, beta-, and gamma-cyclodextrins in capillary electrophoresis and study of related selector-selectand interactions using nuclear magnetic resonance spectroscopy. Chirality. 2013;25(2):79-88.
- [Google Scholar]
- Simultaneous determination of pharmaceutically active compounds in wastewater samples by solid phase extraction and high-performance liquid chromatography with diode array and fluorescence detectors. Anal. Chim. Acta. 2005;550(1–2):116-122.
- [Google Scholar]
- Rapid UPLC–MS/MS method for the determination of ketoprofen in human dermal microdialysis samples. J. Pharm. Biomed. Anal.. 2009;50(4):580-586.
- [Google Scholar]
- Study on the characteristics of pectin–ketoprofen for colon targeting in rats. Int. J. Pharm.. 2005;298(1):91-97.
- [Google Scholar]
- Enantiomeric separation of ketoprofen by HPLC using chirobiotic V CSP and vancomycin as chiral mobile phase additives. Yao Xue Xue Bao. 2003;38(3):211-214.
- [Google Scholar]
- Study of protein binding in ketoprofen using liquid chromatography frontal analysis in comparison with capillary electrophoresis frontal analysis. Se Pu. 2004;22(6):601-604.
- [Google Scholar]


