

Translate this page into:
Administration of Costus igneus Nak leaf extract improves diabetic-induced impairment in hepatorenal functions in male albino rats
⁎Corresponding author. younismajeed64@gmail.com (Younis Ahmad Hajam)
-
Received: ,
Accepted: ,
This article was originally published by Elsevier and was migrated to Scientific Scholar after the change of Publisher.
Peer review under responsibility of King Saud University.
Abstract
Objectives
The present study was designed to evaluate the therapeutic efficacy Costus igneus Nak leaf extract against the diabetes-induced hepatorenal injury in rats.
Methods
Diabetes was induced in male albino rats by administering single injection of streptozotocin (55 mg/kg) for one day. The diabetic condition was established by estimation of blood glucose level; animals with blood glucose levels above 250 mg were considered as diabetic. Following the confirmation, animals were randomly divided into seven experimental groups, viz group I served as the control, group II-CI-300mg/Kg (per se), group III-Diabetic, group IV-diabetic+CI (100mg/kg), group V-diabetic+CI (200mg/kg), group VI-Diabetic+CI (300 mg/kg) and group VII-diabetic+glibenclamide (0.5mg/kg). Treatment regimens were started 24 h after the confirmation of the successful induction of diabetes and continued for four consecutive weeks at three doses (100–300 mg/kg). After the completion of experimental period animals were sacrificed, blood was collected through retro-orbital puncture for separation of serum for assessment of liver (ALT, AST, ALP, albumin, globulin and bilirubin) and kidney-specific biomarkers (creatinine, urea, and uric acid, Na+ and K+), and inflammatory cytokines (TNF-α, IL-6, IL-1β, TGF-β1, IL-10. Liver and kidneys were harvested for histopathology and biochemical screening. Hepatorenal protective activity was evaluated by estimating different biochemical variables and histopathology by hematoxylin and eosin staining of the liver and kidney tissues.
Results and Conclusions
Three different daily doses of the plant extract showed recovery in all the biochemical parameters such as lipid peroxidation, reduced glutathione, superoxide dismutase, catalase, glucose-6-phosphate dehydrogenase, glutathione reductase, glutathione peroxidase, and glutathione-S-transferase; ALT, AST, and ALP; creatinine, urea, and uric acid; total cellular protein content in tissues, glycogen content, and serum protein content (albumin and globulin); and inflammatory cytokines. However, significantly higher recovery was observed in the 300 mg/kg dose treated group of animals. Considerations of the serological, biochemical and histopathological studies, it may be concluded that that the C. igneus Nak leaf extract abolished various deleterious effects of type 1 diabetes induced hepatorenal functions.
Keywords
Diabetes
Liver
Kidney
Herbal medicine
Oxidative stress
Streptozotocin

1 Introduction
Diabetes mellitus is a chronic endocrino-metabolic disorder characterized by a prolonged hyperglycemia level, which resulted either due to the inability of βcells to synthesize or release insufficient insulin (type 1 diabetes) or when the cells do not use insulin efficiently (type 2 diabetes). Diabetes causes alterations in different biomolecules such as carbohydrates, fats, and proteins and subsequently leads to hyperglycemia, glycosuria, hyperlipidemic, and atherosclerosis (Behradmanesh et al., 2013). Prolonged hyperglycemia and rise in inflammation lead to the progression of other negative effects, including hepatic damages (Hajam and Rai, 2019).
The International Diabetes Federation (IDF) reported that 463 million adult diabetic persons were reported in 2019, and it may increase upto 700 million by 2045 (Diabetes Atlas, 2019). Moreover, in 2012, diabetes caused 2.2 million deaths due to prolonged hyperglycemia. In 2015 (IDF Diabetes, 2015) 1.3 million deaths occurred because of diabetic-induced kidney diseases (Luyckx et al., 2018). In 2014, the World Health Organization (WHO) reported that incidences of diabetes were approximately 9% in adults, and it has been projected that in 2030, diabetes might be the 7th leading reason of mortality in the globe (Msopa and Mwanakasale, 2019). Synthetic regular drugs used in pharmacotherapy of diabetes control glucose metabolism efficiently, but they are associated with other side effects such as metformin that leads to gastrointestinal problems (Kirpichnikov et al., 2002) and insulin treatment leads to weight gain (Russell-Jones and Khan, 2007). In addition to this, these standard pharmacotherapies do not solve the issue of elevated levels of reactive oxygen species completely and the progression of diabetic complications completely. Furthermore, synthetic drugs are having limited access due to the high cost of healthcare, socioeconomic condition, or regional availability. Therefore, there is a need to find a new, low cost, and easily available therapy having the potential to decrease the incidence of the emergent healthcare burden. Most probably, this problem might be solved by the addition of plant-derived ingredients and/or functional foods including the use of medicinal plants in the routine diet (Mollica et al., 2018). Plants have been used as alternative diabetic medicines for centuries due to their antioxidant, hypoglycemic, hypolipidemic, hepatoprotective, neuroprotective, and nephroprotective activities, different ethnopharmacological therapies are prepared from medicinal plants for curing diabetes and associated complications (Li et al., 2015). Tremendous research has been carried out in in pharmacotherapy, however utilization of conventional herbal remedy might be a better alternative due easily availability, cost-effective and devoid side defects (Farnsworth et al., 1985).
Costus igneus Nak is commonly called the Spiral flag (Costaceae family). C. igneus Nak possesses the potential to increase insulin by strengthening β-cells of pancreas in the human body and is universally recognized as the insulin plant in India. Literature survey reveals that C. igneus Nak possesses hypolipidemic, diuretic, anti-oxidant, anti-microbial, and anti-cancerous properties (Majumdar and Parihar, 2012). As stated by conventional medical professionals, with the diagnosis of complex diseases that include diabetes, the administration of herbal drugs might be far more valuable in comparison to other therapies based on individual medicinal plant utilization (Mahajan et al., 2018). Use of traditional medicine is used from very long time has a long. It is the collective knowledge, skill, and practices based on the theories, principles, and experiences indigenous to various cultures, whether explicable or not, used in the maintenance of health as well as in the prevention, diagnosis, improvement or treatment of physical and mental sickness. The collective influence of herbal therapy formulations leads to an improved restorative result through enhancing their protective impacts, while reducing their toxicity (Han et al., 2019). Instead of the broad use of these herbal medicinal formulations in conventional medicines, however, no potential research data are available with regard to anti-diabetic ethnopharmacological importance. Therefore, current study was aimed to evaluate the therapeutic potency of C. igneus Nak leaf extract against diabetic-induced hepatorenal alterations.
2 Materials and methods
2.1 Chemicals and reagents
All the chemicals (analytical grade) used for experimentation were procured from Himedia limited, India, and Sisco Research limited, India. Centrifuge (Remi C24BL) and UV Visible Spectrophotometer (LAMBA, Perkin Elmer, Waltham, MA USA) were used to process and record the absorbance.
2.2 Serum biochemistry kits
Commercial biochemical kits for serum biochemical analysis in liver function tests vizalanine aminotransferase (ALT), aspartate aminotransferase (AST), and alkaline phosphatase (ALP) and renal function tests (creatinine, urea, and uric acid) were procured from ERBA diagnostic, Germany. Lipid profile kits include: triglyceride (TG), cholesterol (CHOL), and low- and high-density lipoprotein kits (LDL and HDL) were purchased from ERBA diagnostic, Germany. Total protein content, albumin, bilirubin, and electrolyte kits for sodium (Na+) and potassium (K+) were purchased from ERBA diagnostic, Germany.
2.3 ELISA kits
Kits for different inflammatory cytokines such as tumor necrosis factor-α (TNF-α), transforming growth factor beta-1 (TGF-β1), interleukin-1 (IL-1β), interleukin-6 (IL-6), and interleukin-10 (IL-10) were purchased from Abcam, Cambridge, MA, USA.
2.4 Preparation of plant extract
C. igneus Nak plant material was collected from Hamirpur district, Himachal Pradesh, India. The plant was identified by a renowned botanist. The plant was cleaned in distilled water (d·H2O) to make the plant dirt-free. Subsequently, the plant was shade-dried at optimum temperature (37°C). Leaves were crushed in an electric mixer to make a fine powder. The fine powder was processed for the preparation of extract in 70% ethanol (solvent) in an accelerated solvent extractor (DIONEX, ASE-150) at −20 °C and 15 atm pressure (Azwanida, 2015). The standard operational method was used to ensure quality during the preparation of extract (Fibigr et al., 2018). The extract was allowed to dry at optimum temperature (37°C). The percent yield of C. igneus Nak was 67.8%. The dried extract was stored in a refrigerator at 4°C till further phytochemical screening, antioxidant screening, and therapeutic evaluation against diabetic-induced hepatorenal complications.
2.5 Qualitative phytochemical screening
Crude extract of C. igneus Nak was examined for the detection of different phytochemicals, including alkaloids, flavonoids, phenols, saponins, terpenoids, and tannins and anthraquinones following the standard methods (Harbone, 1973; Trease and Evans, 1989). Change in color or precipitate formation observed was used as a marker of positive response to these tests. All the qualitative tests were conducted according to the methods (Harbone, 1973; Trease and Evans, 1989).
2.5.1 Detection of alkaloids
Approximately 15 mg of extract was mixed with 2 mL of 5% HCl that was homogenized, followed by shaking to mix the extract with the HCl properly and then filtered; three aliquots were separately prepared. Drops of Wagner, Mayer, Bouchardat, and Dragendorff reagents were added one by one to all the tubes. A red-brown precipitate (Wagner), yellowish-white precipitate (Mayer), Formation of brown precipitate (Bouchardat), and red–orange precipitate (Dragendorff) revealed the presence of each metabolite.
2.5.2 Detection of flavonoids
2.5.2.1 Shinoda’s test for the detection of flavonoids
Roughly 0.5 mg of extract was dissolved in 1 mL isopropyl alcohol, then 1 mL of absolute alcohol, and 3 drops of concentrated HCl were added. Red color formation revealed the occurrence of aurones and chalcones. However, under some conditions, change in color did not occur; therefore, in these cases a small amount of magnesium was added. Production of orange, red, or magenta color indicated the presence of flavones in the extract.
2.5.2.2 Test for flavonoids
Roughly 0.5 mg of extract was dissolved in 2 mL of isopropyl alcohol and then three drops of 10% NaOH w/v solution were added. The reaction resulted in the production of yellow–red, coffee-orange, and purple-red color, which showed that xanthones and/or flavones, flavonols, chalcones, and anthocyanins were present, respectively.
2.5.2.3 Foam test for saponins
An amount of 20 mg extract was dissolved in 2 mL of isopropyl alcohol. From this stock, 2 mL of dissolved extract was taken in a test tube and then the mixture was shaken vigorously. Vigorous shaking caused the formation of froth and then, a few drops of olive oil was added and was again vigorously mixed. The formation of a foamy layer showed the presence of saponins in the extract.
2.5.3 Detection of glycosides
2.5.3.1 Liebermann’s test for detection of glycosides
An amount of 0.5 mg extract was dissolved in 2 mL of acetic acid and then chloroform was added. The whole reaction mixture was allowed to cool and then some drops of concentrated H2SO4 were added. Formation of green color showed the presence of aglycone (steroidal part of glycosides).
2.5.3.2 Keller-Kaliani test for the detection of glycosides
An amount of 10 mg extract was dissolved in 5 mL of d·H2O followed by 4 mL of glacial acetic acid and 2% of FeCl3, finally 1.5 mL of concentrated H2SO4 was added. The formation of a brown ring sandwiched between layers revealed that cardiac steroidal glycosides were present.
2.5.3.3 Salkowski’s test for detection of glycoside
A small quantity of extract was dissolved in double H2O to which 2.5 mL of concentrated H2SO4 was added. Formation of reddish-brown color revealed that the steroidal aglycone part of glycoside was present in the extract.
2.5.3.4 Test for tannins
Roughly 10 mg extract was dissolved in 1 mL of 70% ethanol, followed 2 mL of d. d·H2O, then 4–10 drops of 10% (w/v) ferric chloride aqueous solution. Production of blue or green color showed that tannins were present in the extract.
2.6 Quantitative assessment of phytochemicals
2.6.1 Antioxidant activity: DPPH free radical scavenging assay
Free radical scavenging activity was estimated by 2,2-diphenyl-1-picryl-hydrazyl (DPPH) by following the method of Blois with some modifications (Blois, 1958). A 0.2 mmol/L solution of DPPH was prepared in methanol. Different concentrations of the plant extract (50–250 μg/mL) were prepared in separate tubes, and 500 μL of DPPH prepared reagent was added in all the tubes. In each tube (n=3), the reaction mixture was shaken forcefully and then left to stand as such for 30 min at room temperature. Control solution was processed in the similar pattern without the addition of plant extract, and methanol was used for baseline correction. The absorbance was determined at 517nm by using a spectrophotometer. Decrease in absorbance revealed the increase in free radical scavenging activity. Vitamin C (ascorbic acid) was taken as standard to compare results. The potential of DPPH free radical scavenging activity was calculated by using the below given formula: DPPH scavenging activity (% of inhibition) = (Ao-A1)×100/Ao Where
Ao is the absorbance of the control
A1 is the absorbance of the sample extract
The IC50 (the microgram of extract to scavenge 50% of the radicals) value was used for calculation using the linear regression analysis. Decreased value indicated the higher antioxidant activity.
2.6.2 Assessment of total polyphenolic content
The total polyphenols were determined by the Folin-Ciocalteu method of Sidduraju and Becker (Siddhuraju and Manian, 2007). An amount of 20 µg of plant extract was added to a test-tube, and 1 mL of d·H2O was added. Then, 50 µL of diluted Folin-phenol reagent (1:1 ratio with water) and 2.5 mL of 20% sodium carbonate were added. The whole reaction solution was shaken properly and then incubated in a dark chamber for 40 min to produce color. Following incubation, absorbance was taken at 725nm. The total phenolic content was estimated by plotting a standard curve using various separate concentrations of gallic acid. The results were expressed in mg GAE/g.
2.6.3 Assessment of alkaloids
Alkaloids in the extract were estimated by following the protocol of Obadoni and Ochuko (Obadoni and Ochuko, 2001) with some modifications. 2 g of C. igneus Nak extract was dissolved in 10 mL of d·H2O, to which 200 mL of 20% v/v acetic acid was added and then incubated for 4 h. Following the incubation period, the reaction mixture was filtered, in the filtrate ammonium hydroxide was added drop by drop till the absolute formation of precipitate. The solution was left to stand so that the solid settled down and the precipitate was collected and then weighed. Total percentage of alkaloid was calculated by using the formula given below: Percentage of total alkaloids (%) = Weight of precipitate × 100/Weight of sample taken
2.6.4 Determination of flavonoid content
The flavonoid content was assessed by the method of Zhishen et al., (Zhishen et al., 1999). Plant extract (2gm) was dissolved in 5 mL of 70% ethanol. From this stock, 1 mL of leaf extract was mixed with 200 µL of d·H2O and 150 µL of 5% sodium nitrite, and then incubated for 10 min. After addition of 2 mL of 4% w/v NaOH and 5 mL with d·H2O in the reaction mixture. The mixture was shaken vigorously and then again incubated for 20 min at room temperature. Production of pink color revealed that flavonoids were present in leaf extract. Absorbance was recorded at 510nm. Total flavonoid was expressed as rutin equivalent mg RE/g of extract on dry weight basis using the standard curve.
2.6.5 Determination of flavones and flavonol content
Total flavones and flavonols were quantified by following the aluminum chloride method (Cvek et al., 2007). An amount of 500 mg of plant extract was dissolved in 2 mL of 70% ethanol, which 0.2 mL of AlCl3 and then 2.8 mL of glacial acetic acid were added to get the final volume of upto 5 mL. The whole reaction mixture was incubated for 30 min at room temperature. Absorbance was taken at 415 nm. The total flavones and flavonols were quantified by plotting a standard curve using various concentrations of quercetin. The results were expressed in mg QE/g.
2.7 Animal maintenance
Experimental work on animals was conducted according to the Institutional Practices of Institutional Animal Ethics Committee (IAEC) of Department of Biosciences, Himachal Pradesh University (Registration Number: 1887/Go/Re/S/16/CPCSEA) Shimla, Himachal Pradesh, India and according to the revised framework (Specific Procedure) Act of 2002 of Govt. of India on animal welfare. Male albino Wistar rats of similar age group with a weight range from 180 to 200 g were acclimatized to the laboratory conditions (standard temperature, humidity, and light with the supplementation of food and water ad libitum) for 2 weeks. Following acclimatization, animals were randomly divided into nine groups (n=5).
2.8 In vivo studies
2.8.1 Acute oral toxicity study
Acute toxicity study was conducted according to the guidelines of the Organization for Economic Cooperation and Development (OECD) 420 (OECD, 2002), with few amendments. Animals were fasted overnight, randomly divided into five groups (n=5), and treated with low doses (100, 200, 300, and 400 mg/kg) of the leaf extract through oral gastric gavage. Animals were examined at one hour, each 1 h for the next 5 h and every 24 h for upto 14 days for some physical symptoms of toxicity that include alterations in the rate of respiration, alteration in grooming habits, diarrhea and lethality.
2.8.2 Sub-chronic oral toxicity study
Sub-chronic toxicity study was conducted according to the recommendations of OECD (Repeated Dose for 28 days) (OECD, 2018) with few changes. Five groups of six animals were used: HC, CI-100, CI-200, CI-300, and CI-400 groups. Every morning for 28 days, the healthy control (HC) group was administered with water, while CI-100, CI-200, CI-300, and CI-400 groups received the CI plant extract (100, 200, 300, and 400 mg of plant extract/kg, respectively), by oral gavage. Body weight was noted daily. The blood glucose level was measured weekly in blood drained from the tail vein by suitable glucometer (ACCUCHECK) Roche Diabetes Care GmbH Sand Hofer Strasse 11668305 Mannheim, Germany.
2.9 Induction and confirmation of diabetes
Total 42 rats were selected for this study and were divided into two main groups. Group-1 (n=12) and were further sub divided into two (2) different groups, namely group-I: normal control, and group-II: leaf extract treated-300 mg/kg (per se). Group-2 (n=30) rats were treated with streptozotocin (STZ) injection (55 mg/kg). Following the confirmation of diabetes by checking the blood glucose level, blood glucose level above 250 mg/dl was confirmed as diabetic. Thirty (30) diabetic rats were further subdivided into following subgroups and were administered different doses of leaf extract, namely group-III served as Diabetic control, group-IV was treated with C. igneus Nak extract (100 mg/kg), group-V was treated with C. igneus Nak extract (200 mg/kg), group-VI was given treatment of C. igneus Nak extract (300 mg/kg), and group-VII was treated with Glibenclamide (0.5 mg/kg), respectively.
On the completion of the experimental period (4 weeks), animals were euthanized (by putting cotton plug in desiccator soaked in chloroform) and then sacrificed. The liver and kidneys were dissected out and were fixed in Bouin’s fluid for histological examinations. Furthermore, the liver and kidneys were assessed for lipid peroxidation (LPO), reduced glutathione (GSH), superoxide dismutase (SOD), catalase (CAT), and GSH cycle such as glutathione peroxidase (GPX), glutathione reductase (GR), glucose-6-phosphate dehydrogenase (G6PDH), and glutathione-S-transferase (GST) activities. Serum was separated from the blood by centrifugation at 3000g and stored as -20 °C for serum biochemistry. Serum was examined for liver function tests: ALT, AST, and ALP; kidney function tests: creatinine, urea, and uric acid; electrolytes: sodium ion (Na+) and potassium ion (K+); and total serum protein content (albumin and globulin).
2.10 Hepatorenal tissue biochemistry (Assessment of oxidative stress markers and antioxidant status)
Assessment of oxidative stress in the liver and kidneys was done using the following protocol (Ohkawa et al., 1979). Formation of a pink-colored complex with Thiobarbituric acid reactive oxygen species (TBARS) resulted because of the reaction between thiobarbituric acid and malonaldehyde, which was assessed. Total thiol content (reduced GSH) was estimated by applying the protocol described by Sedlak and Lindsay (Sedlak and Lindsay, 1968), by adding 5-5′-dithiobis 2-nitrobenzoic acid that resulted in the formation of a yellow-colored complex. SOD was evaluated by following the method of Kakkar et al., (Kakkar et al., 1983) and absorbance was recorded at 560 nm. CAT activity was assessed by recording the decomposition of hydrogen peroxide/min as described by Beers and Size (Beers and Sizer, 1952). Activities of GSH cycle enzymes such as Glucose-6-phosphate dehydrogenase which was estimated by oxidation of glucose-6-phosphate to 6-phosphogluconate which concurrently causes the reduction of co-enzyme NADP+ to NADPH, resulting in an increase absorbance at 340 nm (Ells and Kirkman, 1961). Activity of GPX was determined, when sample reacts with H2O2 in the presence of GSH for a particular time (Paglia and Valentine, 1967). Activity of GR was assessed by oxidation of NADPH to NADP+ resulting in decreased absorbance at 340 nm (Goldberg, 1984). Glutathione-S-transferase (GST) activity was estimated by the following method; reaction of 1-Chloro-2,4-dinitrobenzene (CDNB) with glutathione completely depends on the presence of active GST (Habig et al., 1974). Glycogen was quantified by digestion with 30% KOH in a boiling water bath at 50 °C and then cooling followed by a second cycle of boiling and cooling. 10 mL of anthrone were added (200 mg of anthrone was dissolved in 95% sulphuric acid) in chilled water or in ice containing bucket and the reading was recorded at 625 nm (Seifter et al., 1950). Quantification of total protein level in homogenates was assessed, by reaction of protein with Folin’s Ciocalteu reagents to produce a colored complex. The proteins react with Folin’s reagent, due to the presence of aromatic amino acids. Production of blue color, and the intensity of color is directly related to the protein content. Optical density was read at λ 625nm (Lowry et al., 1951).
2.11 Serum biochemistry
2.11.1 Assessment of hepatic indicators
Hepatic enzymes and other associated variables: alanine amino transferase (ALT) or serum glutamic-pyruvic transaminase (SGPT), aspartate amino transferase (AST) or serum glutamic-oxaloacetic transaminase (SGOT), and alkaline phosphatase (ALP), and bilirubin, protein content, albumins, globulins, TG, CHOL, LDL, very low density lipoproteins (VLDL), and HDL levels in circulatory serum were determined by analytic kits per the procedures provided with commercial kits acquired from ERBA Diagnostics (Mannheim GmbH Mallaustr, Germany).
2.11.2 Kidney function tests
In serum, various Kidney Markers: creatinine, urea, and uric acid levels and electrolytes: Na+ and K+ ion levels were evaluated using analytic kits according to the instructions given in the manual procured from ERBA Diagnostics (Mannheim GmbH Mallaustr, Germany).
2.11.3 Evaluation of inflammatory cytokines in blood serum
Various proinflammatory and anti-inflammatory cytokines (TNF-α, TGF-β1, IL-1β, IL-10 and IL-6) were determined in serum by using ELISA assay kits, and assessments were done as per the instructions given in the manual purchased from Abcam (Cambridge, MA, USA).
2.11.4 Histological preparation
The liver and kidneys were harvested, washed with normal saline, and then fixed in Bouin’s fluid. Tissues (the liver and kidneys) of all experimental groups were dehydrated by different graded series of ethanol. Tissues were cleared by xylene and embedded in paraffin wax. Tissue sections of 4-5µm thick were cut with rotary microtome (Leica RM 2125-RT 5, Biosystems Nussloch GmbH) stained with hematoxylin and eosin, mounted with DPX (Dibutylphthalate Polystyrene Xylene), and examined under a light microscope (Magnus, India).
2.12 Statistical analysis
Results were expressed as the mean ± S.E. for each group containing six animals. Results were analyzed through SPSS (IBM 20.0 version software), groups were compared with each other using One-way analysis of variance (ANOVA) followed by student's t-test computed at p < 0.05.
3 Results
3.1 Qualitative phytochemical screening
Phytochemical screening of ethanolic extract of C. igneus Nak leaves showed the presence of flavonoids, alkaloids, saponins, glycosides, and tannins (Table 1).
Phytochemical
Result
a). Qualitative
Alkaloids
Present
Flavonoids
Present
Saponins
Present
Glycosides
Present
Tannins
Present
b). Quantitative
Phytochemical
Concentration (mg/g)
Polyphenols
46.8 GA (gallic/g)
Flavonoids
22.3 QE (Quercetin/g)
Flavones and flavanols
1.75 RE (Rutin/g)
3.2 Quantitative phytochemical screening
C. igneus Nak ethanolic leaf extract was processed for quantitative assessment of various polyphenolic compounds such as alkaloids, phenolics, flavonoids, flavones, and flavones. Table 2 summarizes the content of polyphenols were 46.8 mg GA (gallic/g), flavonoids 22.3 mg QE (Quercetin/g), flavones and flavanols 1.75 mg RE (Rutin/g) and alkaloids (59.9 CE (caffeine mg/g). The ethanolic leaf extract of C. igneus Nak at different concentrations ranging from 1 to 100 μg/mL was compared with vitamin C (ascorbic acid) as standard. Fig. 1a shows DPPH radical scavenging activity of the leaf extract of C. igneus Nak and vitamin C at different concentrations (Table 1; Fig. 1a). For C. igneus Nak leaf extract at 100 µM/ml concentration, the % inhibition 91.08 ± 1.47. HC; Healthy Control; CI-100: Costus igneus 100 mg/kg; CI-200: Costus igneus 200 mg/kg. Costus igneus 300 mg/kg; and Costus igneus 400 mg/kg. Data were expressed as the mean ± standard deviation, n = 6, *p < 0.05 than that of the HC group.
Treatment Groups
Weekly changes in blood glucose level (mg/dl)
Day 0
Day 7
Day 14
Day 21
Day 28
HC
132 ± 7
130 ± 6
131 ± 8
132 ± 3
130 ± 6
CI-100
128 ± 10
129 ± 7
130 ± 14
129 ± 9
131 ± 10
CI-200
126 ± 8
131 ± 9
130 ± 12
131 ± 10
131 ± 12
CI-300
128 ± 12
132 ± 4
130 ± 16
129 ± 8
130 ± 11
CI-400
120 ± 4
121 ± 8*
118 ± 7*
116 ± 15*
114 ± 9*
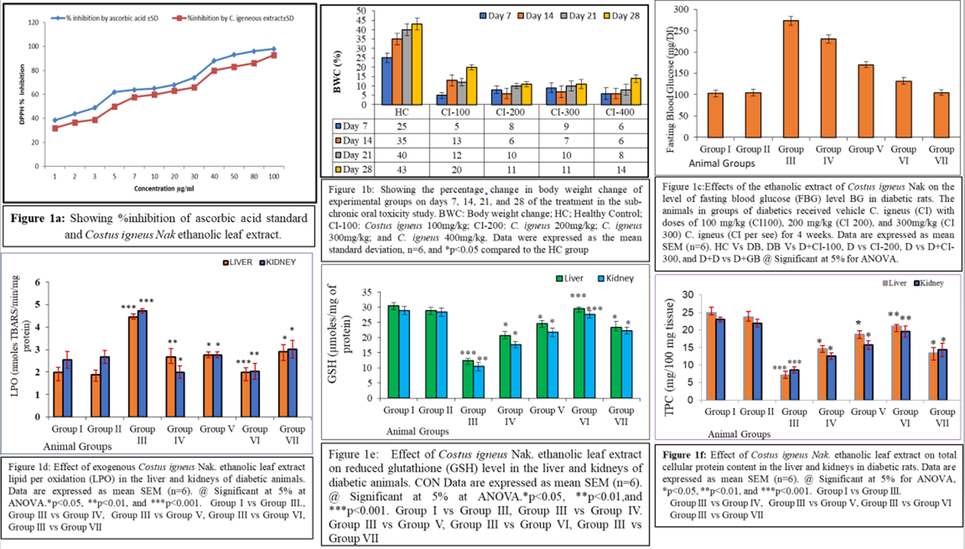
a-f shows the various parameters viz DPPH assay (a), % change in body weight (b), fasting blood glucose level (c), lipid peroxidation (d), reduced glutathione (e) and total cellular protein content (f).
3.3 Acute oral toxicity study
In the acute oral toxicity study, one in five animals treated with the highest concentration of the C. igneus Nak leaf extract (400 mg/kg) had mild diarrhea for the initial 24 h. However, lower doses do not show any toxic or lethal reactions.
3.4 Sub-chronic oral toxicity study (blood glucose level)
Changes in body weight in all experimental groups on days 7, 14, 21, and 25 of the treatment as compared to day 0 of the experiment are shown in Fig. 1b. All tested concentrations of the C. igneus Nak leaf extract significantly decreased the gain in body weight as compared to the untreated animals (Fig. 1b). C. igneus Nak leaf extract did not have any adverse effect on glucose level for 4 weeks of the experiment (Table 3). Nevertheless, reduction in blood glucose was insignificant reduction in all the treated animals as compared to the untreated ones as shown in Table 4 from week 1–4 (Table2; Fig. 1c). Abbreviations: HC; Healthy Control; CI-100: Costus igneus 100 mg/kg; CI-200: Costus igneus 200 mg/kg; Costus igneus 300 mg/kg; and Costus igneus 400 mg/kg. LDL=low density lipoprotein; VDL=Very low-density lipoprotein; and HDL=High density lipoprotein. Data were expressed as the mean ± standard deviation, n=6. *p < 0.05 than that of the HC group.
Treatment groups
Lipid profile (mg/dl)
Total cholesterol
LDL
VDL
Triglycerides
HDL
HC
123.4 ± 5.96
61 ± 6
131 ± 8
77.5 ± 5.1
130 ± 6
CI-100
122 ± 5.43
62 ± 7
130 ± 14
76.5 ± 5.10
131 ± 10
CI-200
122 ± 4.82
66 ± 9
130 ± 12
75.5 ± 3.21
131 ± 12
CI-300
123 ± 3.67
67 ± 4
129 ± 16
75.4 ± 6
130 ± 11
CI-400
130 ± 3.86
73 ± 8*
118 ± 7*
62 ± 4*
114 ± 9*
3.5 The effect of the Costus igneous Nak leaf extract on lipid profile in healthy animals
Results of the lipid profile assessment showed that the administration of C. igneus Nak leaf extract significantly decreased TG and VLDL levels in a dose-dependent manner as compared to the healthy animals (Table 4). Furthermore, although all selected doses of the C. igneus Nak leaf extract showed the potency of increase in the levels of HDL, 300 mg/kg dose statistically decreased HDL in treated animals as compared to the HC (p < 0.01) (Table 3). Data were expressed as the mean standard deviation, n = 6. @ Significant at 5% for ANOVA. *p ≤ 0.05, **p ≤ 0.01, and ***p ≤ 0.001. Group I vs Group III. Group III vs Group IV. Group III vs Group V. Group III vs Group VI. Group III vs Group VII.
Groups
Weekly changes in blood glucose level (mg/dl)
Before Induction
Week-I
Week-II
Week-III
Week-IV
I
127 ± 11
124 ± 7
119 ± 3
120 ± 5
129 ± 7
II
129 ± 13
126 ± 15
125 ± 12
128 ± 9
127 ± 2
III
129 ± 9
390 ± 11**
387 ± 11**
388 ± 15***
391 ± 21***
IV
129 ± 8
381 ± 16**
371 ± 13*
352 ± 25**
345 ± 13**
V
130 ± 11
380 ± 12**
362 ± 7*
324 ± 18*
304 ± 9**
VI
128 ± 9
302 ± 11***
256 ± 22**
230 ± 24***
185 ± 13***
VII
123 ± 57
387 ± 14**
333 ± 16**
305 ± 16*
255 ± 13**
3.6 Assessment of liver and kidney injury
Diabetic animals showed a significant increase in blood glucose and fasting (Table 4 and Fig. 1c) levels. Various liver-specific enzymes, including ALT, AST, ALP, and bilirubin were significantly increased in the untreated diabetic rats. In contrast, total serum proteins (albumin and globulins) content was significantly decreased in diabetic rats (Table 5). Abbreviations: ALT = Alanine aminotransferase, AST = Aspartate aminotransferase; and ALP = Alkaline phosphate, STP = Serum total protein, GLOB-Globulin, ALB = Albumin, Bilu = Bilirubin. Data were expressed as the mean standard deviation, n = 6. @ Significant at 5% for ANOVA. *p ≤ 0.05, **p ≤ 0.01, and ***p ≤ 0.001. Group I vs Group III. Group III vs Group IV. Group III vs Group V. Group III vs Group VI. Group III vs Group VII.
Liver function tests and associated indices
Experimental groups
I
II
III
IV
V
VI
VII
ALT (IU/L)
17 ± 1.56
17.3 ± 1.34
37 ± 2.87**
22.3 ± 4.7*
20.09 ± 1.21*
18.01 ± 2.1**
19 ± 1.45*
AST (IU/L)
20.4 ± 2.46
20.6 ± 1.02
40.17 ± 1.9***
25.0.33 ± 1.6*
22.36 ± 1.6**
21.09 ± 1.9***
23.2 ± 1.34**
ALP (IU/L)
60 ± 2.2
60 ± 1.8
107 ± 3.9**
75.5 ± 3.2*
70.2 ± 2.2**
62.3.4 ± 2.1**
64 ± 3.2*
STP (g/dl)
7.90 ± 0.7
7.91 ± 0.8
3.95 ± 0.6**
6.80 ± 0.3*
7.92 ± 0.5*
7.60 ± 0.7**
6.4 ± 2.2*
ALB (g/dl)
4.50 ± 0.1
4.51 ± 0.8
2.55 ± 0.4**
3.30 ± 0.2*
4.52 ± 0.3*
4.50 ± 0.9***
4.2 ± 2.4*
GLOB (g/dl)
3.40 ± 0.3
3.40 ± 0.2
1.40 ± 0.4**
2.40 ± 0.2*
3.40 ± 0.03*
3.10 ± 0.3**
2.2 ± 1.4*
BILU (mg/dl)
0.25 ± 0.02
0.325 ± 0.05
0.717 ± 0.05**
0.445 ± 0.09*
0.354 ± 0.03*
0.27 ± 0.6**
0.34 ± 0.03*
Similarly, this abnormal glucose metabolism caused various detrimental impacts on biochemical machinery of kidneys. In diabetic animals, there was a significant increase in kidney-specific marker enzymes: creatinine, urea, and uric acid and serum electrolytes (Na+ and K+ ions) in diabetic animals (Table 6). Abnormal changes in all parameters evidenced kidney injury during diabetic condition. Data were expressed as the mean standard deviation, n = 6. Na = Sodium and K = Potassium. @ Significant at 5% for ANOVA. *p ≤ 0.05, **p ≤ 0.01, and ***p ≤ 0.001. Group I vs Group III. Group III vs Group IV. Group III vs Group V. Group III vs Group VI. Group III vs Group VII.
Kidney function tests and associated indices
Experimental groups
I
II
III
IV
V
VI
VII
Creatinine (IU/L)
0.57 ± 0.2
0.57 ± 0.1
1.89 ± 0.1***
0.70 ± 0.1*
0.68 ± 0.1**
0.60 ± 0.1***
0.62 ± 0.3*
Urea (IU/L)
21 ± 2.3
21.09 ± 1.9
42.43 ± 3.0***
27.34 ± 1.4*
34.67 ± 2.4**
41.23 ± 2.5***
24 ± 4.1*
Uric acid (IU/L)
2.93 ± 0.6
2.89 ± 0.4
7.65 ± 0.8***
3.56 ± 0.6*
3.21 ± 0.8**
2.98 ± 0.7***
3.5 ± 0.9*
Na+ (mmol/L)
115.34 ± 2.8
115.27 ± 3.2
142.18 ± 1.9***
130.23 ± 3.9*
124.2 ± 1.9*
116.21 ± 2.5**
124 ± 3.1*
K+ (mmol/L)
2.64 ± 0.5
2.55 ± 0.8
5.5 ± 0.5***
3.78 ± 0.8*
3.11 ± 0.4*
2.80 ± 0.5**
4.3 ± 0.6*
3.7 Serological assessment of liver and kidney biomarkers and their associated indices
Increased glucose levels in diabetics resulted in liver damage, which increased in hepatic biomarkers such as ALT, AST, ALP, and bilirubin, protein content (albumin and globulin) as compared to the normal control group (Table 5). Treatment with three different doses of plant extract (100, 200, and 300 mg/kg) resulted in a decrease in all biomarkers, however, considerably higher recovery and restoration was found in the diabetic animals treated with 300 mg/kg C. igneus Nak leaf extract for 4 weeks. Therapeutic efficacy of 300 mg/kg was nearly equal to that of the antidiabetic drug glibenclamide. Extract (per see) treated normal rats did not exhibit any change in these serum biochemical variables.
In diabetic animals, the level of various biomarkers of kidney function were found significantly elevated in serum, such as creatinine, urea, and uric acid, and serum electrolytes (Na+ and K+) (Tables 6). In contrast, the administration of three different doses of plant extract (100, 200, and 300 mg/kg) to diabetic rats resulted in revival and restoration in all the serum biomarkers. Nonetheless, 300 mg/kg dose showed significantly more recovery in all the biochemical variables that were found nearly equivalent to the antidiabetic drug glibenclamide.
3.8 Oxidative stress biomarkers and tissue biochemistry of the liver and kidneys
Treatment of diabetic rats with three doses (100, 200, and 300 mg/kg) of plant extract for 4 weeks caused a decrease in the production of free radicals in liver and kidney. However, animals treated with 300 mg/kg for 4 weeks revealed significant restoration in TBARS level (LPO rate) (Fig. 1d). In diabetic animals renal and hepatic GSH content (Fig. 1e) was found to be significantly decreased. The administration of plant extract at three doses (100, 200, and 300 mg/kg) for 4 weeks increased the GSH content. However, animals treated with 300 mg/kg for 4 weeks showed significantly greater increase in GSH (Fig. 1e). In diabetic rats, total protein and glycogen content in liver and kidney were found to be decreased significantly. However, the administration of three different doses (100, 200, and 300 mg/kg) of C. igneus Nak leaf extract resulted in an increase in total protein (Fig. 1f) and glycogen (Fig. 2a) levels in the liver and kidney tissues with significantly greater increase seen in diabetic rats treated with the 300 mg/kg dose for 4 weeks.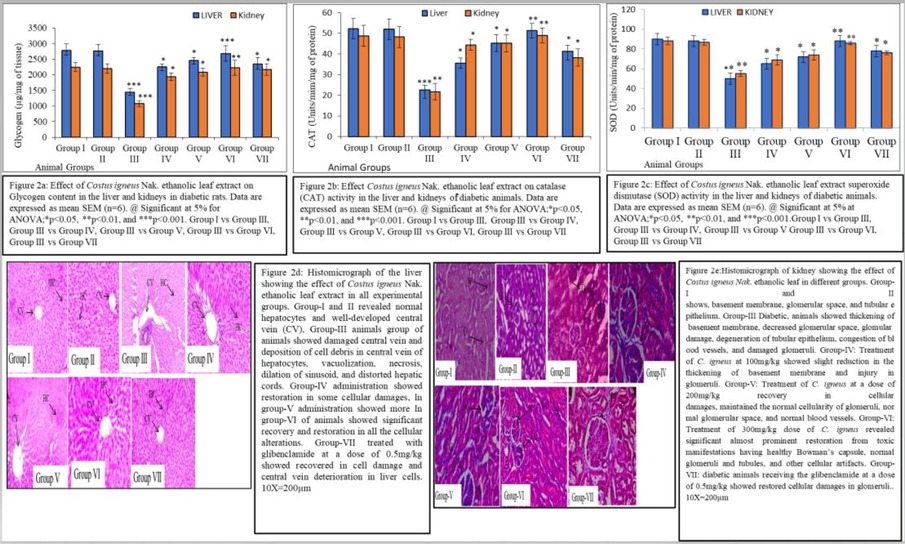
a-e: Shows the various parameters viz glycogen content (a), catalase activity (b), superoxide dismutase (SOD) activity (c), histophotomicrograph of liver (d) and histophotomicrograph of kidney (e).
3.9 Antioxidant status
Renal and hepatic CAT and SOD activities were found significantly decreased in diabetic animals compared to normal control. Administration of three doses (100, 200, and 300 mg/kg) of C. igneus Nak leaf extract significantly increased the activity of CAT and SOD in liver and kidney. However, the diabetic animals in which 300 mg/kg dose was administered for 4 weeks had the highest CAT and SOD activities in liver and kidney (Fig. 2b and c).
Renal and hepatic tissues of untreated diabetic rats exhibited significantly decreased activities of GPX, GR, G6PDH and GST compared to normal control (Table 7). Treatment with three different doses (100, 200, and 300 mg/kg) of C. igneus Nak leaf extract for 4 weeks resulted in remarkable restoration in these glutathione-dependent antioxidative enzyme activities. Results also demonstrated that treatment of normal rats with the highest dose of plant extract 300 mg/kg did not cause any changes in these enzyme activities that was found equivalent to antidiabetic drug glibenclamide. Abbreviations: GR = Glutathione Reductase; GPX = Glutathione Peroxidase; G6PDH = Glucose-6-Phosphate Dehydrogenase; and GST = Glutathione-S-Transferase. Data were expressed as the mean standard deviation, n = 6. @ Significant at 5% for ANOVA. *p ≤ 0.05, **p ≤ 0.01, and ***p ≤ 0.001. Group I vs Group III. Group III vs Group IV. Group III vs Group V. Group III vs Group VI. Group III vs Group VII.
Experimental groups
Parameters
GSH Cycle enzymes
I
II
III
IV
V
VI
VII
Hepatic GSH Cycle
GR
(Unit/min/mg protein)
52.07 ± 2.56
50.067 ± 3.42
29.75 ± 2.78***
43.56 ± 4.29*
47.09 ± 3.98*
51.12 ± 4.4**
50.02 ± 2.4*
GPx
(Unit/min/mg protein)
602.14 ± 32.4
605.92 ± 22.6
357.19 ± 32.2***
501.67 ± 15.8*
562.89 ± 23.8*
598.98 ± 26.8***
604.13 ± 3.2*
G6PDH
(Unit/min/mg protein)
42.52 ± 4.7
41.89 ± 4.3
17.57 ± 2.5***
33.89 ± 3.4*
37.87 ± 4.1*
40.8 ± 5.3***
43.43 ± 1.3*
GST
(Unit/min/mg protein)
606.14 ± 32.4
608.92 ± 22.6
362.19 ± 32.2***
535.67 ± 15.2*
554.87 ± 14.2*
603.87 ± 12.2***
608.12 ± 29.23*
Kidney GSH Cycle
GR
(Unit/min/mg protein)
47.9 ± 1.15
47.8 ± 1.98
25.16 ± 01.92**
34.65 ± 2.01*
40.67 ± 1.78*
46.78 ± 1.9**
46.23 ± 2.01*
GPx
(Unit/min/mg protein)
9.22 ± 0.54
7.19 ± 0.75
3.2 ± 0.30***
5.19 ± 0.38*
7.78 ± 0.42*
8.98 ± 0.7***
7.2 ± 0.45*
G6PDH
(Unit/min/mg protein)
43.09 ± 3.87
43.87 ± 0.69
16.23 ± 0.87**
29.09 ± 2.4*
35.63 ± 0.42*
42.87 ± 0.8**
41.1 ± 1.87*
GST
(Unit/min/mg protein)
590.62 ± 56.84
544.79 ± 28.84
310 ± 56.98**
523.91 ± 23.69*
562.76 ± 24.76*
587.98 ± 26.42**
586.53 ± 58.78*
3.10 Histopathological examination
Histopathological examination of the normal control group revealed normal histoarchitecture of the liver such as a well-developed nucleus and normal arrangement of hepatic cords, and preserved sinusoidal spaces. However, liver from diabetic animals showed deterioration in hepatic cells, irregular and damaged hepatocytes, presence of hepatic lesions necrosis, vacuolation, indistinct hepatic cords, inflammatory cell permeation, and obliterated sinusoids. Administration of C. igneus Nak leaf extract at three different doses (100, 200, and 300 mg/kg) given to diabetic rats resulted in significant restoration in all the artifacts. In particular livers from the 300 mg/kg administered group of rats exhibited revival of central vein impediments, regular arrangement of lobules having polygonal hepatocytes with conspicuous nucleus, and broader sinusoidal spaces (10X and 40X) (Fig. 2d).
Histopathological examination of kidneys of the control group showed normal cellular glomeruli, regular and uniform glomerular space, preserved lining of endothelial cells, normal Bowman’s Capsule, and proper tubular alignment having a lumen. However, diabetic animals showed deteriorations in histoarchitecture such as tubular structure, swelled glomeruli without glomerular spaces and distortion of endothelial lining. Administration of C. igneus Nak leaf extract at three different doses (100, 200, and 300 mg/kg) to diabetic rats resulted complete repair in kidney histoarchitecture, with the most remarkable recovery was found in diabetic rats in which 300 mg/kg dose was administered such as normal glomeruli, regular and uniform glomerular space, preserved endothelial lining, well developed Bowman’s Capsule and proper tubular alignment having a broad lumen. Administration of glibenclamide standard hypoglycemic drug restored normal histoarchitecture of the kidney cortex (10X and 40X) (Fig. 2e).
3.11 Serum inflammatory cytokines
The effect of C. igneus Nak leaf extract was also evaluated against the diabetes-induced increase in pro- and anti-inflammatory cytokines in blood serum. The cytokines assessed in serum included TNF-α, TGF-β1, IL-1β, IL-6, and IL-10. Diabetic rats exhibited a significant increase in TNF-α, TGF- β1, IL-1β, and IL-6 levels in the serum in comparison to the normal control animals; however, IL-10 level was found to be significantly decreased. The administration of C. igneus Nak leaf extract at three different doses (100, 200, and 300 mg/kg) to three different groups for 4 weeks resulted in a decrease in pro-inflammatory cytokines (TNF-α, TGF-β1, IL-1β, and IL-6) level, whereas there was an increase in IL-10 (anti-inflammatory) cytokine level. However, the most significant restoration in pro-inflammatory (TNF-α, TGF-β1, IL-1β, and IL-6) and anti-inflammatory (IL-10) cytokine levels was found in 300 mg/kg-treated group of diabetic rats (Table 8). Abbreviations: TNF-α = Tumor necrosis factor-Alpha and IL-10 = Interleukin-10; IL-6 = Interleukin-6; IL-1β = Interleukin-1Beta; TGF-β1 = Tumor growth factor-beta1. Data were expressed as the mean standard deviation, n = 6; and @ Significant at 5% for ANOVA. *p ≤ 0.05, **p ≤ 0.01, and ***p ≤ 0.001. Group I vs Group III. Group III vs Group IV. Group III vs Group V. Group III vs Group VI. Group III vs Group VII.
Inflammatory cytokines
(pg mL−1)Experimental groups
I
II
III
IV
V
VI
VII
TNF-α
66.21 ± 3.2
65.6 ± 4.2
102.55 ± 3.7***
93.43 ± 2.2*
85.4 ± 1.2**
67.4 ± 3.2***
68.32 ± 5.1*
IL-6
22.8 ± 1.4
21.23 ± 1.3
41.54 ± 0.98**
34.65 ± 1.6*
29.6 ± 1.2*
23.01 ± 2.01***
25.05 ± 3.2*
IL-1β
99.8 ± 2.1
97.89 ± 2.3
123.31 ± 4.1***
109.21 ± 1.9*
104 ± 2.2*
100 ± 2.5**
106.4 ± 4.2*
TGF-β1
106.21 ± 2.9
103.34 ± 3.3
156.34 ± 2.9***
142.56 ± 2.5*
124.45 ± 3.4*
108.21 ± 3.4***
110.34 ± 44.2*
IL-10
78.44 ± 0.89
77.89 ± 2.4
51.22 ± 0.65***
62.23 ± 1.02*
68.21 ± 1.7**
76.45 ± 2.3***
84.32 ± 24.3*
4 Discussion
In the present study leaf extract was evaluated for its phytochemicals, antioxidant activity, probable therapeutic potency in vivo toxic impacts, mainly its protective outcome on hyperglycemia, hyperlipidemic, anti-inflammatory, tissue, serum biochemistry, and histological alterations of the liver and kidneys on the type 1 diabetic animal model. Phytochemical screening demonstrated the presence of polyphenols, flavonoids, flavones, and flavonols in the C. igneus Nak leaf extract. Moreover, quantitative assessment revealed the higher quantity of polyphenols, flavonoids, flavones, and flavonols and the leaf extract also showed elevated free radical scavenging activity (DPPH assay). The detection of these bioactive components in leaf extract reveals its therapeutic efficacy of leaf extract.
Acute toxicity studies revealed that the C. igneus Nak leaf extract does not show any toxic effect at concentrations upto 300 mg/kg. Therefore, the extract was also assessed for sub-chronic oral toxicity; we examined the effects of 100, 200, and 300 mg/kg to observe changes in body weight of healthy animals, blood glucose level, lipid profile, and histopathology of the liver and kidneys.
Findings of the sub-chronic studies revealed that the C. igneus Nak leaf extract at low doses does not show any toxic effect; however, it exerts positive effects that include maintenance of body weight, inhibition of hyperglycemia and hyperlipidemia and renovation of the hepatic system. Since, many medicinal plants exhibit “Janus nature” that means higher concentrations (400 mg/kg) might function like a toxic agent. Thus, the present work has been limited to three doses (100, 200, and 300 mg/kg) of C. igneus Nak leaf extract.
Findings of sub-chronic oral toxicity studies demonstrated that the leaf extract of C. igneus Nak at all examined concentrations restricts body weight increase in comparison to the normal healthy animals. It might be inferred that the treatment of leaf extract decreases the blood sugar level due to its regenerating effect on pancreatic β-cells that might have increased the number of pancreatic β-cells. Thus, the leaf extract might have decreased the absorption of carbohydrates in the small intestine, increased uptake of glucose in the tissues, inhibited the formation of glucose in the liver, enhanced release of insulin from pancreatic beta cells, and/or protected the beta cells from degeneration (Hosseini et al., 2015).
Results of the current study revealed that in diabetic rats, body weight decreases significantly due to the irregular and excess loss of glucose, augmented muscle wasting, and degradation of fats and proteins. Furthermore, results demonstrated significant decreases in cellular and serum protein quantity, which might be correlated with the loss of weight as observed in diabetic animals. Excess glucose results its self-oxidization and leads to different harmful impacts on the hepatocytes and its associated biochemical indices. In contrast, the administration of C. igneus Nak leaf extract at three different doses (100, 200, and 300 mg/kg) to three different groups of diabetic rats showed significant recovery in body weight and total protein quantity in the liver and kidneys in a dose-dependent manner, i.e., significant restoration was found in 300 mg/kg administered group of rats. This in turn prevents the weight loss and augmented glycosylation of proteins. This increase in cellular protein content might be due to the inhibitory action of C. igneus Nak leaf extract on the lipolysis of adipocytes. C. igneus Nak leaf extract contains polyphenols that decrease the oxidative stress induced because of abnormal protein glycosylation (Hosseini et al., 2015).
Diabetic animals showed momentous increase in the LPO level in the liver and kidneys, with simultaneous decrease in GSH content. The administration of C. igneus Nak leaf extract alleviated the oxidative stress found in diabetes through the conversion of oxidized glutathione (GSSG) into GSH and the increase of antioxidant enzymatic activities in a dose-dependent manner.
Transformation of glucose into glycogen in the liver depends on the quantity of glucose in the extracellular matrix and also on the availability of insulin. Diabetic rats showed reduction in hepatic glycogen content. The administration of three different doses (100, 200 and 300 mg/kg) of C. igneus Nak leaf extract to three different groups of diabetic animals revealed a marked increase in glycogen content in a dose-dependent manner; however, the most significant restoration was found in 300 mg/kg administered group of animals near to the control range. This glycogen increase may be due to the reactivation of the glycogen synthase enzymatic system.
Total serum protein and albumin content were found significantly decreased in diabetic rats. However, the administration of C. igneus Nak leaf extract at three different doses (100, 200, and 300 mg/kg) to three different groups of diabetic animals resulted in significant increase in total serum protein and albumin content in a dose-dependent manner, i.e., the most significant restoration was found in the 300 mg/kg administered group of animals which approached to the control range. This decrease in serum protein content in diabetic rats might be due to microproteinuria, a clinical marker of diabetic nephropathy, and elevated catabolism of proteins (Dronavalli et al., 2008). Diabetic animals also exhibited a considerable increase in the serum bilirubin level. Again, the administration of C. igneus Nak. leaf extract at three different doses (100, 200, and 300 mg/kg) to three different groups of diabetic animals precipitated a significant reduction in total serum bilirubin level in a dose-dependent manner, i.e., the most significant restoration was found in 300 mg/kg administered group of animals to a level near to the control range. This abnormal increase in total bilirubin content could be due to the failure of normal uptake, conjugation, and excretion by injured parenchymatic cells of the liver.
Diabetic animals exhibited a with marked increase in serum levels ALT, AST, and ALP; treatment with C. igneus Nak leaf extract reduced serum levels as a result of these enzymes in a dose-dependent manner. This protective effect can be its hypolipidemic and antioxidative properties of C. igneus Nak leaf extract decreased hepatic LPO which is a fundamental mechanism associated with oxidative stress-induced cellular injury. The administration of C. igneus Nak leaf extract inhibits the LPO rate in the liver in a dose-dependent manner and it also ameliorates the histological damage to the liver. In diabetic rats, serum levels of creatinine, urea, and uric acid were increased, the administration of C. igneus Nak leaf extract resulted in decrease in creatinine, urea, and uric acid in a dose-dependent manner, with significantly higher recovery observed in the 300/kg administered group of rats.
Histopathological study of liver tissues showed that there was toxic effect of the tested doses (100, 200, and 300 mg/kg) in all experimental groups. The normal control animals revealed normal histology of hepatocytes having a well-marked nucleus, regular alignment of hepatic cords, and normal sinusoidal spaces. Diabetic rats showed deterioration and damage in hepatocytes characterized by hepatic lesions necrosis, vacuolation, indefinite hepatic cords, inflammatory cell penetration, and obliterated sinusoids. Furthermore, reduction in the N:C ratio in hepatic cells suggested a decrease in DNA repair causing necrosis of these cells (Gujral et al., 2001). In contrast, the administration of three doses (100, 200, and 300 mg/kg) of C. igneous leaf extract to three different groups of diabetic rats resulted in recovery from these histopathological alterations of the liver more closely resembles to healthy one. In addition, greater recovery was observed in the 300 mg/kg administered group of animals (rejuvenation in central vein obstruction, regular alignment of lobules with polygonal hepatocytes having conspicuous nucleus, and broader sinusoidal spaces). This recovery and reversal in histoarchitecture in the treated group of diabetic animals might be due to the action of polyphenols and flavonoids. Previous studies reported that polyphenols regulate oxidative stress (OS) through various mechanism such as the reversal of OS-precipitated DNA damage due to nuclear factor erytroid-2-related factor-2-pathways; by decreasing inflammation through the repression of nuclear factor-κB pathways, by elevating oxidation of β-fatty acid, by increasing the regulation of peroxisome proliferators-activated receptor alpha, through the inhibition of lipogenesis by activating the AMP-activated protein kinase, and by down-regulating sterol regulatory element-binding proteins. In addition to this, polyphenols prevent the occurrence of hepatic fibrosis by repression of the activation of stellate cells in the liver, because these cells help in the accumulation of extracellular matrix (ECM) (Hicks et al., 2017). In addition, only plant extract (per see) doses have not shown any adverse histological artifacts (Fig. 2e).
The normal control group of rats revealed normal histoarchitecture of kidney tissues and did not show any toxic effect of the tested doses (100, 200, and 300 mg/kg) in all experimental groups. In contrast, diabetic rats showed some indicators of nephropathy in the kidney such as the degeneration of glomeruli, distinct tubular artifacts, permeation of interstitial mononuclear cells, fibrosis, thecongestion of blood vessels in tubular vessels in the renal cortex, deformation in bowman’s capsule, reduced PTCs, and an elevated proportion of the collagenous mass in the diabetic control in comparison to the HC group. The administration of three different doses (100, 200, and 300 mg/kg) of C. igneus Nak leaf extract to three different groups of diabetic rats showed a nephroprotective effect by normalizing the size of glomeruli, number of PTCs, restoration in tubular epithelium, thickening of basement membrane, and normal interstitial mesangial matrix. However, significantly the prominent restoration in all these toxic manifestations was observed in the 300 mg/kg administered group of diabetic animals. This protective effect of C. igneus Nak leaf extract might be due to its antioxidant activity, because this greater antioxidant activity is responsible for the anti-genotoxic property, which prevents the damage to chromosomes that occurs due to the ROS and retains the usual speed of the mitotic cycle in PTCs. This beneficial adaptive feature provides cells enough time to repair their damaged DNA, but if the cell remains under the arrest phase for a prolonged time may that lead to the formation of profibrotic cytokines-TGF-β and connective tissue growth factor in c-Jun N-terminal kinases-dependent pathways. In addition, the initial confined fibrosis process permits the protection of damaged nephrons to stay alive within the organizational framework (Kaissling et al., 2013). However, surplus formation of the ECM for longer times may reach the non-reversal point and development of chronic diseases (Kaissling et al., 2013).
Diabetic animals showed a significant increase in proinflammatory cytokines TNF-α, IL-6, and IL-1β, but the level of anti-inflammatory (TGF-β1 and IL-10) cytokines was found to be decreased in circulatory serum. However, the administration of C. igneus Nak leaf extract to diabetic animals caused a significant decrease in all the proinflammatory cytokines (TNF-α, TGF-β1, IL-1β, and IL-6) and simultaneously an increase in anti-inflammatory cytokines (IL-10) in a dose-dependent manner. In addition to this, the increase in TNF-α, TGF-β1, IL-1β, IL-6 cytokine, and decrease in IL-10 in diabetic rats corresponds to altered innate immunity and chronic inflammation; hence, this confirms their strong association with insulin resistance as reported earlier.
Summarizing, the results of the current study allow the conclusion that 300 mg/kg might be an effective therapeutic combination to prevent diabetes-induced functional hepatorenal alterations, as established by changes of hepatorenal histoarchitecture, biochemistry (LPO, GSH, SOD, CAT, GPX, GR, G6PDH, GST, glycogen, and total cellular protein content), of serum biochemical indicators of hepatic (ALT, AST, ALP, bilirubin, albumin and globulin) and renal function (creatinine, urea, and uric acid), electrolytes (Na+ and K+) and serum concentration of pro and anti-inflammatory cytokines (TNF, TGF-β1, IL-1β, IL-6, and IL-10) regulating the innate immune system. The favorably safe nature and nephroprotective property of 300 mg/kg dose of CI leaf extract suggest it to be a pharmacological adjunct to upsurge the therapeutic window of important nephrotoxic drugs in clinical trials. Mitigation of diabetes-induced hepatic and renal damages by CI leaf involves a complex series of biochemical improvements at cellular levels. Leaf extract attenuate the hepatorenal toxicity of diabetes through their potent antioxidant and glucose metabolizing actions respectively, as it is believed to reinforce the antioxidant enzymes and direct free radical scavenging at subcellular levels. Apart from its antioxidant actions, leaf extract modulates various inflammatory cytokines that are also associated with its ability to restore histological and cell survival.
5 Conclusion
Administration of C. igneus Nak leaf extract was effective in the amelioration of biochemical parameters such as the antioxidant system, hyperglycemia, hyperlipidemia, and histopathological alterations of the liver and kidneys in a diabetic model. Furthermore, secondary metabolites present in the C. igneus Nak leaf extract might increase the total antioxidant activities exerting defensive effects against the free radical pathogenesis in diabetic liver and kidneys. C. igneus Nak leaf is very rich in various polyphenols, anthraquinones, flavonoids, alkaloids, terpenoids, and saponins. Therefore, use of plant extracts and natural poly-phenols having anti-diabetic, anti-inflammatory, anti-apoptotic and anti-cancerous activities can be valuable to control diabetes mellitus. Polyphenols can decrease other metabolic diseases such as insulin resistance, hyperglycemia, hyperlipidemia, obesity and diabetes mellitus and associated complications. These results suggested that this CI extract may be an important therapy for possible future usage in the food and/or pharmaceutical industry. Hence, plant derived natural bioactive components are very good alternatives to minimize the prevalence of diabetes induced hepatorenal dysfunctions and other associated comorbidities. Nonetheless, further studies are required to isolate particular bioactive compound and evaluation of its hepatorenal protective mechanisms at the cellular and molecular level.
Authors contributions
YAH RK, MSR was involved in the conception and design of the study. YAH was involved in the biochemical and molecular evaluation and the preparation of histology slides. YAH RK and DSR were involved in data analysis and interpretation, dosing, and drafting. YAH, AFA, NA, YSMA and MI Edited and reviewed the manuscript. All authors read and approved the final manuscript.
Acknowledgments
Authors are thankful to the Researchers Supporting Project number (RSP-2021/335), King Saud University, Riyadh, Saudi Arabia for the support.
Declaration of Competing Interest
The authors declare that they have no known competing financial interests or personal relationships that could have appeared to influence the work reported in this paper.
References
- A review on the extraction methods use in medicinal plants, principle, strength and limitation. Med. Aromat. Plants. 2015;4(196):2167-10412.
- [Google Scholar]
- A spectrophotometric method for measuring the breakdown of hydrogen peroxide by catalase. J. Biol. Chem.. 1952;195:133-140.
- [Google Scholar]
- Association of serum uric acid with proteinuria in type 2 diabetic patients. J. Res. Med. Sci.. 2013;18(1):44-46.
- [Google Scholar]
- Antioxidant determination by the use of a stable free radical nature. Nature. 1958;181(4617):1199-1200.
- [Google Scholar]
- Optimization of an extraction procedure and chemical characterization of Croatian propolis tinctures. Phytochem. Anal.: Inter. J. Plant Chem. Biochem. Technol.. 2007;18(5):451-459.
- [Google Scholar]
- IDF Diabetes Atlas ninth ed. 2019 [WWW Document], n.d. URL https://www.diabetesa tlas.org/en/ (accessed 4.30.20).
- The pathogenesis of diabetic nephropathy. Nat. Rev. Endocrinol. Metab.. 2008;4(8):444-452.
- [Google Scholar]
- A colorimetric method for assay of erythrocytic glucose-6-phosphate dehydrogenase. Best. Proc. Soc. Exp. Biol. Med.. 1961;106(3):607-609.
- [Google Scholar]
- Medicinal plants in therapy. Bull. World Health Organ.. 1985;63:965-981.
- [CrossRef] [Google Scholar]
- Current trends in the analysis and quality control of food supplements based on plant extracts. Anal. Chim. Acta (1036):1-15.
- [CrossRef] [Google Scholar]
- Goldberg D.M., 1984. Glutathione reductase. Methods Enzyme Anal. 3; 258-265.
- Mechanism of cell death during warm hepatic ischemia-reperfusion in rats: apoptosis or necrosis. Hepatology. 2001;33(2):397-405.
- [Google Scholar]
- Glutathione S-transferases the first enzymatic step in mercapturic acid formation. J. Biol. Chem.. 1974;249(22):7130-7139.
- [Google Scholar]
- Melatonin and insulin modulates the cellular biochemistry, histoarchitecture and receptor expression during hepatic injury in diabetic rats. Life Sci.. 2019;239:117046
- [Google Scholar]
- The Chinese herbal formulae (Yitangkang) exert an antidiabetic effect through the regulation of substance metabolism and energy metabolism in type 2 diabetic rats. J. Ethnopharmacol.. 2019;239:111942
- [CrossRef] [Google Scholar]
- Phytochemical methods. London, UK: Chappnan and Hall Ltd.; 1973. p. :49-188.
- Transcriptome-based repurposing of apigenin as a potential anti-fibrotic agent targeting hepatic stellate cells. Sci. Rep.. 2017;7
- [CrossRef] [Google Scholar]
- Pancreatic beta cell protection/regeneration with phytotherapy. Braz. J. Pharm. Sci.. 2015;51(1):1-16.
- [Google Scholar]
- Atlas (7th ed.). Brussels, Belgium: International Diabetes Federation; 2015.
- Renal epithelial injury and fibrosis. Biochim. Biophys. Acta (BBA) Mol. Basis Dis.. 2013;1832(7):931-939.
- [Google Scholar]
- A modified spectrophotometric assay of superoxide dismutase. Indian J. Biochem. Biophys.. 1983;21:192-205.
- [Google Scholar]
- Li, S., Tan, H.-Y., Wang, N., Zhang, Z.-J., Lao, L., Wong, C.-W., Feng, Y., 2015. The role of oxidative stress and antioxidants in liver diseases. Int. J. Mol. Sci. 16(11); 26087-26124. https://doi.org/10.3390/ijms161125942.
- Protein measurement with the Folin phenol reagent. J. Biol. Chem.. 1951;193:265-275.
- [Google Scholar]
- The global burden of kidney disease and the sustainable development goals. Bull. World Health Organ.. 2018;96(6):414-422D.
- [CrossRef] [Google Scholar]
- Polyherbal formulation containing antioxidants may serve as a prophylactic measure to diabetic cataract: preclinical investigations in rat model. Phcog. Mag.. 2018;14(58):572.
- [Google Scholar]
- Antibacterial, antioxidant and antiglycation potential of Costus pictus from southern region, India. Asian J. Plant Sci. Res.. 2012;2(95):101.
- [Google Scholar]
- Nutraceutical potential of Corylus avellana daily supplements for obesity and related dysmetabolism. J. Funct. Foods. 2018;47:562-574.
- [Google Scholar]
- Identification of risk factors of diabetes mellitus in bank employees of selected banks in Ndola town. Diab. Metab. Syndr. Clin. Res. Rev.. 2019;13(2):1497-1504.
- [Google Scholar]
- Phytochemical studies and comparative efficacy of the crude extracts of some homeostatic plants in Edo and Delta States of Nigeria. Glob. J. Pure Appl. Sci.. 2001;8(2):203208
- [Google Scholar]
- OECD, 2002. Test No. 420: Acute Oral Toxicity - Fixed Dose Procedure, OECD Guidelines for the Testing of Chemicals, Section 4. OECD Publishing, Paris. https://doi.org/10.1787/9789264070943-en.
- OECD, 2018. Repeated dose 28-day oral toxicity study in rodents (OECD TG 407). In: Revised Guidance Document 150 on Standardised Test Guidelines for Evaluating Chemicals for Endocrine Disruption. OECD Publishing, Paris. https://doi.org/10.1787/9789264304741-22-en.
- Assay for lipid peroxides in animal tissues by thiobarbituric acid reaction. Anal. Biochem.. 1979;95(2):351-380.
- [Google Scholar]
- Studies on the quantitative and qualitative characterization of erythrocyte glutathione peroxidase. J. Lab. Clin. Med.. 1967;70(1):158-169.
- [Google Scholar]
- Insulin-associated weight gain in diabetes – causes, effects and coping strategies. Diabetes Obes. Metab.. 2007;9(6):799-812.
- [Google Scholar]
- Estimation of total, protein-bound, and nonprotein sulfhydryl groups in tissue with Ellman's reagent. Anal. Biochem.. 1968;25:192-205.
- [Google Scholar]
- The estimation of glycogen with the anthrone reagent. Arch. Biochem.. 1950;25:191-200.
- [Google Scholar]
- The antioxidant activity and free radical scavenging capacity of dietary phenolic extracts from horse gram (Macrotyloma uniflorum (Lam.) Verdc.) seeds. Food Chem.. 2007;105(3):950-958.
- [Google Scholar]
- Pharmacognocy (13th edition). London, UK: Balliere Tindall; 1989. p. :176-180.
- The determination of flavonoid contents in mulberry and their scavenging effects on superoxide radicals. Food Chem.. 1999;64(4):555-559.
- [Google Scholar]


