

Translate this page into:
Activity and toxicity modelling of some NCI selected compounds against leukemia P388ADR cell line using genetic algorithm-multiple linear regressions
⁎Corresponding author. davidebukaarthur@gmail.com (David Ebuka Arthur)
-
Received: ,
Accepted: ,
This article was originally published by Elsevier and was migrated to Scientific Scholar after the change of Publisher.
Peer review under responsibility of King Saud University.
Abstract
Abstract
Cancer-causing nature is one of the toxicological endpoints bringing about the most elevated concern. Likewise, the standard bioassays in rodents used to survey the cancer-mitigating capability of chemicals and medications are expensive and require the sacrifice of animals. Thus, we have endeavored the development of a worldwide QSAR model utilizing an information set of 85 compounds, including drugs for their anti-leukemia potential. Considering expansive number of information focuses with different structural elements utilized for model development (ntraining = 68) and model validation (ntest = 17), the model developed in this study has an encouraging statistical quality (leave-one-out Q2 = 0.833, R2pred = 0.716) for pLC50 and (leave-one-out Q2 = 0.744, R2pred = 0.614) for pGI50. Our developed model suggests that the absence of methanal fragments, low dipole moment and presence of some 2D autocorrelated molecular descriptors reduces the carcinogenicity. Branching, size and shape are found to be crucial factors for drug-mitigating carcinogenicity.
Keywords
QSAR
Multiple linear regression
Drugs
Genetic algorithm
Validation
Molecular descriptors

1 Introduction
Drugs and other chemical agents that interact with specific enzymes are usually shown as graphs and paths when establishing a relationship with their bio-activities (Speck-Planche et al., 2012b). Each vertex in the polygonal path represents a unique property referred to as molecular descriptors of a molecule. For the past decade, drug researchers have established that the geometry of drugs plays an important role in influencing their functions when complexed with a targeted receptor (Dunnington and Schmidt, 2015). This information justifies that the molecular descriptors of chemical compounds are correlated to their chemical properties, such as the large number of topological indices that have been reported for isomer discrimination and the study of molecular complexity by Arthur (Arthur et al., 2016a), others such as the rational combinatorial library design for deriving multilinear regression models were also reported (Andrada et al., 2015).
At present, cancer is one of the leading cause of death in the human population around the world, and it is predicted to increase within that trend in the coming years (Alanazi et al., 2014). The use of chemical agents to inhibit cancer cell growth is the cheapest and most promising treatment for this disease. A major advantage of chemotherapy is its use to treat a different type of cancer, where surgery and radiation therapies are limited (Rischin et al., 2000, Kashiwagi et al., 2011). The presence large libraries of discovered compounds with high activities compiled by drug databanks and institutes such as National Cancer Institute gives options of drugs that can be studied but at the same time provides a compelling problem which involves the factor time and capital cost in experimentally screening and validating the effectiveness of the new drug.
QSAR analysis is an effective method for optimizing lead compounds and designing new drugs. It is used in predicting the activity, toxicity, and carcinogenicity of compounds based on the molecular descriptors of compounds established in appropriate mathematical models. The rapid development of computational chemistry software has improved the chances and reduced the time spent in obtaining chemical parameters of compounds for this study. The aim of this research is to obtain two new models, one to predict the activity and the other toxicity of the selected dataset and hopefully able to predict new strategies with improved activities capable of mitigating cancer in drug-resistant P388ADR leukaemia cell line (Gagic et al., 2016; Chen et al., 2015, Speck-Planche et al., 2012a, Zhao et al., 2013).
2 Materials and methods
The computational hardware and software used in this work includes: Computer (HP pavilion Intel(R) Core i5-4200U with 1.63 Hz and 2.3 Hz processor and Windows 8.1 operating system), Spartan 14 (Hehre and Huang, 1995), ChemBio Ultra 12.0 (Li et al., 2004, Evans, 2014), Padel-descriptor (Yap, 2011), MS Excel (Denton, 2001).
In this study, a data set of eighty-five (85) compounds from NCI database were optimized at the density functional theory (DFT) level using Becke's three-parameter Lee–Yang-Parr hybrid functional (B3LYP) in combination with the 6-311G∗ basis set (Benarous et al., 2016, Bauernschmitt and Ahlrichs, 1996). The optimized structures were used to generate molecular descriptors using the paDEL program. We calculated 1875 descriptors (1444 1D, 2D descriptors, and 431 3D descriptors) molecular descriptors using the paDEL program (PaDEL-Descriptor, 2014) for example, atom-type electrotopological state descriptors, McGowan volume, molecular linear free energy relation descriptors, ring counts, 2D-Autocorrelations, Aromaticity Indices, Randic Molecular Profiles, Radial Distribution Functions, Functional Groups, Atom- Centred Fragments, Empirical and Properties. WHIM, Petitjean shape index, count of chemical substructures identified by Laggner, while binary fingerprints and count of chemical substructures identified by Klekota, Roth and Frederick (Klekota and Roth, 2008), Dragon descriptor software (Talete, 2007, Mauri et al., 2006) was also used to calculate some other descriptors such as 3D-MoRSE descriptors, GETAWAY descriptors, WHIM descriptors and Drug-like indices. We likewise incorporate into the analyses 5 other molecular descriptors calculated from the DFT computation (dipole moment, the energy of the HOMO and LUMO molecular orbitals, total energy and HOMO–LUMO gap).
2.1 Scaling of activities and descriptors data
The response variable (biological activities) and the explanatory variable (molecular descriptors) and were scaled using auto-scaling and range scaling procedure. According to Golbraikh et al. (2003), the modeling set and the evaluation set were scaled separately. Usually, variables with larger pre-scaled value have high coefficient and those with smaller pre-scaled values has a low coefficient in the regression equation (Foudah et al., 2014). Hence, the need to transform the variables data to the standard data by subtracting the mean and dividing by its standard deviation. where is the original descriptors, is the arithmetic mean of each descriptors, is the standard deviation, and the scaled descriptors. This process removes the dependence of the regression coefficient on unit. This is good for cases where variables indicate concentrations or amounts of chemical compounds, or were variables represent measurements in unrelated units (Wehrens, 2011, Mevik et al., 2011).
Range scaling techniques or normalization usually give linear transformation that set the maximum and minimum of each scale to be [0, 1] or [−1, 1], etc. Here, the minimum value in a vector (a column representing a given variable “y”) is subtracted from every data point “yn” of N samples and the results are divided by the range. where and are, respectively, the minimum and maximum values that can be found in the data set, with respect to all the data points and the variable to normalize. The minimum and maximum value of the evaluation set was used in this normalization procedure (Tropsha, 2010, Roy et al., 2013). These range-scale descriptors have a minimums and maximum the value of −1 and 1 respectively.
These compounds were then divided into training and test sets by the Kennard-Stone algorithm (Kennard and Stone, 1969). The QSAR models were generated using the Genetic Function Approximation (GFA). The GFA technique is a collection of Genetic Algorithm used to evolve a population of equations that best fit the training set (Deb et al., 2002, Leardi et al., 1992). A unique feature of GFA is that it yields a population of models, instead of generating a single model. The developed models were then subjected to internal and external validation and Y-randomization tests so as to justify their predictability (Tropsha, 2010).
2.2 Splitting of data-set into modelling sets and evaluation test sets
The data set was divided into two sets, the modelling set, and test set. The modelling set is used in developing the model, it contains eighty percent of the entire data set. While the test set which constitutes the remaining twenty percent of the whole data set was not used in the construction of the model but to ascertain the predictive ability of the model (Tropsha, 2010).
2.2.1 Model development
Multiple Linear Regression was used to establish a relationship between the bioactivities (pGI50) and the molecular descriptors. The model was written such that sum-of-squares difference between the experimental and predicted values of the bioactivities were minimized.
2.2.2 Evaluation of the QSAR model
The QSAR models developed was validated by subjecting the models to some statistical tests as: R2; Fishers test; cross-validated test and pred R2.
2.2.3 Validation of the QSAR model
The ability of a QSAR equation to predict the bioactivity of the compounds within the training set was carried out, using the leave-one-out cross-validation method. The cross-validation regression coefficient (Qcv2) is given as: where ypred, yexp, and ỹ are the predicted, experimental, and mean values of experimental activity respectively. It has been reported that high estimation of statistical attributes is not enough to justify the ability of a model, and so to assess the predictive capacity of the new QSAR model, the method depicted by Golbraikh and Tropsha (2002) and Roy et al. (2015) were utilized. The coefficient of determination for the test set Rtest2, was calculated through the accompanying mathematical statement
is the average activity value of the training set compounds (Tropsha et al., 2003). Additional assessment of the predictive power of the QSAR model for the test set compounds was done by calculating the value of (rm2), using the rm2 metric by Roy et al. (2013).
3 Results and discussion
The predicted activities of the training set compounds which was generated by the Material Studio Software, as well as the predicted test set values calculated using MSExcel 2013 (Carlberg, 2014) are presented in Table 1. Where superscript a and b represent test sets for P388ADR leukemia cell line for the activity and toxicity model respectively.
Serial Number (ID)
NAME
NSC
P388ADR (Experimental pGI50)
P388ADR (Predicted pGI50)
P388ADR (Experimental pLC50)
P388ADR (Predicted pLC50)
1
2′-DEOXY-5-FLUOROURIDINE
27,640
6.6
4.800a
3
3.122
2
3-HP
95,678
6.4
6.017
3
3.246
3
5,6-DIHYDRO-5-AZACYTIDINE
264,880
5
5.228
2.8
2.962
4
5-AZA-2′-DEOXYCYTIDINE
127,716
7
6.325
3.5
2.975
5
5-AZACYTIDINE
102,816
6.5
5.812
2.7
2.969
6
5-HP
107,392
5.9
6.653
2.8
2.920
7
ACIVICIN
163,501
6.5
6.823
3
2.966
8
ALPHA-TGDR
71,851
4.1
6.147
2.3
2.278
9
AMINOPTERIN DERIVATIVE1
132,483
7.3
7.411
4
4.339
10
AMINOPTERIN DERIVATIVE2
184,692
7.7
9.171a
4
4.016
11
AMINOPTERIN DERIVATIVE3
134,033
8
7.602
4
3.867
12
AMONAFIDE
308,847
5.9
5.679
3.9
4.158
13
AN ANTIFOL
623,017
8
7.770
4
3.871
14
ANTHRAPYRAZOLE DERIVATIVE
355,644
6.7
5.841
4
3.937b
15
ARA-C
63,878
7.3
6.608
4
2.982b
16
ASALEY
167,780
5.8
7.769a
4.1
3.824b
17
AZQ
182,986
5.6
4.377
3.9
3.756
18
BAKER'S SOLUBLE ANTIFOL
139,105
5.6
5.924
3
3.035
19
BCNU
409,962
5.1
4.818
3.5
3.006b
20
BETA-TGDR
71,261
6.6
6.225
2.9
2.725
21
BISANTRENE HCl
337,766
4.1
5.612
3.6
3.904
22
BREQUINAR
368,390
6.7
7.403a
3.3
3.237
23
BUSULFAN
750
4
4.105
3.6
3.501
24
CAMPTOTHECIN
94,600
7.6
7.603a
4.5
3.992
25
CAMPTOTHECIN, HYDROXY-
107,124
7.4
7.499
4.2
3.810b
26
CAMPTOTHECIN, NA SALT
100,880
7.5
7.508
3.8
3.806
27
CCNU
79,037
5.3
5.723
3.7
3.431
28
CHLORAMBUCIL
3088
5.2
5.396
3.3
3.545
29
CHLOROZOTOCIN
178,248
4.1
4.861
2.9
3.213b
30
CLOMESONE
338,947
4.6
4.845
2.3
2.520
31
COLCHICINE
757
5.9
5.710
3.2
3.557
32
CYANOMORPHOLINODOXORUBICIN
357,704
8.6
5.437a
4.6
4.032
33
CYCLOCYTIDINE
145,668
6.9
6.649
3
3.278b
34
CYCLODISONE
348,948
5.1
5.175
2.7
2.553
35
DAUNORUBICIN
82,151
5.9
6.556
4
3.762b
36
DEOXYDOXORUBICIN
267,469
6.4
5.659a
3.8
3.795
37
DIANHYDROGALACTITOL
132,313
5.8
6.496a
3.8
3.797
38
DICHLORALLYL LAWSONE
126,771
5.8
7.239a
3.7
3.754
39
FLUORODOPAN
73,754
3.5
4.617a
2.6
2.345
40
FTORAFUR (PRO-DRUG)
148,958
4.6
5.204
3
2.593
41
GUANAZOLE
1895
3
3.224
2
1.793
42
HEPSULFAM
329,680
4.1
3.962
2.6
3.425b
43
HYCANTHONE
142,982
5.2
5.990
4.1
4.019
44
HYDROXYUREA
32,065
4.2
4.411
2.7
2.826
45
INOSINE GLYCODIALDEHYDE
118,994
4.2
5.417a
2.6
3.808b
46
L-ALANOSINE
153,353
5.1
5.059
3.3
3.268
47
M-AMSA
249,992
6.6
6.268
4.1
4.138
48
MAYTANSINE
153,858
8
7.321
4.6
4.535
49
MELPHALAN
8806
5.2
5.636
3.7
3.621
50
MENOGARIL
269,148
5.9
6.745
4.3
3.884
51
METHOTREXATE
740
7.6
8.522a
4.1
3.908b
52
METHYL CCNU
95,441
5.8
5.748
3.6
3.458
53
MITOMYCIN C
26,980
5.9
5.445
4.6
3.559
54
MITOXANTRONE
301,739
7.7
6.715
4.6
4.055
55
MITOZOLAMIDE
353,451
4.9
5.273
2.9
3.080
56
MORPHOLINODOXORUBICIN
354,646
8.6
7.223a
4.7
4.366b
57
N-(PHOSPHONOACETYL)-L-ASPARTATE (PALA)
224,131
4.1
3.986
2
2.090b
58
N,N-DIBENZYL DAUNOMYCIN
268,242
5.8
6.780
4.3
3.855
59
NITROGEN MUSTARD
762
7.2
6.971
4.1
3.473
60
OXANTHRAZOLE
349,174
5.9
5.930
3.6
4.128b
61
PCNU
95,466
4.6
5.214
2.9
3.380
62
PIPERAZINE DRUGSMAINATOR
344,007
4.6
5.154a
3
3.372
63
PIPERAZINEDIONE
135,758
6.6
6.145a
3
3.135
64
PIPOBROMAN
25,154
4.8
4.493
3.4
3.363
65
PORFIROMYCIN
56,410
5.1
5.254
3
3.299
66
PYRAZOFURIN
143,095
6.3
6.013
2.3
2.905
67
PYRAZOLOACRIDINE
366,140
6.7
5.772
4.6
4.167
68
PYRAZOLOIMIDAZOLE
51,143
3.5
3.786
2
2.640
69
RHIZOXIN
332,598
8
7.654
4.7
4.825
70
RUBIDAZONE
164,011
5.3
6.821
3.9
3.646
71
SPIROHYDANTOIN MUSTARD
172,112
4.5
5.463
3.6
3.338b
72
TAXOL
125,973
6.2
5.974
4
5.186
73
TEROXIRONE
296,934
5.7
4.698a
2.6
2.477
74
THIOPURINE
755
6
5.405
3.8
3.690
75
THIOGUANINE
752
6.7
5.517a
3.1
2.871b
76
THIO-TEPA
6396
5.1
4.822
3.1
2.401b
77
TRIETHYLENEMELAMINE
9706
6.3
5.981
1.1
1.329
78
TRIMETREXATE
352,122
7.6
7.571
3.6
3.928
79
TRITYL CYSTEINE
83,265
5.3
4.751
3.9
4.015
80
URACIL NITROGEN MUSTARD
34,462
5.8
5.530
3.5
3.461
81
VINBLASTINE SULFATE
49,842
7
7.386
5.7
5.554
82
VINCRISTINE SULFATE
67,574
6.8
6.593
3.3
3.810
83
VM-26
122,819
6.2
4.681
4.6
4.047
84
VP-16
141,540
4.2
5.275
3.1
3.577
85
YOSHI-864
102,627
3.4
4.978
2
2.134
The results for the validation of the QSAR models presented as
Toxicity
Activity
The calculated Q2LOO value, 0.833 and 0.744 respectively for pLC50 and pGI50 suggests a good internal validation. An external validation method where the test set constituting 30% of the dataset was subjected to the model, confirms the model was indeed good since their values were 0.716 and 0.614 respectively for the toxicity and activity models. These values suggest the robustness of the constructed models. The result of predict test set data are given in Table 1. The predicted values for pLC50 for the compounds in the training and test sets using Eq. (1) were plotted against the experimental pLC50 values in Fig. 1, while the for pGI50 it was shown Fig. 3. As can be seen from Table 1 and Figs. 1 and 3, the calculated values for the pLC50 as well as pGI50 are in good agreement with those of the experimental values.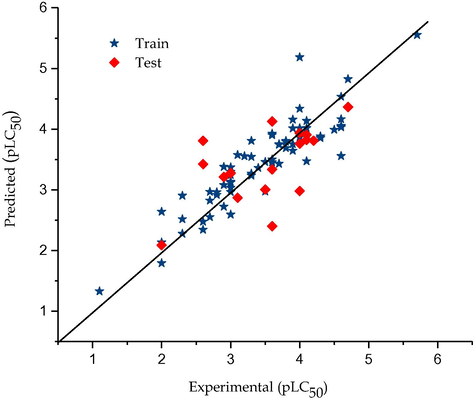
Graphical representation of predicted against experimental toxicity by GA-MLR (P388ADR CELL LINE).
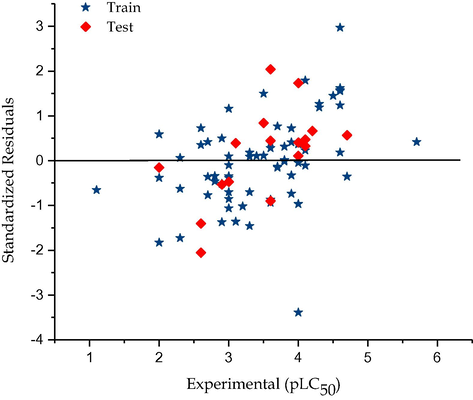
Graphical representation of Standardized residual against experimental toxicity (P388ADR CELL LINE).
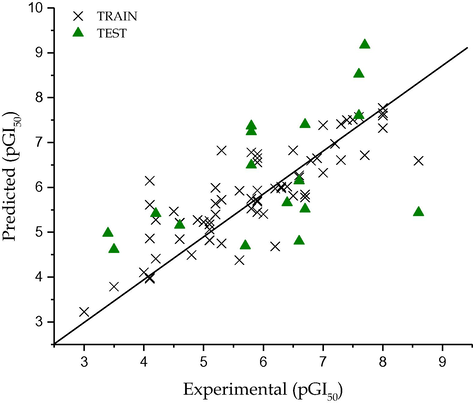
Graphical representation of predicted against experimental activity by GA-MLR (P388ADR CELL LINE).
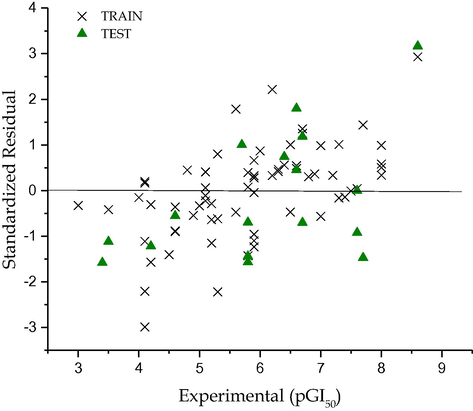
Graphical representation of Standardized residual against experimental activity (P388ADR CELL LINE).
In 2016, similar research by Arthur et al. (2016b), published a QSAR model for the pGI50 and pLC50 model of anticancer compounds on SR leukemia cell line. The research shows that the descriptor TDB3i is the most important descriptor since it has the highest coefficient in the model, and the predicted R2 values for the pGI50 (0.656) and pLC50 (0.580) were in good comparison with the models developed in this work. Descriptors such as number of Methanal group (nMethanal) and Secondary butyl, Sum of atom-type E-State:-F (S_Sf), were found to be principally responsible for the activity nature of the compounds on SR cell lines, thereby supporting the effect of Methanal group on the activity of the anticancer compounds in controlling cancer cells.
3.3 Applicability domain study
The applicability domain of the models were evaluated using Uzairu’s plot which is novel applicability domain technique by Arthur et al. (2016a). This techniques involves plotting the standardized residuals of the activities and toxicities against the normalized mean distance between the values for the complete dataset of the molecular descriptors appearing in the model for both the toxicity and activity.
The plots shown in Figs. 5 and 6, indicates that all the compounds in both cases fell within the chemical space of the models. Fig. 5 shows the presence of one outlier with ID = 32, which is cyanomorpholinodoxorubicin, while in Fig. 6 the outlier Taxol was identified with ID = 72. These models were unable to predict the experimental values of these compounds because the molecular structure of the compound were completely different. We found out that these compounds were very large in size and they do not contain the primary molecular descriptor needed to predict their experimental values.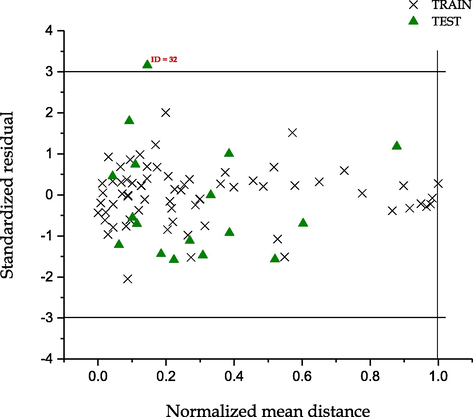
Uzairu’s plot: A graphical representation of Standardized residual against normalized mean distance of activity (pGI50).
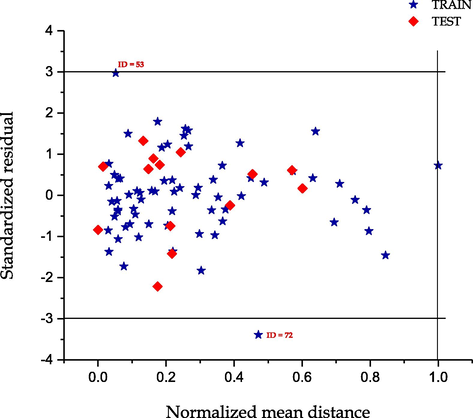
Uzairu’s plot: A graphical representation of Standardized residual against normalized mean distance of toxicity (pLC50).
Also, the plot of the residual against the predicted values of pLC50 and pGI50 for both the training and test sets shown in Figs. 2 and 4 respectively. The model did not show any proportional and systematic error because the propagation of the residuals on both sides of zero is random.
The multi-collinearity amid the descriptors existing in the models was spotted by calculating their variation inflation factors (VIF), which can be calculated as follows: where R2 is the correlation coefficient of the multiple regression between the variables within the model (Shapiro et al., 2002). The corresponding VIF values of the descriptors were presented in Table 3.1 and 3.2. The tables show, all the variables have VIF values of less than five except for two descriptors, indicating that the descriptors were reasonably orthogonal.
In order to assess the strength of the model, the Y-randomization test was used in this study (Golbraikh et al., 2003, Tropsha et al., 2003). Y-randomization test settles whether the model is gotten through coincidental correlation, and is a true structure–activity relationship to validate the capability of the training set molecules.
The new QSAR models (after several repetitions) would be expected to have low R2 and Q2LOO values (Table 2.1 and 2.2). If the opposite happens, then an acceptable QSAR model cannot be obtained for the specific modeling method and data. The results of Tables 2.1 and 2.2 indicate that an acceptable model is obtained by GA–MLR method and the model developed is statistically significant and robust.
Model
R2train
QLOO
Random 1
0.059245
0.13348
Random 2
0.125744
0.17506
Random 3
0.125553
0.30854
Random 4
0.065366
0.25758
Random 5
0.098924
0.21199
Random 6
0.159696
0.11592
Random 7
0.095924
0.1475
Random 8
0.153763
0.2116
Random 9
0.17986
0.06468
Random 10
0.061857
0.3686
Random Models Parameters
cRp2:
0.65333
Model
R2train
QLOO
Random 1
0.068698
−0.28859
Random 2
0.068368
−0.23595
Random 3
0.130789
−0.14449
Random 4
0.067171
−0.23575
Random 5
0.214743
−0.09546
Random 6
0.138033
−0.11832
Random 7
0.180078
−0.05679
Random 8
0.104373
−0.3549
Random 9
0.174189
−0.12221
Random 10
0.051069
−0.45851
Random Models Parameters
cRp2:
0.515361
3.4 Interpretation of descriptors
By interpreting the descriptors contained in the QSAR model, it is plausible to increase a few bits of information into factors, which are identified with the anti-leukemia action. Hence, a satisfactory understanding of the chosen descriptors is given below. The brief representations of descriptors shown in Table 3.1 and 3.2. To look at the comparative meaning and also the importance of every descriptor in the model, the assessment of the mean effect (MF) was established for every descriptor (Pourbasheer et al., 2009, Riahi et al., 2009); This was achieved by using an MF mathematical statement which is given as
is given as the mean effect for the considered molecular descriptor j, while
is the coefficient of the descriptor j,
represents the values for the target descriptors of each molecule, and m is the total number of descriptors in the model. The MF values proves the relative implication of a descriptor, associated with other descriptors in the model. Its sign shows the variation direction in the estimations of the model as an effect of the descriptor values.
Descriptors
Description
MF
VIF
Methanal
Functional group count
−0.09934
1.126
Shadow length: LX
Geometrical descriptor
−1.60374
3.392
Dipole (debye)
Electrostatic descriptor
−0.83386
1.138
AATSC4i
Average centered Broto-Moreau autocorrelation – lag 4/weighted by first ionization potential
−1.5074
1.129
MATS3e
Moran autocorrelation – lag 3/weighted by Sanderson electronegativities
2.163385
1.130
SpMax_Dt
Leading eigenvalue from detour matrix
1.36951
2.501
naaaC
Count of atom-type E-State:::C:
0.265287
1.292
Descriptors
Definition
MF
VIF
AATS8e
Average Broto-Moreau autocorrelation – lag 8/weighted by Sanderson electronegativities
−0.290
2.515
ATSC6c
Centered Broto-Moreau autocorrelation – lag 6/weighted by charges
0.098
1.100
ATSC6i
Centered Broto-Moreau autocorrelation – lag 6/weighted by first ionization potential
0.407
1.412
AATSC6v
Average centered Broto-Moreau autocorrelation – lag 6/weighted by van der Waals volumes
−0.159
2.184
AATSC1p
Average centered Broto-Moreau autocorrelation – lag 1/weighted by polarizabilities
0.376
1.195
GATS7v
Geary autocorrelation – lag 7/weighted by van der Waals volumes
−0.047
1.790
SpMin2_Bhs
Smallest absolute eigenvalue of Burden modified matrix – n 2/weighted by relative I-state
0.621
2.494
mindsCH
Minimum atom-type E-State: dbndCHsbnd
0.062
1.564
RDF70m
Radial distribution function - 070/weighted by relative mass
−0.056
2.117
The dipole moment is an electric polarization descriptor; it encodes information about charge distribution in molecules. They are also important in modelling solvation properties of the compounds which depend on solute/solvent interactions since the mean effect of the dipole moment was found to be negative hence a reduction in the polarity of these compounds was found to steadily decrease the toxicity of anti-leukemia compounds. The dipole moment is given as
– molecular orbitals
– electron position operator
Za – a-th atomic nuclear charge
– position vector of a-th atomic nucleus
Methanal as a functional group count descriptor, whose mean effect was also found to negatively affect the toxicity of the compounds, while the shadow length Lx is the maximum dimensions of the molecular surface projections and it also negatively affects the toxicities of these compounds, this was confirmed by the negative values of the mean effect.
AATSC4i, MATS3e, and AATS8e, ATSC6C, ATSC6i, AATSC6v, AATSC1p, GATS7v are 2D Autocorrelation descriptors developed by (Todeschini and Consonni, 2009), The 2D autocorrelation descriptors have been successfully employed by Fernandez et al. (Fernandez-Lozano et al., 2015) Caballero (Caballero, 2010, Fernández et al., 2005, Vilar et al., 2009).
In these descriptors, the molecule atoms represent a set of discrete points in space, and the atomic property and function are evaluated at those points. The sign on the mean effects influences their behaviors in whatever model they are found in. theses descriptors as defined on Table 3.1 and 3.2 describes the weight by first ionization potential, weighted by Sanderson electro-negativities, weighted by charges, by van der Waals volumes and by polarizabilities of the molecules used determines the potency of anti-leukemia compounds.
4 Conclusion
The aim of the present work was developing a QSAR study and predicting the anti-leukemia activities and toxicities of some potent NCI anticancer compounds. Different hypothetical molecular descriptors were ascertained by paDEL Software and chose by Genetic Algorithm. The developed GA–MLR model was surveyed extensively (inward and outside validations), and every one of the validation show that the QSAR model we fabricated is vigorous and agreeable. Selection of seven variables in toxicity and nine variables for the activity model showed that the descriptors methanal, shadow length LX, dipole moment, AATSC4i, MATS3e, SPMax_DT, naaaC and AATS8e, ATSC6C, ATSC6i, AATSC6v, AATSC1p, GATS7v, SpMin2_Bhs, MindsCH, RDF70m of the molecules play a main role in the anti-leukemia activity and toxicity of the compounds.
Competing interests
The authors have declared no conflict of interest.
Authors’ contributions
DEA carried out the computational studies, participated in the design and drafted the manuscript. AU carried out the statistical validation of the models and participated in the write up. PM, GS and SEA participated in the design of the study and modelling the QSAR data. DEA and AU conceived of the study and coordination that helped prepare the manuscript to its final format. All authors read and approved the final manuscript.
References
- Design, synthesis and biological evaluation of some novel substituted quinazolines as antitumor agents. Eur. J. Med. Chem.. 2014;79:446-454.
- [Google Scholar]
- Application of k-means clustering, linear discriminant analysis and multivariate linear regression for the development of a predictive QSAR model on 5-lipoxygenase inhibitors. Chemometrics Intell. Laboratory Syst.. 2015;143:122-129.
- [Google Scholar]
- Insilco study on the toxicity of anti-cancer compounds tested against MOLT-4 and p388 cell lines using GA-MLR technique. Beni-Suef University J. Basic Appl. Sci. 2016
- [Google Scholar]
- Quantum modelling of the Structure-Activity and toxicity relationship studies of some potent compounds on SR leukemia cell line. Chem. Data Collect.. 2016;5:46-61.
- [Google Scholar]
- Treatment of electronic excitations within the adiabatic approximation of time dependent density functional theory. Chem. Phys. Lett.. 1996;256:454-464.
- [Google Scholar]
- Synthesis, characterization, crystal structure and DFT study of two new polymorphs of a Schiff base (E)-2-((2,6-dichlorobenzylidene)amino)benzonitrile. J. Mol. Struct.. 2016;1105:186-193.
- [Google Scholar]
- 3D-QSAR (CoMFA and CoMSIA) and pharmacophore (GALAHAD) studies on the differential inhibition of aldose reductase by flavonoid compounds. J. Mol. Graph. Model.. 2010;29:363-371.
- [Google Scholar]
- C. Carlberg 2014. Statistical Analysis: Microsoft Excel 2013, Que Publishing.
- Development of quantitative structure activity relationship (QSAR) model for disinfection byproduct (DBP) research: a review of methods and resources. J. Hazard. Mater.. 2015;299:260-279.
- [Google Scholar]
- A fast and elitist multiobjective genetic algorithm: NSGA-II. IEEE Trans. Evolutionary Comput.. 2002;6:182-197.
- [Google Scholar]
- Generating coursework feedback for large groups of students using MS Excel and MS Word. Univ. Chem. Educ.. 2001;5:1-8.
- [Google Scholar]
- Molecular bonding-based descriptors for surface adsorption and reactivity. J. Catal.. 2015;324:50-58.
- [Google Scholar]
- History of the Harvard ChemDraw project. Angewandte Chemie Int. Ed.. 2014;53:11140-11145.
- [Google Scholar]
- Classification of signaling proteins based on molecular star graph descriptors using Machine Learning models. J. Theor. Biol.. 2015;384:50-58.
- [Google Scholar]
- Quantitative structure–activity relationship to predict differential inhibition of aldose reductase by flavonoid compounds. Bioorganic Med. Chem.. 2005;13:3269-3277.
- [Google Scholar]
- Optimization, pharmacophore modeling and 3D-QSAR studies of sipholanes as breast cancer migration and proliferation inhibitors. Eur. J. Med. Chem.. 2014;73:310-324.
- [Google Scholar]
- QSAR studies and design of new analogs of vitamin E with enhanced antiproliferative activity on MCF-7 breast cancer cells. J. Taiwan Inst. Chem. Eng. 2016
- [Google Scholar]
- Rational selection of training and test sets for the development of validated QSAR models. J. Computer-Aided Mol. Des.. 2003;17:241-253.
- [Google Scholar]
- Chemistry with Computation: An introduction to SPARTAN. Wavefunction, Inc.; 1995.
- Advantages of adjuvant chemotherapy for patients with triple-negative breast cancer at Stage II: usefulness of prognostic markers E-cadherin and Ki67. Breast Cancer Res.. 2011;13:R122.
- [Google Scholar]
- Chemical substructures that enrich for biological activity. Bioinformatics. 2008;24:2518-2525.
- [Google Scholar]
- Genetic algorithms as a strategy for feature selection. J. Chemom.. 1992;6:267-281.
- [Google Scholar]
- Personal experience with four kinds of chemical structure drawing software: review on ChemDraw, ChemWindow, ISIS/Draw, and ChemSketch. J. Chem. Inf. Comput. Sci.. 2004;44:1886-1890.
- [Google Scholar]
- Dragon software: An easy approach to molecular descriptor calculations. Match. 2006;56:237-248.
- [Google Scholar]
- pls: Partial least squares and principal component regression. R package version. 2011;2:3.
- [Google Scholar]
- Application of genetic algorithm-support vector machine (GA-SVM) for prediction of BK-channels activity. Eur. J. Med. Chem.. 2009;44:5023-5028.
- [Google Scholar]
- Investigation of different linear and nonlinear chemometric methods for modeling of retention index of essential oil components: Concerns to support vector machine. J. Hazardous Mater.. 2009;166:853-859.
- [Google Scholar]
- A randomised crossover trial of chemotherapy in the home: patient preferences and cost analysis. Med. J. Australia. 2000;173:125-127.
- [Google Scholar]
- Some case studies on application of “rm2” metrics for judging quality of quantitative structure–activity relationship predictions: emphasis on scaling of response data. J. Comput. Chem.. 2013;34:1071-1082.
- [Google Scholar]
- On a simple approach for determining applicability domain of QSAR models. Chemometrics Intell. Lab. Syst.. 2015;145:22-29.
- [Google Scholar]
- An in vitro oral biofilm model for comparing the efficacy of antimicrobial mouthrinses. Caries Res.. 2002;36:93-100.
- [Google Scholar]
- Chemoinformatics in anti-cancer chemotherapy: Multi-target QSAR model for the in silico discovery of anti-breast cancer agents. Eur. J. Pharm. Sci.. 2012;47:273-279.
- [Google Scholar]
- Rational drug design for anti-cancer chemotherapy: Multi-target QSAR models for the in silico discovery of anti-colorectal cancer agents. Bioorg. Med. Chem.. 2012;20:4848-4855.
- [Google Scholar]
- TALETE 2007. DRAGON. Milano, Italy.
- Todeschini, R., Consonni, V. 2009. Molecular Descriptors for Chemoinformatics, Volume 41 (2 Volume Set), John Wiley & Sons.
- Best practices for QSAR model development, validation, and exploitation. Mol. Inf.. 2010;29:476-488.
- [Google Scholar]
- The importance of being earnest: validation is the absolute essential for successful application and interpretation of QSPR models. QSAR Comb. Sci.. 2003;22:69-77.
- [Google Scholar]
- A network-QSAR model for prediction of genetic-component biomarkers in human colorectal cancer. J. Theor. Biol.. 2009;261:449-458.
- [Google Scholar]
- Chemometrics with R: multivariate data analysis in the natural sciences and life sciences. Springer Science & Business Media; 2011.
- PaDEL-descriptor: An open source software to calculate molecular descriptors and fingerprints. J. Comput. Chem. 2011;32:1466-1474.
- [Google Scholar]
- A novel two-step QSAR modeling work flow to predict selectivity and activity of HDAC inhibitors. Bioorg. Med. Chem. Lett.. 2013;23:929-933.
- [Google Scholar]
Appendix A
Supplementary data
Supplementary data associated with this article can be found, in the online version, at https://doi.org/10.1016/j.jksus.2018.05.023.
Appendix A
Supplementary data


