

Translate this page into:
Activated carbon synthesis and methylene blue adsorption from pepper stem using microwave assisted impregnation method: Isotherm and kinetics
-
Received: ,
Accepted: ,
This article was originally published by Elsevier and was migrated to Scientific Scholar after the change of Publisher.
Peer review under responsibility of King Saud University.
Abstract
Background
Adsorption is a potent technique used to separate hazardous compounds due to its practical, affordable, and ecologically benign uses. Activated carbons are often employed for better results in adsorption processes. Agricultural by-products and wastes have recently been used in the development of large-pored adsorbents. These adsorbents are gaining popularity as an alternative to commercial activated carbons.
Methods
This study integrated the known carbonization method with a microwave device, and waste pepper stalks (locally known as isot) activated with phosphoric acid were carbonized at 650 °C for 30 min. The activated carbon (BSAC) obtained was utilized in the adsorption of dyestuff (methylene blue MtB). The adsorption was investigated according to pH, concentration, and kinetic model.
Results
The monolayer adsorption capacity (qmax) was 178.4121 mg g−1 based on Langmuir isotherm, which was the most appropriate match. Response surface methodology (RSM) was used to examine the removal of MtB. The central composite method was used in RSM. In experimental design, solution initial concentration (75–150 ppm), adsorption time (120–240 min) and activated carbon amount (50–100 mg) were selected and adsorption capacity (qe) was chosen as response parameter. The adsorption capacity was 75.0072 mg g−1 under optimum conditions (88 ppm solution initial concentration, 191 min, adsorption time and 95 mg activated carbon).
Conclusion
The activated carbon obtained from pepper (isot) stems with microwave impregnation process integrated into the traditional method are a cheap and environmentally friendly adsorbent for MtB removal.
Keywords
Waste pepper (isot) stems
Activated carbon
Microwave impregnation
Removal of methylene blue

1 Introduction
The contamination of water resources by various pollutants is one of the major environmental problems (Charola et al., 2018). The environment and water resources are threatened by dyestuffs that are commonly used in leather, papermaking, textile, and other industries to dye the products (Gupta et al., 2021). In addition, release of the dyestuff sources in the aquatic environments without treatment leads to a decrease in the photosynthetic activity of the water sources and disrupts the balance in the aquatic environment (Selambakkannu et al., 2019). Therefore, removing the dyestuffs from the wastewater before their release is an important process. Methylene blue (MtB) is one of the organic dyestuffs used for dyeing many silk, wool, and cotton fabrics. However, pollutants from MtB are highly toxic and exert allergenic, mutagenic, and carcinogenic effects (Abbasi et al., 2020). Therefore, these pollutants must be removed from MtB before its release in the environment.
Adsorption is a powerful method used to separate toxic molecules, heavy metals, and dyestuffs, due to its environmentally friendly, practical, and inexpensive nature (Genli et al., 2021; Jain et al., 2020). Activated carbons are widely used to increase the success of adsorption process. Conventional activated carbon production is done using physical and chemical methods, involving activation and carbonization (Thue et al., 2017; Salem et al., 2020). The activated carbon production by chemical activation is affected by several factors, including infusion temperature, duration, and rate in achieving suitable pore size and surface area (Gao et al., 2020). However, rapid heating, shorter impregnation, and effective carbonization process are realized with microwave assisted impregnation (Teimouri et al., 2019). Higher surface area and pore sizes had been reported in activated carbon obtained with the microwave assisted impregnation method compared to classical method (Baytar et al., 2018). Recently, microwave assisted impregnation method has been used in the production of cheap, large-pored adsorbents from agricultural by-products or wastes. The agricultural waste products are abundant in nature, and adsorbents produced from these substances are gaining significant importance as a second option to commercial activated carbons.
Pepper was cultivated in the world on 2 million hectares during 2020 with the production of 36 million tons. Similarly, pepper was cultivated on 91 thousand hectares in Turkey during 2022 with the production of 2.6 million tons (FAOSTAT, 2022). Approximately 75% of the country’ pepper was produced in Şanlıurfa province located in the southeastern region of Turkey (Korkmaz et al., 2017). The peppers grown in the province are localy called isot. The isots produced are both consumed fresh and in spice making. For spice making, fleshy parts of isot pepper are separated from the seeds and stems and used (Korkmaz et al., 2017). There is plenty of waste isot pepper stems which could be utilized to produce adsorbents.
Response surface methodology (RSM) has been employed to design an experimental matrix and regulate its optimization by changing the parameters in several studies (Aly-Eldeen et al., 2018; Beyan et al., 2021; Genli et al., 2021). This study was aimed at producing activated carbon from waste stems of hot pepper (BS), which is widely consumed around the world, using the microwave assisted impregnation method. The produced activated carbons were employed to examine MtB adsorption. Firstly, the impregnation of H3PO4 to the BS structure was performed in the microwave environment. In the next step, carbonization was carried out to achieve a highly porous structure using high temperature in an inert environment. The prepared activated carbons were characterized by employing related instruments. Central composite experimental design was used in the RSM model applied to improve the adsorption parameters. In addition, kinetics and equilibrium studies were implemented to determine the maximum adsorption capacity under optimum conditions.
2 Materials and methods
2.1 Characterization and production of MH-PS
The waste isot pepper stems were collected from local producers (20 producers) in Şanlıurfa province. The collected stems were thoroughly washed and stored at 80 °C for 24 h before use. Afterwards, the stems with 100% H3PO4 chemical were used in microwave-assisted impregnation process for high pore volume and high surface area (Baytar et al., 2018). The microwave time was kept 15 min (Sharif et al., 2018), microwave power was 500 W (Foo and Hameed, 2012) and the microwave environment gas was CO2 for effective impregnation process (İzgi et al., 2019). The samples completing microwave impregnation process were subjected to activation process at 650 °C for 30 min in an inert muffle furnace with N2 gas. The produced activated carbon was coded as BSAC. The surface features of BSAC were evaluated by Brunauer–Emmett–Teller (BET) analysis (Quantachrome Nova 1200 series instrument), carried out in liquid nitrogen (77 K). The functional groups in BSAC structure were determined by performing the Fourier-transform infrared spectroscopy (FTIR) analysis between 4000 and 400 cm−1 wave number (Bruker Vertex 70 FT-IR device). The scanning electron microscope (SEM) analyzes were performed to obtain the BSAC surface morphological image (ZEISS Evo/LS 10 electron microscope).
2.2 Preparation of stock solution from methylene blue dyestuff
Working solution concentrations were prepared by diluting the previously prepared 1000 ppm stock solution. A certain concentration of acid or base solution was added to arrange the solutions acidity.
2.3 Adsorption experiment
Different conditions were opted for the adsorption of MtB. The final concentrations of the solutions were determined at a wavelength of 664 nm at the end of the determination time by using a ultraviolet–visible spectroscopy (UV–vis) spectrophotometer (Hitachi U-0080D). Adsorbed MtB amount (qe) was calculated using Eq. (1).
The Ce (ppm) and Co (ppm) in the equation represent the concentration of methylene blue concentration at equilibrium and initial concentration, V (ml) is solution volume, and w (g) denotes activated carbon amount.
2.4 Adsorption kinetics
Kinetic models such as intraparticle diffusion (Weber and Morris, 1963), pseudo-second order (Ho, 2006) and pseudo-first order (Lagergren, 1898) was used to study and model the dynamic mode of motion. The mathematical formulas of the mentioned models are given in Eqs. (2)–(4).
Here, qe (mg/g) and qt (mg/g) are the adsorption capacities at equilibrium and at time t (min), respectively. The k1 (min−1), k2 (g mg−1 min−1) and lower (mg/g min−1/2) show pseudo-first order, pseudo-second order and intraparticle adsorption rate constants. The C (mg/g) represents a constant related to the boundary layer thickness.
2.5 Adsorption isotherm
Adsorption equilibrium data were modeled by using Eqs. (5)–(7).
Here, qe (mg g−1) and qm (mg g−1) show the equilibrium and maximum dye adsorption capacities of the adsorbent, respectively. The Ce (ppm) indicates the equilibrium solution concentration. The KL (L mg−1) and RL represent the Langmuir equilibrium constant and separation factor for adsorption energy, and Freundlich constant are nF and KF (mg g−1 (L mg−1)1/nF) for density and adsorption capacity, respectively.
2.6 Modeling of adsorption by experimental design (RSM)
The RSM method including the central composite experiment design was used in the experimental design applied for MtB adsorption studies absorbed by BSAC and obtained results are given in Table 1. The experimental conditions designed according to this model are given in Table 2. According to the method, 18 different experimental sets emerged. There were two replications for each experiment and the obtained values were averaged.
Parameters
Code
Lowest value
Highest value
Solution initial concentration (ppm)
A
75
150
Time (min)
B
120
240
Adsorbent amount (mg)
C
50
100
Run
A: Solution initial concentration (ppm)
B: Time (min.)
C: Adsorbent amount (mg)
qe (mg g−1)
1
150
240
100
115.53
2
150
240
50
200.06
3
75
240
50
109.56
4
150
120
50
156.99
5
112.5
180
75
104.71
6
112.5
180
75
105.38
7
75
240
100
70.43
8
112.5
180
75
106.02
9
112.5
280.90
75
98.69
10
150
120
100
106.63
11
112.5
180
32.95
191.44
12
49.43
180
75
49.23
13
112.5
180
75
113.38
14
175.56
180
75
113.29
15
112.5
79.09
75
108.06
16
75
120
50
86.27
17
75
120
100
58.73
18
112.5
180
117.04
79.05
3 Result and discussion
3.1 The surface area of BET and pore size
The pore volume by Dubinin-Radushkevich (DR) method and the surface area by the Bruauer-Emmett-Teller (BET) method were determined with N2 adsorption at −196 °C. The porosity and surface area of activated carbon are important in adsorption success (Xu et al., 2014). The BET surface area of BSAC is given in Table 3. The reason for the high surface area was that H3PO4 activator penetrated deeply into the carbon structure in the microwave impregnation stage. Thus, causing the formation of a structure with a high surface area.
BSAC
Pore volume (cc g−1)
The area of surface (m2 g−1)
Total
Micro
Meso
Total
Micro
Meso
1.21
0.37
0.83
1003.34
886.312
117.028
Pseudo-order-first kinetic model
Activated carbon
BSAC
k1 (dk−1)
R2
q (%)
k2 (L mg−1 dk−1)
h
R2
q (%)
0.016
0.96
19.63
0.001
12.22
0.99
0.32
The isotherms obtained conformed to the type IV classification (Fig. 1a). The shoulder formation in this region showed that the adsorption took place in a single layer, and the rise occurred after the formation of meso and macro porosity in the structure. The adsorption proceeds in the form of capillary condensation in these areas. Desorption appeared precisely at the isotherms of surfaces with this porosity structure. The interaction of the N2 molecules with the BSAC structure might be responsible for this (Zhang et al., 2021; Kaouah et al., 2013).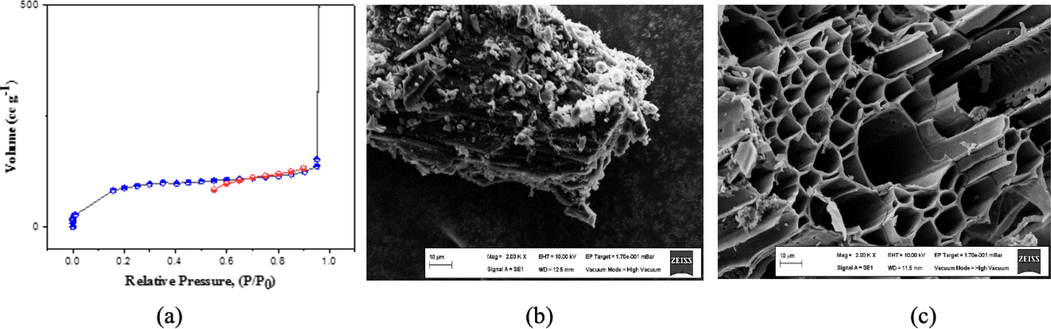
The adsorption and desorption isotherms of BSAC (a) and scanning electron microscopy figures of BS (b) and BSAC (c).
3.2 SEM images
The SEM images of raw isot pepper stems are given in Fig. 1b and c. The surface of raw isot stems was formed by joining overlapping layers. No pores were seen on the surface (Fig. 1b). When SEM images of BSAC obtained from isot pepper stems were examined (Fig. 1c). Melting and flaking on the surfaces and structures such as rods arranged side by side were observed in SEM image of BSAC.
3.3 Structural analysis
Structurally analysis of the raw isot pepper stems and BSAC by FT-IR spectra are given in Fig. 2a and b. The presence of OH and NH functional groups in the structure can be explained by the peaks occurring in 3320–3730 cm−1 (Danish et al., 2022). While vibration peaks of C—H bonds in the methyl group were observed around 2920 cm−1, the peaks occurring at a wavelength of 2300 cm−1 belonged to the —COOH functional group. The peaks at 1625 cm−1 and 1530 cm−1 were assigned to C⚌C functional groups belonging to aromatic ring. Peaks smaller than 1000 cm−1 were assigned to functional groups originating from the aromatic ring (Mohammed et al., 2015).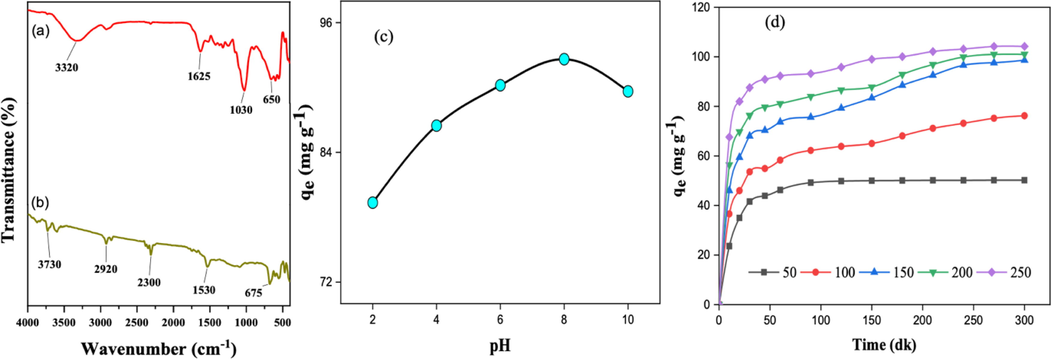
The FT-IR spectra of BS (a) and BSAC (b), impact of pH on qe (c) and the effect of concentration on qe (d).
3.4 The impact of pH on MtB adsorption
The presence and excess of anionic and/or cationic ions in the environment affect the interactions between the absorbent and the molecule or ion to be adsorbed. The pH of the solution was changed between 2 and 10. Other experiment conditions were determined as the initial concentration of 100 ppm MtB dyestuff, in a shaking of 150 rpm, considering the solution ambient temperature of 30 °C, the amount of 0.1 g BSAC, and 100 units of volume. Fig. 4 illustrated the adsorption capacity versus the solution pH.
The results revealed the maximum adsorption capacity (qe) of 92.61 mg g−1 at pH 8 (Fig. 2c). The reasons for this observed situation were the decrease in removal efficiency for cationic dyes at low pH and increase in removal efficiency for anionic dyes (Zhou et al., 2019). The excess OH— ion in the environment formed a complex with cationic dye and reduces adsorption under basic pH (Kutluay et al., 2020).
3.5 The impact of concentration on MtB adsorption
Different initial dye concentrations (50–250 ppm) were tested for MtB adsorption. Experimental studies were conducted in a “150 rpm and 30 °C” shaker. The variation between initial concentrations (ppm) and maximum adsorption capacities (qe) of BSAC activated carbon for MtB adsorption is given in Fig. 2d.
The MtB removal of BSAC increased from the aqueous medium. The adsorption capacity was 50.216 mg g−1 under 50 ppm concentration, while increased to 104.20 mg g−1 under 250 ppm. The possible reason for this increase was the increase in diffusion rate. The probability of the molecules or ions in the unit volume is higher under increased concentration. Rapidly increasing adsorption capacity slowed down and reached equilibrium due to the gradual filling of the pores of the adsorbents (Wu et al., 2009).
3.6 Determination of the adsorption kinetic model
The terms associated with the rate constant helped determine reaction kinetics and reaction dynamics. It is applied to assess the basic properties used in kinetic adsorption (Vargas et al., 2011). Different working times (0–250 min.) were determined in the current study. Kinetic models used in the current study were intraparticle diffusion model, second-pseudo-order, and first-pseudo-order. Obtained results according to these models are shown in Fig. 3a–c.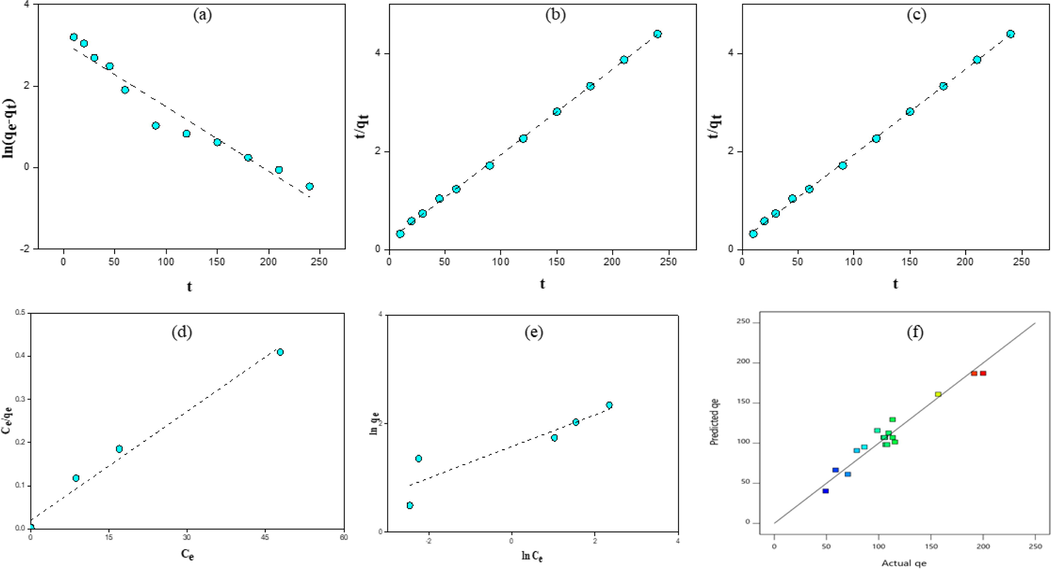
Pseudo-order-first kinetic model (a), pseudo-order-second kinetic model (b), intraparticle diffusion model (c), Langmuir, (d) and Freundlich (e) adsorption isotherms of MtB and comparison of test results and model results for MtB adsorption capacity of activated carbon.
The calculated standard deviation values and kinetic model regression coefficients related to MtB adsorption are given as in Table 4.
Isotherm constants
Langmuir
BSAC
qmax (mg/g)
178.41
KL
28.02
R2
0.99
Freundlich
BSAC
Kf (mg/g)(mg/L)1/n
93.55
n
6.05
R2
0.96
Langmuir separation factor
Concentration (mg L-1)
BSAC
250
0.0001454
200
0.0001677
150
0.0002214
100
0.0003122
50
0.0006344
Suitability of the proposed models
R2
BSAC
Linear
0.74
2FI
0.73
Quadratic
0.97
Cubic
0.87
While the regression coefficient (R2) was lower for the intraparticle diffusion model, standard deviation ( q) was lower for the second-pseudo-order model than the rest of the models. The second-pseudo-order kinetic model represented the experimental data. According to this model, it was thought that the interaction between the BSAC surface and MtB proceeded in the form of electron exchange or electron sharing (Reck et al., 2018).
Intraparticle diffusion model was performed to see the effect of diffusion phenomenon on dye adsorption. If the curve drawn between qt and t1/2 using the experimental data is linear, and this linear line intersects the y-axis at 0, it can be said that intraparticle diffusion is controlled with a single velocity step. According to the result graph obtained in Fig. 3a–c, the shapes obtained because of the adsorption process are not linear and do not intersect the y-axis at the 0 point. For this reason, it is thought that the adsorption carried out in this study could be controlled by multi-stage interactions (Li et al., 2018; Saber-Samandari et al., 2014).
3.7 The isotherms of MtB adsorption
The graphs created by using Langmiur and Freundlich isotherms are given in Fig. 3d and e. Equilibrium values of the MtB adsorption were determined by using these isotherms. The MtB adsorption isotherm constants and regression coefficients of isotherms were calculated with the help of the obtained equilibrium values and equations in Langmuir and Freundlich isotherm graphs (Table 4).
According to given regression coefficients, the adsorption equilibrium data highly complied with the Langmuir isotherm. The regression coefficients (R2) are as high as 0.99 and 0.96, respectively, and show similarities with each other. However, R2 values alone are not sufficient to determine the appropriate model (Misran et al., 2022). Therefore, a comparison should be made between the balance data and the calculated dye removal capacities (qmax) since Langmuir isotherm showed the highest capacity value, it could be said that the adsorption equilibrium data fit this isotherm. This model showed that the adsorbent surface had a homogeneous structure (Yağmur and Kaya, 2021). The n (6.05) value found in this study indicates that MtB adsorption is physical, and the 1/n (0.16) value indicates a very good adsorption process.
The separation factor (RL) values, which are the main characteristics of the Langmuir adsorption isotherm, are between 0 and 1, indicating a suitable adsorption process (Noreen et al., 2020). The fact that the RL values found for BSAC activated carbon in Table 4 were between 0 and 1 showed that the MtB adsorption from the aqueous medium with this adsorbent is suitable.
3.8 The modeling of MtB adsorption by response surface methodology (RSM)
The results obtained in MtB adsorption studies are given in Table 2. Suitability of the modeling with CPM model in RSM was evaluated with the regression (R2) coefficients. Obtained regression coefficients were given in Table 4.
The regression coefficient (R2) shows that the proposed model result was compatible with the experimental result. The R2 value is between 0 and 1, and when this value approaches 1, it is stated that the theoretical results obtained with the model are quite close to the experimental results. The model to be selected was decided by looking at the R2 value. For the model equation, the equation with fewer terms was preferred for the ease of application. The highest R2 value for activated carbon was found in the quadratic model. The regression coefficient value for BSAC activated carbon using MtB adsorption was 0.97.
The model expressing the variation of the single and multiple changing of adsorption parameters on the qe had been derived with the help of the quadratic model and the equation was given below in Eq. (8).
Here, A (ppm) referred to the initial solution concentration, B (min) meant the time, and C (g) denotes adsorbent amount. The relationship between the MtB adsorption capacity of BSAC, estimated using the equations is given in Fig. 3e. It can be said that estimated qe values and those obtained as in the experiment are almost equal. These results showed that the model equation could be used safely for the MtB adsorption process with BSAC activated carbon.
The ANOVA charts in the quadratic model were created to determine the effects of the selected parameters for BSAC activated carbon on the MtB adsorption capacity, either alone or in combination (Table 5). The amount of adsorbent had the variable with the highest F. According to the ANOVA table, the most effective parameter was the amount of adsorbent, and the change in the value of this parameter significantly affected the adsorption capacity qe. It was seen that the single parameters were more effective than the multiple parameters.
Source
Sum of squares
Mean squares
df
P value
F value
Model
24995.41
2777.27
9
0.0006
13.68
A-solution initial concentration
9594.41
9594.41
1
0.0001
47.26
B-time
371.27
371.27
1
0.2132
1.83
C- adsorbent amount
11169.95
11169.95
1
< 0.0001
55.03
AC
581.85
581.85
1
0.1289
2.87
AB
36.08
36.08
1
0.6844
0.1777
BC
261.76
261.76
1
0.2890
1.29
B2
0.0040
0.0040
1
0.9966
0.0000
A2
776.88
776.88
1
0.0862
3.83
C2
1600.61
1600.61
1
0.0229
7.89
Residual
1623.95
202.99
8
Pure Error
48.97
16.32
3
Lack of Fit
1574.98
315.00
5
0.0173
19.30
Corrected Total
26619.37
17
Three-dimensional-contour graphs of the single values of the selected parameters for MtB removal of BSAC activated carbon from the aqueous medium are given in Fig. 4a–c.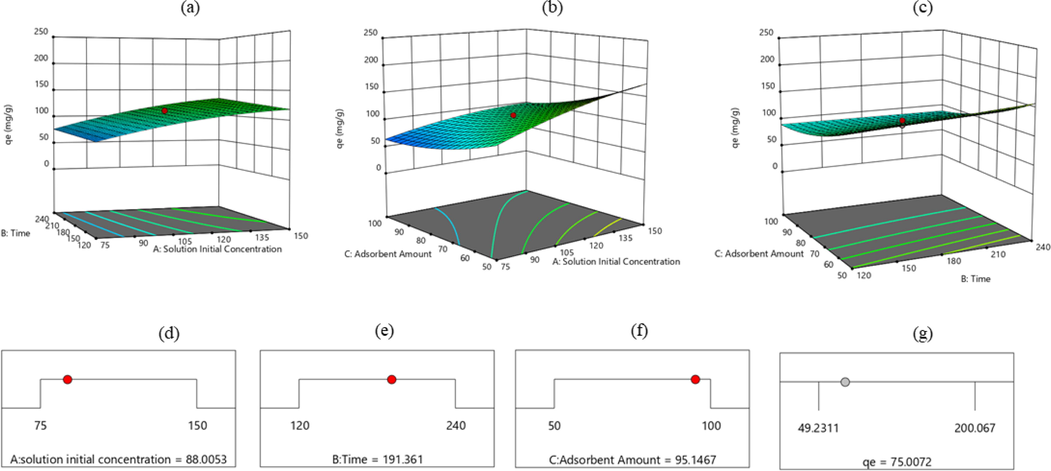
Individual effect of the selected parameters on MtB adsorption capacity for BSAC activated carbon, solution initial concentration–time (a), solution initial concentration–amount of adsorbent (b), time-adsorbent amount (c), and maximum MtB adsorption capacity of BSAC (d–g).
It is seen that qe at constant temperature would increase with increasing solution initial concentration–time pair (Fig. 4a). The value of qe decreased with increasing solution concentration-adsorbent amount pair. In the case of constant concentration, while the qe value decreased with increasing adsorbent amount, the qe value increased with increasing time. However, adsorption capacity decreased as increase in time-adsorbent amount couple.
Optimum numerical values of solution initial concentration, time and adsorbent amounts from experimental parameters were determined by using RSM model for the maximum adsorption capacity. The capacity value for MtB from aqueous medium for BSAC activated carbon under the determined optimum experimental conditions was 75.00 mg g−1 (Fig. 4d–g).
3.9 Mechanism of the removal of MtB on BSAC
The adsorption mechanism of MtB on BSAC is illustrated in Fig. 5. The mechanism showed the interaction types between MtB molecule and the functional groups in the BSAC structure. Accordingly, here was an interaction between MtB+ cation and the hydroxyl groups in the BSAC structure under low pH, while the van der Waals interactions observed in physical absorptions were observed. Kinetic, structural and isotherm analyses of BSAC showed that MtB molecules were physically adsorbed due to interactions such as the van der Waals and n-π (electrostatic).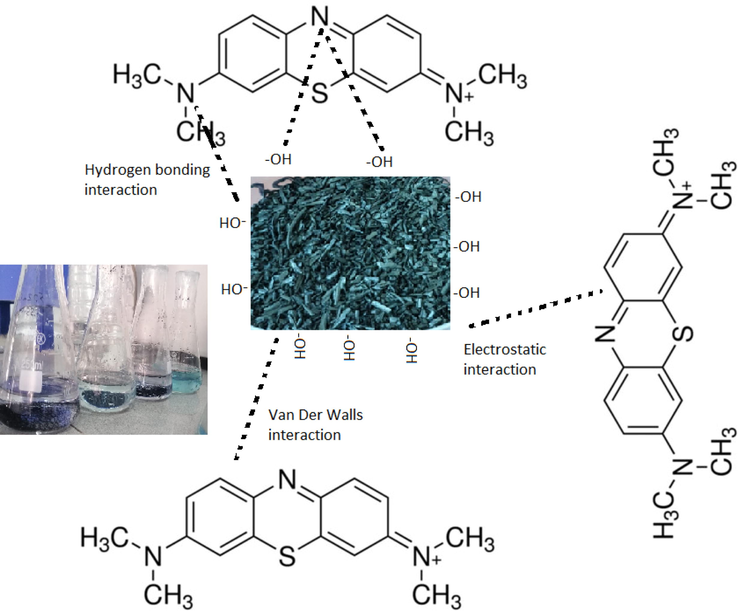
The scheme of the mechanism of MtB removal by BSAC.
4 Conclusion
The isot pepper stems were used the production of activated carbon by employing the H3PO4 chemical activation system supported by the microwave system integrated into the widely used chemical activation process. The best adsorption capacity was obtained at pH 8. The BSAC adsorption kinetics was studied that increased with the increase in initial solution concentration. It was determined that the kinetic model of second-pseudo- order was the most suitable model. Langmuir isotherm gave most suitable result in terms of equilibrium data. In addition, the adsorption time, adsorbent amount and solution initial concentration parameters were optimized using a central composite experimental design based on The optimum conditions were 88.05 ppm concentration, 95.14 mg activated carbon, 191.36 min duration, and 75.00 mg g−1 qe. It has been suggested by BSAC that the mechanism of MtB removal from the aqueous medium is mostly driven by the van der walls and electrostatic interactions. It is said that hydrogen bonds can be formed effectively in highly acidic environments. The obtained results revealed that the use of waste isot pepper stems for methylene blue adsorption from aqueous media is a promising green production application.
Declaration of Competing Interest
The authors declare that they have no known competing financial interests or personal relationships that could have appeared to influence the work reported in this paper.
References
- Keratin nanoparticles obtained from human hair for removal of crystal violet from aqueous solution: Optimized by Taguchi method. Int. J. Biol. Macromol.. 2020;143:492-500.
- [CrossRef] [Google Scholar]
- The uptake of Eriochrome Black T dye from aqueous solutions utilizing waste activated sludge: Adsorption process optimization using factorial design. Egypt. J. Aquatic Res.. 2018;44(3):179-186.
- [CrossRef] [Google Scholar]
- Characterization of Microwave and Conventional Heating on the Pyrolysis of Pistachio Shells for the Adsorption of Methylene Blue and Iodine. Anal. Lett.. 2018;51(14):2205-2220.
- [CrossRef] [Google Scholar]
- Sugarcane bagasse based activated carbon preparation and its adsorption efficacy on removal of BOD and COD from textile effluents: RSM based modeling, optimization and kinetic aspects. Bioresour. Technol. Rep.. 2021;14:100664
- [CrossRef] [Google Scholar]
- Fixed-bed adsorption of Reactive Orange 84 dye onto activated carbon prepared from empty cotton flower agro-waste. Sustainable Environ. Res.. 2018;28(6):298-308.
- [CrossRef] [Google Scholar]
- Preparation and characterization of banana trunk activated carbon using H3PO4 activation: A rotatable central composite design approach. Mater. Chem. Phys.. 2022;282:125989
- [CrossRef] [Google Scholar]
- FAOSTAT (2022). FAO. https://www.fao.org/faostat/en/#data/QCL/visualize.
- Mesoporous activated carbon from wood sawdust by K2CO3 activation using microwave heating. Bioresour. Technol.. 2012;111:425-432.
- [CrossRef] [Google Scholar]
- Insight into activated carbon from different kinds of chemical activating agents: A review. Sci. Total Environ.. 2020;746:141094
- [CrossRef] [Google Scholar]
- Preparation and characterization of activated carbon from hydrochar by hydrothermal carbonization of chickpea stem: an application in methylene blue removal by RSM optimization. Int. J. Phytorem. 2021:1-13.
- [CrossRef] [Google Scholar]
- Adsorption isotherm studies of Methylene blue using activated carbon of waste fruit peel as an adsorbent. Mater. Today: Proc. 2021
- [CrossRef] [Google Scholar]
- Review of second-order models for adsorption systems. J. Hazard. Mater.. 2006;136(3):681-689.
- [CrossRef] [Google Scholar]
- Preparation and Characterization of Activated Carbon from Microwave and Conventional Heated Almond Shells Using Phosphoric Acid Activation. Anal. Lett.. 2019;52(5):772-789.
- [CrossRef] [Google Scholar]
- Batch and continuous studies for adsorption of anionic dye onto waste tea residue: Kinetic, equilibrium, breakthrough and reusability studies. J. Clean. Prod.. 2020;252:119778
- [CrossRef] [Google Scholar]
- Preparation and characterization of activated carbon from wild olive cores (oleaster) by H3PO4 for the removal of Basic Red 46. J. Clean. Prod.. 2013;54:296-306.
- [CrossRef] [Google Scholar]
- Evaluation of the volatile compounds of fresh ripened Capsicum annuum and its spice pepper (dried red pepper flakes and isot) LWT. 2017;84:842-850.
- [CrossRef] [Google Scholar]
- Optimization of process conditions for adsorption of methylene blue on formaldehyde-modified peanut shells using box-behnken experimental design and response surface methodology. Eur. J. Technic 2020:131-142.
- [CrossRef] [Google Scholar]
- About the theory of so-called adsorption of soluble substances. K Sven Vetenskapsakad Handl.. 1898;24:1-39.
- [Google Scholar]
- Facile synthesis of low-cost magnetic biosorbent from peach gum polysaccharide for selective and efficient removal of cationic dyes. Int. J. Biol. Macromol.. 2018;107:1871-1878.
- [CrossRef] [Google Scholar]
- Banana stem based activated carbon as a low-cost adsorbent for methylene blue removal: Isotherm, kinetics, and reusability. Alex. Eng. J.. 2022;61(3):1946-1955.
- [CrossRef] [Google Scholar]
- Adsorption of benzene and toluene onto KOH activated coconut shell-based carbon treated with NH3. Int. Biodeter. Biodegr.. 2015;102:245-255.
- [CrossRef] [Google Scholar]
- Chitosan, starch, polyaniline and polypyrrole biocomposite with sugarcane bagasse for the efficient removal of Acid Black dye. Int. J. Biol. Macromol.. 2020;147:439-452.
- [CrossRef] [Google Scholar]
- Removal of tartrazine from aqueous solutions using adsorbents based on activated carbon and Moringa oleifera seeds. J. Clean. Prod.. 2018;171:85-97.
- [CrossRef] [Google Scholar]
- Efficient Removal of Anionic and Cationic Dyes from an Aqueous Solution Using Pullulan-graft-Polyacrylamide Porous Hydrogel. Water Air Soil Pollut.. 2014;225(11):2177.
- [CrossRef] [Google Scholar]
- Fabrication of magnetic activated carbon by carbothermal functionalization of agriculture waste via microwave-assisted technique for cationic dye adsorption. Adv. Powder Technol.. 2020;31(10):4301-4309.
- [CrossRef] [Google Scholar]
- Adsorption studies of packed bed column for the removal of dyes using amine functionalized radiation induced grafted fiber. SN Appl. Sci.. 2019;1(2):175.
- [CrossRef] [Google Scholar]
- Preparation and Characterization of Activated Carbon from Sesame Seed Shells by Microwave and Conventional Heating with Zinc Chloride Activation. Anal. Lett.. 2018;51(17):2733-2746.
- [CrossRef] [Google Scholar]
- Clean and new strategy for catalytic conversion of agriculture waste shells to activated carbon via microwave-assisted impregnation: Applied and eco-friendly aspect for decoloration of industrial corn syrup and process identifications. J. Environ. Chem. Eng.. 2019;7(3):103161
- [CrossRef] [Google Scholar]
- Effects of first-row transition metals and impregnation ratios on the physicochemical properties of microwave-assisted activated carbons from wood biomass. J. Colloid Interface Sci.. 2017;486:163-175.
- [CrossRef] [Google Scholar]
- Adsorption of methylene blue on activated carbon produced from flamboyant pods (Delonix regia): Study of adsorption isotherms and kinetic models. Chem. Eng. J.. 2011;168(2):722-730.
- [CrossRef] [Google Scholar]
- Kinetics of Adsorption on Carbon from Solution. J. Sanit. Eng. Div.. 1963;89(2):31-59.
- [CrossRef] [Google Scholar]
- Characteristics of Elovich equation used for the analysis of adsorption kinetics in dye-chitosan systems. Chem. Eng. J.. 2009;150(2–3):366-373.
- [CrossRef] [Google Scholar]
- Preparation and characterization of activated carbon from reedy grass leaves by chemical activation with H 3 PO 4. Appl. Surf. Sci.. 2014;320:674-680.
- [CrossRef] [Google Scholar]
- Synthesis and characterization of magnetic ZnCl2-activated carbon produced from coconut shell for the adsorption of methylene blue. J. Mol. Struct.. 2021;1232:130071
- [CrossRef] [Google Scholar]
- Activated carbon adsorbents with micro-mesoporous structure derived from waste biomass by stepwise activation for toluene removal from air. J. Environ. Chem. Eng.. 2021;9(4):105387
- [CrossRef] [Google Scholar]
- Recent advances for dyes removal using novel adsorbents: A review. Environ. Pollut.. 2019;252:352-365.
- [CrossRef] [Google Scholar]


