

Translate this page into:
Accuracy assessment of RFerns, NB, SVM, and kNN machine learning classifiers in aquaculture
⁎Corresponding author at: Akdeniz University, Elmalı Vocational School of Higher Education, Antalya, Türkiye. mukerremoralaku@outlook.com (Mükerrem Atalay Oral)
-
Received: ,
Accepted: ,
This article was originally published by Elsevier and was migrated to Scientific Scholar after the change of Publisher.
Peer review under responsibility of King Saud University.
Abstract
Background
Fish diseases are the primary cause of decreased productivity and financial losses in fish farms. Detecting and monitoring fish disease using human eye is a time-consuming manual process. Technological advancements have made possible that data may now be collected at unprecedented speeds, quantities, and complexity, with far less effort and expense. Species must be provided optimum environmental conditions for healthy production. However, sub-optimal conditions and managerial issues could lead to disease outbreaks in fish farms. Machine learning (ML) classifiers can provide solutions to fish farm difficulties by collecting data with less efforts.
Methods
This study investigated water physico-chemical parameters potentially responsible for bacterial disease outbreak in fish farms. Four most popular ML algorithms, i.e., support vector machine (SVM), naïve bayes (NB), random ferns (RFerns), and K-nearest neighbor (kNN) were used to detect the physico-chemical parameters of water causing the disease. Data were collected from 3 different farms in two-month periods for 1 year. Models were developed by using 10-fold cross validation procedure to the training dataset data for each model. The models were examined using seven distinct metrics throughout the training and testing phases.
Results
The SVM and RFerns classifiers produced accurate results (100% for both) during the testing phase, while kNN and NB classifiers achieved lower accuracy (91.3% accuracy for both).
Conclusion
The SVM and RFerns algorithms performed better than kNN and NB algorithms in both the training and testing phases of the study. Although earlier research confirms the efficacy of the SVM algorithm in aquaculture, comparable efficacy of RFerns with SVM has been reported in this sector for the first time, which is a significant addition to the literature.
Keywords
Aquaculture
Machine Learning
RFerns
NB
SVM
kNN

1 Introduction
There has been a rise in the global market for pan-sized fish (Pridgeon & Klesius, 2012). The culture conditions must be of a quality that completely satisfies the requirements of the species being produced for healthy production. The sub-optimal culture conditions and managing problems (such as excessive stock density, insufficient water flow rate, feeding problems), lead to disease outbreak in fish cultures (Hansen & Olafsen 1999; Verschuere et al., 2000; Winton, 2001). Serious issues arise throughout the production season, particularly when the water temperature rises (Pridgeon & Klesius, 2012). Nevertheless, water temperature is not the only factor to consider. All factors (such as bacterial presence in the environment, physico-chemical characteristics of the water, feed quality and feeding, stock density) should be considered when determining the reasons for the presence of diseases in the breeding environment.
Machine learning (ML) can address several challenges encountered by different sectors. The ML algorithms may accurately anticipate outcomes or categorize data by gathering and analyzing massive volumes of information (Samuel, 2000; Liakos et al., 2018). Water quality, fish behavior, and physical symptoms are used by ML to diagnose diseases and forecast disease outbreaks. This may aid farmers in taking preventative or curative actions to improve fish health and decrease financial losses. Efficiency in aquaculture output has been made possible by recent advancements in computer-based intelligent technology. Therefore, the goals of creating a sustainable aquaculture system are achieved (Avnimelech, 2009). Diseases have been diagnosed using an image-based machine learning classifier in the aquaculture (Ahmed et al., 2022). Furthermore, ML classifiers have been used successfully in studies such as disease resistance estimation (Bargelloni et al., 2021), shrimp disease prediction (Quach et al., 2020), disease outbreak prediction in trout farms (Yilmaz et al., 2022), shrimp growth prediction, intelligent feeding technique (Chen et al., 2022), classification of shrimp diseases (Duong-Trung et al., 2020), sex identification (Barulin, 2019) and weight estimation (Fernandes et al., 2020).
We have predicted disease outbreak with multinomial logistic regression (MLR) in trout farms in an earlier study (Yilmaz et al., 2022). Afterwards, we realized the necessity of employing untested ML techniques in aquaculture to predict disease outbreak. In this study, the effects of physico-chemical factors that have the potential to affect the pathogenic bacteria, i.e., Acinetobacter sp., Aeromonas hydrophila, Aeromonas sobria, Lactococcus garvieae, Vibrio anguillarum and Yersinia ruckeri on the disease-causing status were investigated. For this purpose, models were created by using the most popular 4 ML classifiers of the last period. Models made using the R programming environment, which has open-source software and libraries, were evaluated with various metrics. The physico-chemical measurement data of the waters at the entrance, fishpond and outlet of the fish farms were examined in the classification of the trout infected with the bacteria group and non-infected. The models of the obtained data were created with four ML classifiers, i.e., support vector machine (SVM), naïve bayes (NB), random ferns (RFerns), and K-nearest neighbor (kNN). Seven different metrics were used to evaluate the models used for multiclass classification. The accuracy of these algorithms was tested in detecting disease outbreak. It was hypothesized that the algorithms will differ in their efficacy during training and testing phases. It was further hypothesized that the untested algorithms would have comparable efficacies with the earlier tested ones.
2 Material and methods
2.1 Data collection
Samples were taken from 3 different farms bimonthly for 1 year during 2018–2019. Ten fish were sampled during each sampling from every farm. Moribund individuals with typical signs of disease (such as swimming slowly and separate from the herd, darkened in color, lesions on the body, problems in the eyes) were taken. Disease-causing bacteria from these fish were isolated and diagnosed. During the samplings, the physico-chemical parameters of the water [water temperature (T), pH, total dissolved solids (TDS), dissolved oxygen (DO) and saturation (Sat)] were measured from the farm entrance, fishpond, and outlet of the farm with the help of YSI brand multi parameter sensor. The pathogenic bacteria were isolated and identified during laboratory examinations of the sampled fish and their group numbers are listed in Table 1.
Sampling time
Detected Bacteria
Group No
October
Acinetobacter sp, Aeromonas hydrophila, Lactococcus garvieae
5
December
Aeromonas sobria, Lactococcus garvieae, Yersinia ruckeri
4
February
Lactococcus garvieae, Vibrio anguillarum
3
April
Not Detected
1
June
Acinetobacter sp, Lactococcus garvieae
2
August
Acinetobacter sp, Aeromonas sobria, Lactococcus garvieae
6
No bacteria were detected in the specimens collected during April (Table 1). This undetected disease situation was designated as group number 1 since it was a reference for classifiers.
2.2 Machine learning classifiers
There are two categories of ML classifiers. There are two types of learning, supervised and unsupervised. Instead of utilizing unlabeled data, as in unsupervised learning, supervised learning uses labeled data to produce predictions or classifications for new data (Kumar et al., 2020). Supervised learning may be used for tasks like as regression, classification, and grouping. If there are exactly two classes, the procedure is termed binary classification; if there are more than two, it is called multiple classifications (Prabhakaran, 2016). Support vector machine (SVM), naive bayes (NB), and K-nearest neighbor (kNN) are the three most used supervised learning classification methods (Binkhonain and Zhao, 2019). As fish are afflicted with bacterial groups and suggest six distinct classes depending to their health, several classification approaches have been developed to tackle this issue. The kNN, NB, RFerns, and SVM classification models were used in this investigation.
The kNN (Altman, 1992) is a controlled ML algorithm that can be used for both classification and regression purposes. It is an algorithm that attempts to classify new samples along with similar ones. The working principle of this method is the assignment of data that is new in a previously created sample set to the cluster that has the closest (k) distance to it. The distance between these two data can be determined using distance functions such as the Euclidean distance, Euclidean, Manhattan, and Minkowski distance. The kNN formula can be seen in Eq. (1).
A statistical classification technique employing the similarity attribute is the NB classifier (Rish, 2001). It is favored in many disciplines for categorization difficulties despite being straightforward. Bayes' theorem is used to express the NB classifier (Berrar, 2018). The NB classification is based on Bayes' theorem where
is a discrete variable that represents one of the j classes. The X property is expressed by the
feature vector, which consists of m properties. The probability of the probability
according to the Bayes theorem for the possible value
is specified in Eq. (2).
When the prediction of the target class Y' is calculated by multiplying the conditional probabilities for all properties, the basic equation in equation (3) for NB classifier is formed (Deng et al., 2015; Arpacı & Kalıpsız, 2018).
In the NB classifier used for the estimation of the target class
, the equation (3) can be simplified as in equation (4), since the denominator is not dependent on a single class and the denominator is jointly involved in the process in all calculations (Deng et al., 2015; Arpacı & Kalıpsız, 2018).
According to Equality 5, the total number of educational qualifications on the class label is |N|,the number of educational qualifications in class
is
. After applying Equality 4 for each class and calculating the probabilities, the class with the greatest probability in the resulting values is selected as the target class (Deng et al., 2015; Arpacı & Kalıpsız, 2018). The RFerns is a machine learning technique was proposed by Özuysal et al. (2007) for matching similar parts between two photos of the same scene, enabling one to identify specific items or trace them on movies. Although it was originally used for image processing, a number of modifications have been made that allow the use of the RFerns algorithm in general ML problems and an R package has been developed by De Leeuw (2009). The efficacy of RFerns is based on the idea that, when the tests are chosen at random, the approach's power stems more from the fact that mixing groups of binary tests allows for greater classification rates than the tree structure itself. So, in the proposed d-RFs, each layer's neuron is replaced by a fern, and each layer is composed of several fern species. Let us assume that the value of features
is the outcome (0 or 1) of a simple binary test, I (
< I (
, depending only on the intensities of two pixel locations (
and (
(Eq. (6) of the input image I (Kim & Ko, 2020).
Given the class label Ck, NB makes the simplifying assumption that features are conditionally independent. The class of conditional densities (fi|Ck) is typically simple to learn, but this independence assumption is typically untrue, and the resultant approximation frequently substantially underestimates the real posterior probability. Therefore, Özuysal et al. (2007) organized the features into groups made up of L small sets of size S to to make the problem manageable while taking these dependencies into account. These collections are known as ferns
. By assuming that the groups are conditionally independent, a technique known as semi-NB may be used to calculate the joint probability for the characteristics in each fern (Eq. (7)).
We acquire the class-conditional distributions for each of the ferns from Eq. (7), and we use the Bayes rule to combine their outputs using semi-naive Bayes to generate the posterior distribution.
Each fern in testing is made up of a few binary tests and returns a probability for the input vector, which is a member of one of the classes that was discovered during learning. The semi-naive Bayes model is used to integrate these fern replies, and the class with the highest probability value is then selected (Eq. (8)) (Kim and Ko, 2020).
A well-liked and flexible supervised machine learning technique, i.e., SVM may be used to both regression and classification. The foundations of SVM were laid by Vapnik (1995). The SVM has been employed in a variety of applications since it has numerous trustworthy learning qualities and predicts positive trial outcomes (Kulkarni et al., 2004; Chen & Wang, 2007). The SVM is generally preferred for small and medium-sized classification problems. In N-dimensional space, the SVM essentially discovers a hyperplane that clearly divides data points from different classes. A hyperplane is a plane that separates two parts of n-dimensional data linearly. A line in two dimensions and a plane in three dimensions are called hyperplanes. Theoretical support for the SVM algorithm is provided below (Equation (9).
the n-dimensional characteristic vectors in the real number field
and
,
and ,
. When the analyzed data set is expressed with a linear relationship, can be used the linear Eqs. (10) and (11).
3 Results and discussion
The data obtained from the measurements according to the physico-chemical parameters of the water consists of 90 separate observations. While 75% of this data is reserved for the training dataset, the remaining 25% is reserved for the testing dataset. Models were created by applying the 10-fold cross validation technique for each model to the data allocated for the training dataset. During the Training and Testing stages, the models were evaluated in detail with a total of seven different metrics.
3.1 Training success of models
Two different metrics, i.e., accuracy and Kappa were used for the training success of the models. The minimum, first quartile, median, mean, third quartile and maximum values of the results obtained for both accuracy and Kappa metrics of the models evaluated with the cross-validation technique are given in Table 2. When evaluating the Mean value of Accuracy and Kappa metrics, the most successful models are RFerns and SVM classifiers. It is seen that the worst classifier model is NB. The graph showing the training achievements of the models comparatively is shown in Fig. 1. SVM = support vector machine, NB = naïve bayes, RFerns = random ferns, and kNN = K-nearest neighbor, Min = minimum, 1st Qu. = first quartile, 3rd Qu. = third quartile, Max. = maximum.
Algorithms
Accuracy
Min.
1st Qu.
Median
Mean
3rd Qu.
Max.
SVM
0.76
0.92
0.92
0.93
1
1
NB
0.69
0.84
0.88
0.88
0.92
1
RFerns
0.76
0.92
0.92
0.93
1
1
kNN
0.71
0.85
0.92
0.91
1
1
Kappa
Min.
1st Qu.
Median
Mean
3rd Qu.
Max.
SVM
0.71
0.90
0.91
0.92
1
1
NB
0.61
0.81
0.86
0.85
0.91
1
RFerns
0.71
0.90
0.91
0.92
1
1
kNN
0.65
0.82
0.90
0.89
1
1
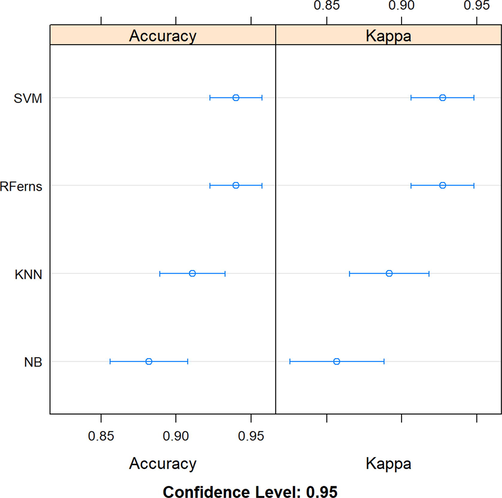
Models’ comparison graph based on accuracy and Kappa metrics.
3.2 Testing success of models
The models were tested with the testing dataset, which was never seen in the training phase. Confusion matrix tables obtained from the tests of the models with the testing dataset and the evaluation results obtained with various metrics are included. The same confusion matrix was obtained for SVM and RFerns classifiers and is shown in Table 3.
Actual
1
2
3
4
5
6
Prediction
1
5
0
0
0
0
0
2
0
2
0
0
0
0
3
0
0
6
0
0
0
4
0
0
0
5
0
0
5
0
0
0
0
0
0
6
0
0
0
0
0
5
As seen in the confusion matrix (Table 3), all 5 observations belonging to class 1 were correctly classified. Similarly, 2 observations belonging to class 2, 6 observations belonging to class 3, 5 observations belonging to class 4 and 5 observations belonging to class 6 were successfully predicted in the accurate classes. Accuracy value of SVM and RFerns classifiers was 100%, Kappa value of 100% and p-value was 3.78E-14, which is very close to zero. In addition to these metrics, evaluations of other metrics are given in Table 4.
Evaluation matrices
Classes
1
2
3
4
5
6
Sensitivity
1
1
1
1
NA
1
Specificity
1
1
1
1
1
1
Positive predictive value (PPV)
1
1
1
1
NA
1
Negative predictive value (NPV)
1
1
1
1
NA
1
Balanced accuracy (BA)
1
1
1
1
NA
1
For good classifiers, accuracy, Kappa, sensitivity, specificity, positive predictive value (PPV), negative predictive value (NPV), and balanced accuracy (B) metrics should be close to 1 (Cakir et al., 2021). These related assessment metrics were equal to 1 for all classes. This shows that the SVM and RFerns models tested with the test data were quite successful. Confusion matrix table of NB and kNN classifiers is shown in Table 5.
Actual
1
2
3
4
5
6
Prediction
1
5
0
0
0
0
0
2
0
2
0
0
0
0
3
0
0
6
0
0
0
4
0
0
0
4
0
0
5
0
0
0
1
0
1
6
0
0
0
0
0
4
As seen in the confusion matrix in Table 4, all 5 observations belonging to class 1 were correctly classified. Similarly, 2 observations belonging to class 2, 6 observations belonging to class 3, 4 out of 5 observations belonging to class 4 and 4 out of 5 observations belonging to class 6 were successfully predicted in their relevant classes. However, it is seen that the models predicted 1 observation in class 5, which is in class 4, and 1 observation in class 5, which is in class 6. Accuracy value of NB and kNN classifiers was obtained 91.3%, Kappa value is 89.15% and p-value is 7.93E-11, which is very close to zero. In addition to these metrics, evaluations of other metrics are given in Table 6.
Evaluation matrices
Classes
1
2
3
4
5
6
Sensitivity
1
1
1
0.8
NA
0.8
Specificity
1
1
1
1
0.9
1
Positive predictive value (PPV)
1
1
1
1
NA
1
Negative predictive value (NPV)
1
1
1
0.9
NA
0.9
Balanced accuracy (BA)
1
1
1
0.9
NA
0.9
The sensitivity metric measures how many of all positive observations we classify as positive. The sensitivity values for class 4 and 6 were 0.8. This indicates that the NB and kNN models were in fact 20% incorrectly estimated that the group of bacteria in class 4 (Aeromonas sobria, Lactococcus garvieae, Yersinia ruckeri) was the group of bacteria in class 5 (Acinetobacter sp, Aeromonas hydrophila, Lactococcus garvieae). Similarly, the NB and kNN models show that the group of bacteria in class 6 (Acinetobacter sp, Aeromonas sobria, Lactococcus garvieae) is incorrectly estimated by 20% as the group of bacteria incClass 5 (Acinetobacter sp, Aeromonas hydrophila, Lactococcus garvieae). For class 4 and 6, the BA metric calculates the arithmetic mean of the sensitivity and specificity metrics of the relevant classes (arithmetic mean of 0.8 and 1) and gives the value 0.9. Other assessments may be considered successful because their metric value is > 90%. These related assessment metrics do not appear to equal 1 for all classes. This shows that the NB and kNN models tested with the test data were good but more unsuccessful compared to the SVM and RFerns. The SVM and RFerns ML algorithms achieved more accurate results (100% for both) during the testing phase, while kNN and NB algorithms achieved less accurate results (91.3% accuracy for both).
According to literature search, no study was found related to RFerns in aquaculture applications. In a reported study, the effects of water quality on livestock performance in freshwater ponds was studied with 8 different ML techniques. Among them 3 ML techniques (SVM, NB and kNN) were analogous with ours. In that study, SVM and NB were successfully applied with 80–83% accuracy but kNN was insufficient (71–82 %) (Rana et al., 2021). We obtained the compatible result with SVM. Furthermore, the consistent results were reported in the other studies with SVM (Chen et al., 2022; Fan and Liu, 2013; Saberioon et al., 2018; Costa et al., 2019). The SVM was adopted in recirculating aquaculture system with the 98.95% accuracy for optimal variable-flow regulation (Chen et al., 2022). Besides, Fan & Liu (2013) achieved automate fry counting with the 98.73% of the average counting accuracy rate by SVM. In a reported study (Saberioon et al., 2018) fish diets were evaluated by ML methods. While the SVM provided the best classifier with correct classification rate of 82%, the k-NN was the least (40%). Moreover, SVM obtained the best result with 97.19% correct oocyte recognition against kNN (94.40%) and NB (90.03%) (Costa et al., 2019). It can be concluded that SVM has the great potential to be an effectively viable technique in aquaculture applications.
4 Conclusion
In the current study, SVM and RFerns ML algorithms achieved better results in terms of model success in both the training and testing phase, while the kNN and NB algorithms obtained results with lower success. While the success of the SVM algorithm in aquaculture is supported by previous studies, the fact that the RFerns algorithm shows the same success as SVM and is applied to this field for the first time is also valuable in terms of contribution to the literature. Computer-aided intelligent production systems can help predict possible cases and develop precautionary recommendations by following all variables instantly. These algorithms obtained in the computer environment need to be tested quickly in the real farm environment. Successful results will pave the way for sustainable farming by reducing the giant loss of the aquaculture sector, while more product supply will ensure the effective use of resources.
Acknowledgements
The study was financially supported by the Scientific Research Projects Coordination Unit of Akdeniz University (grant number FBA-2018-3797).
Ethical statement
The procedures applied in this study were evaluated by the Akdeniz University Animal Experiments Local Ethics Committee and their ethical compliance was approved with the protocol number 2018.03.001.
Declaration of Competing Interest
The authors declare that they have no known competing financial interests or personal relationships that could have appeared to influence the work reported in this paper.
References
- Fish disease detection using image based machine learning technique in aquaculture. J. King Saud Univ.-Computer Information Sci.. 2022;34(8):5170-5182.
- [Google Scholar]
- An introduction to kernel and nearest-neighbor nonparametric regression. Am. Stat.. 1992;46(3):175-185.
- [CrossRef] [Google Scholar]
- Yazılım hata sınıflandırmasında farklı naive bayes tekniklerin kıyaslanması. Niğde Ömer Halisdemir Üniversitesi Mühendislik Bilimleri Dergisi. 2018;7(1):1-13.
- [Google Scholar]
- Biofloc Technology: A Practical Guide Book. Baton Rouge: The World Aquaculture Society; 2009. p. :182.
- Data imputation and machine learning improve association analysis and genomic prediction for resistance to fish photobacteriosis in the gilthead sea bream. Aquacult. Rep.. 2021;20:100661.
- [Google Scholar]
- Using machine learning algorithms to analyse the scute structure and sex identification of sterlet Acipenser ruthenus (Acipenseridae) Aquac. Res.. 2019;50(10):2810-2825.
- [Google Scholar]
- A review of machine learning algorithms for identification and classification of non-functional requirements. Expert Syst. Applications: X. 2019;1:100001.
- [Google Scholar]
- The Experimental Application of Popular Machine Learning Algorithms on Predictive Maintenance and the Design of IIoT based Condition Monitoring System. Comput. Ind. Eng.. 2021;151:106948.
- [Google Scholar]
- Intelligent feeding technique based on predicting shrimp growth in recirculating aquaculture system. Aquac. Res.. 2022;53(12):4401-4413.
- [Google Scholar]
- A hybrid SARIMA and support vector machines in forecasting the production values of the machinery industry in Taiwan. Expert Syst. Appl.. 2007;32(1):254-264.
- [Google Scholar]
- A computer vision system for oocyte counting using images captured by smartphone. Aquacultural Eng.. 2019;87:102017.
- [Google Scholar]
- Journal of statistical software. Wiley Interdiscip. Rev. Comput. Stat.. 2009;1(1):128-129.
- [CrossRef] [Google Scholar]
- Probabilistic Models for Classification. In: Aggarwal C.C., ed. Data Classification Algorithms and Applications. New York, USA: CRC Press; 2015. p. :67-70.
- [Google Scholar]
- Towards classification of shrimp diseases using transferred convolutional neural networks. Adv. Sci. Technol. Eng. Syst.. 2020;5(4):724-732.
- [Google Scholar]
- Automate fry counting using computer vision and multi-class least squares support vector machine. Aquaculture. 2013;380:91-98.
- [Google Scholar]
- Deep learning image segmentation for extraction of fish body measurements and prediction of body weight and carcass traits in Nile tilapia. Comput. Electron. Agric.. 2020;170:105274.
- [Google Scholar]
- Bacterial interactions in early life stages of marine cold water fish. Microb. Ecol.. 1999;38(1):1-26.
- [Google Scholar]
- Parameter estimation of BLDC motors by SVM for UAV propulsion systems. Erzincan Univ. J. Sci. Technol.. 2022;15(2):406-419.
- [Google Scholar]
- Support vector classification with parameter tuning assisted by agent-based technique. Comput. Chem. Eng.. 2004;28(3):311-318.
- [Google Scholar]
- Mathematics for machine learning. J. Math. Sci. Comput. Math.. 2020;1(2):229-238.
- [CrossRef] [Google Scholar]
- Özuysal, M., Fua, P., Lepetit, V., 2007. Fast keypoint recognition in ten lines of code. In: Proceedings of the IEEE Computer Society Conference on Computer Vision and Pattern Recognition, 1-8, Doi: 10.1109/CVPR.2007.383123.
- Prabhakaran, S., 2016. Performance Analysis and Companion Functions for Binary Classification Models, pp. 1-22. Retrieved from http://r-statistics.co/Information-Value-With-R.html#3.4.IV.
- Major bacterial diseases in aquaculture and their vaccine development. CABI Rev.. 2012;7(048):1-16.
- [Google Scholar]
- Towards machine learning approaches to identify shrimp diseases based on description. Kỷ yếu Hội nghị KHCN Quốc gia lần thứ XII về Nghiên cứu cơ bản và ứng dụng Công nghệ thông tin (FAIR); Huế, ngày 2020:494-501.
- [Google Scholar]
- Machine learning approach to investigate the influence of water quality on aquatic livestock in freshwater ponds. Biosyst. Eng.. 2021;208:164-175.
- [Google Scholar]
- Rish, I., 2001. An empirical study of the Naive Bayes classifier. In: IJCAI 2001 Workshop on Empirical Methods in Artificial Intelligence. Vol. 3(22), pp. 41-46. Doi: 10.1039/b104835j.
- Comparative performance analysis of support vector machine, random forest, logistic regression and k-nearest neighbours in rainbow trout (oncorhynchus mykiss) classification using image-based features. Sensors. 2018;18(4):1027.
- [Google Scholar]
- Some studies in machine learning using the game of checkers. IBM J. Res. Dev.. 2000;44(1.2):206-226.
- [Google Scholar]
- The nature of statistical learning theory. New York: Springer; 1995.
- Probiotic bacteria as biological control agents in aquaculture. Microbiol. Mol. Biol. Rev.. 2000;64(4):655-671.
- [Google Scholar]
- Fish health management. In: Wedemeyer G., ed. Fish Hatchery Management (2nd ed.). Bethesda, MD: American Fisheries Society; 2001. p. :559-639.
- [Google Scholar]
- Using machine learning technique for disease outbreak prediction in rainbow trout (Oncorhynchus mykiss) farms. Aquaculture Res.. 2022;53(18):6721-6732.
- [Google Scholar]


