

Translate this page into:
A new framework for the sustainable development goals of Saudi Arabia
⁎Corresponding author. bsbiswajitsarkar@gmail.com (Biswajit Sarkar)
-
Received: ,
Accepted: ,
This article was originally published by Elsevier and was migrated to Scientific Scholar after the change of Publisher.
Abstract
Achieving sustainable development goals agenda 2030 is the aspiration of all the United Nation’s member countries. Countries have an uneven distribution of natural resources, economic strength, and capacity building. Many studies analyze these goals using various models and considering different aspects of the kingdom of Saudi Arabia's (KSA) economy. However, none of the studies modelled the key indicators mathematically to quantify the achievement level towards vision 2030; hence aims to bridge the existing literature gap In this paper, the sustainable development goals (SDGs) of KSA are considered, a mathematical model is formulated in light of fuzzy and weighted goal programming using membership function. The model comprises three goals related to the gross domestic product, sustainable energy consumption and employment capacity of the economy's contributing sectors. The analytic hierarchy process integrated to compute the goals’ weights using row geometric mean method. The study established the goals's satisfaction level with 57% overall achievement of the vision 2030. Individually, economic growth goal is 45% achievable. The clean energy consumption-related goal is 67% realizable. The employment-related goal is 78% attainable within the time frame of the vision 2030. The study suggests that KSA diversify its energy sector by concentrating and investing more resources in alternative energy sources, including renewable energy such as solar, wind, biomass, and nuclear energy. Also, there is a need to involve more vibrant and talented youths in the critical decision-making process. The model is simple and can be replicable in a similar country with slight modifications.
Keywords
Sustainable development goals
Optimization
Fuzzy programming
Weighted goal programming
Analytic hierarchy process

1 Introduction
Saudi Arabia is among the top twenty in the world economically, and it comprises of fourteen regions with a population of over thirty-four million people (GAStat, 2019). The regions include Al-Riyadh; Makkah Al-Mokarramah; Al-Madinah AlMonawarah; Al-Qaseem; Eastern region; Aseer region; Tabouk region; Ha’il region; Northern Borders; Jazan region; Najran region; Al-Baha region; and Al-Jouf region. Historically, its economy’s progress heavenly relies on oil’s high revenues. The revenues decreased during low oil prices globally due to any economic meltdown, outbreak, or pandemic diseases such as COVID-19, among others. This problem can be augmented through energy diversification by investment in renewable energy sources (RES) and nuclear. The country has the largest crude oil production capacity- about 12 million barrels per day, and holding the world’s 16 per cent proved oil reserves ranking second after Venezuela (EIA, 2017).
The country’s gross domestic product (GDP) is 769,681 million Saudi Arabian Riyal (SAR). The GDP per capita is 22,292 SAR, with gross savings to GDP of 3.1 per cent during the last quarter of 2019 (SAMA, 2020). The KSA economy depends highly on energy consumption, leading to high carbon emissions. Ensuring a greener environment requires technological innovation to reduce greenhouse gases (GHGs) such as . Saudi Arabia has many programs under the auspices of vision 2030 in realizing the sustainable development goals (SDGs) set by the United Nations (UN). Therefore, it will be interesting for the decision-makers to know how much the SDGs target achievable at the end of the year 2030. Hence, this motivated the research work.
The remaining paper is organized as follows: Section 2 reviews the literature and established the research gap. Section 3 review the socio-economic study of KSA. In Section 4, the sustainable development goals are presented. In Section 5, the SDGs model formulation are discussed, while Section 6 presents and discusses the solution methodologies. 7 analyzes and discusses the results. Section 8 concludes the study.
2 Literature review and research gap
Over the years, research has been ongoing in the field of economic sustainability and development of the KSA. The effect of agricultural share and energy consumptions on the emissions of per capita for KSA had been analyzed (Mahmood et al., 2019). The efficiency of energy consumption and their economic, cultural, technical, and institutional barriers for KSA had been studied (Alyousef and Abu-Ebid, 2012). The study analyzed scenarios and recommended policies and regulations for optimal energy mix and efficient supply to meet customer demand. A structural time series analysis was conducted for forty-two years from 1971 to 2013 in assessing the environmental quality of KSA relating to the total consumption of oil and carbon emission in the transportation sector of the economy (Alkhathlan and Javid, 2015).
Current energy conservation programs were highlighted, and significant policies and strategies to the achievement were proposed (Al-Ajlan et al., 2006). The effects of its growth are estimated; decomposition methods were then used to analyze the exogenous factors in mitigating such growth (Alarenan et al., 2020). In KSA, the power sector was examined in the direction of future attaintment for load balance target and control of consumptions (Al and Csala, 2019). They established the relationship amongst the consumption, peak load, and generation capacity in the long-run electricity demand growth.
The multivariate approach was used in investigating the causal relationships amongst energy consumption, price, carbon emissions, and economic growth in KSA (Alshehry and Belloumi, 2015). The GDP growth under vision 2030 of the KSA was estimated by multiple regression and principal component analysis using knowledge-based rather than the oil-based economy (Amirat and Zaidi, 2019). The sustainability and RES for the KSA have been intensively reviewed according to its vision in 2030 and documented (Amran et al., 2020). The research found that solar energy has potentials technological advancement in generating electricity to satisfy the KSA teaming population’s future demand. Similar research regarding economic growth, carbon emissions, and energy efficiency in KSA are found in (Howarth et al., 2017; Rahman et al., 2017).
Many authors study mathematical modelling approaches for the SDGs agendas 2030 regarding different countries in the literature. Sarkar and Sarkar (2020) and Habib et al. (2020) discussed about sustainable production systems and biodiesel, respectively. Some of them used goal programming (GP) with satisfaction (Ali et al., 2021; Nechi et al., 2019). Others integrated fuzzy goal programming (FGP), weighted GP (Nomani et al., 2017; Jayaraman et al., 2017), while others employed fuzzy logic, simulation models, multi-criteria approaches, interactive structural modelling (Jayaraman et al., 2015).
2.1 Research gap
Over the years, research on the economic growth and development of KSA had been ongoing. Recently, energy efficiency and its associated challenges have been studied and documented (Mezghani and Haddad, 2017; Alarenan et al., 2020). Most of the research carried out considered either energy efficiency or carbon emission of the country and did not quantify whether the SDGs agendas 2030 will be achieved or not as well as the achievement level. However, this research proposes a nobel concept of mathematical modelling incorporating multi-objective optimization to investigate KSA vision 2030 SDGs’ attainment. The concept and the results obtained are different from the existing literature.
3 An Overview on Employment, Energy, GHGs and GDP
This section briefly describes some economic sectors of KSA like employment, energy efficiency, GDP, GHGs emissions, and electricity consumption.
3.1 Employment
The total economic dependency ratio of KSA is 125 per 100 people. Table 1 indicates that 64.82% male citizens of the age group fifteen and above engaged in the labour market. Simultaneously, their female counterpart has only 35.18% engaged in services, given the total number of employment to 3,170,272 during the last quarter of 2019. The percentage of males’ participation rate in the labour force is 66.6 while the female is 26, with an employment rate of 95.1 and 69.2 percent for both males and females. Alternatively, 945,387 of the same age group seek jobs in the kingdom, given rise to an unemployment rate of 2.2 percent for males and 21.3 percent for females. Riyadh has the highest employment rate, followed by Makkah and Eastern province with 40, 20, and 18 percent. In contrast, Al-Jouf has the highest unemployment rate, followed by Al-Baha and Jazan with 14.8 12.5 and 10.5 percent, respectively. The regional total employment distribution of KSA by gender and unemployment rate are presented in Table 1 and pictorially in Fig. 1a. The country’s total employment is 94.3 percent, and the unemployment rate is 5.7 percent during the fourth quarter of 2019. The employed persons work on average for 42.9 h, with monthly total average wages of 10,256 SAR (GAStat, 2019). Source: General Authority for Statistics https://www.stats.gov.sa/en/823. [Accessed on 16/06/2020].
S. No.
Regions
Males (%)
Females (%)
Total (%)
Unemployment rate (%)
1.
Al-Riyadh
25.87
14.35
40.22
4.9
2
Makkah Al-Mokarramah
12.24
7.28
19.52
5.1
3
Al-Madinah Al-Monawarah
2.20
1.43
3.63
9.4
4
Al-Qaseem
2.11
1.34
3.45
2.2
5
Eastern region
13.20
4.73
17.93
3.9
6
Aseer region
2.79
1.89
4.68
8.4
7
Tabouk region
1.04
0.70
1.70
4.4
8
Ha’il region
0.90
0.65
1.55
5.0
9
Northern Borders
0.75
0.41
1.17
4.1
10
Jazan region
1.34
1.04
2.38
10.5
11
Najran region
0.95
0.51
1.47
6.3
12
Al-Baha region
0.61
0.41
1.02
12.5
13
Al-Jouf region
0.77
0.42
1.19
14.8
14
Undefined
0.04
0.02
0.06
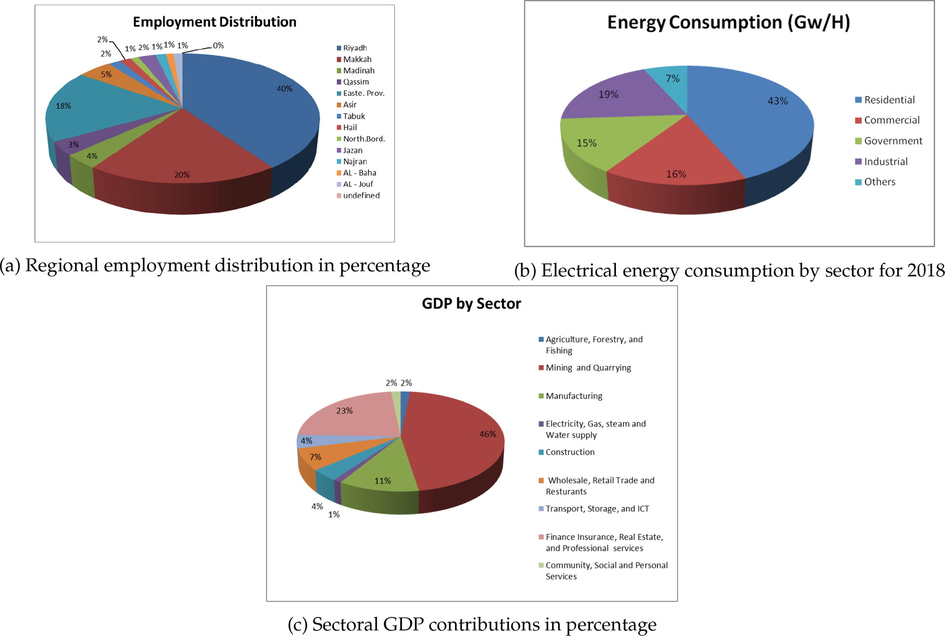
Employment distribution, energy consumption and GDP by sectors.
3.2 Energy efficiency and electricity consumption
The KSA has more than 100 major oil, gas fields, and 1,500 oil wells (Alyousef and Abu-Ebid, 2012). The country is experiencing high energy consumption per capita of 8,954.06 kilowatts per hour (KWh) with yearly consumption of 299,188 gigawatts per hour (GWh) during the year 2018 (ECRA, 2019). The consumption is categorized into four major sectors as residential (44%), commercial (16%), government (15%), and industrial (19%). The respective consumption amount is seen in Table 2 and pictorially represented in Fig. 1b. The high consumption could be due to low oil price (around SAR 1.88 per gallon), hot and arid climate around
, and lack of public awareness. Majorly, residential (cooling and domestic use), industrial sector, and desalination consume more energy. Because of hot weather, especially from April to October every year, more than seventy percent of electricity is consumed by cooling systems during this period (Mahmood et al., 2020). Source: ECRA (2019).
S. No.
Sector
Consumption (Gw/H)
Percentage (%)
1.
Residential
130,428
43.60
2
Commercial
46,849
15.70
3
Government
43,909
14.70
4
Industrial
58,177
19.45
5
Others
19,824
6.63
Total
299,188
100
3.3 Gross domestic products
The economic contribution of every sector in a given nation is known as the GDP per capita. It is measured as a ratio of the sectors’ GDP output (expressed in millions euro in 2015) by the total employees in that sector (expressed in thousands) during the commencement year of the analysis (Liuzzi et al., 2020). According to GAStat (2019), SA has nine sectors contributing to her economy (Table 3, Fig. 1c). Source: GAStat (2019). (
) = Electricity consumption for economic sector 1, 5, 7, & 8 is 201,316,387 MW.
S. No.
Economic sector
GDP at current price (2019) SR Millions
Electricity Consumption(MW)
Number of Employment(’000)
1
Agriculture Forestry & Fishing
66,411
(*)
85,240
2
Mining & Quarrying
1,909,047
14613989
184,527
3
Manufacturing
476,947
78211969.18
824,735
4
Electricity, Gas, Steam & AC Supply, Water Supply, Sewage, Waste mgt, and Remediation Activities
47,174
862866.638
108,001
5
Construction
163,655
(
)
2,252,259
6
Wholesale & Retail Trade, Repair of Motor Vehicles & Motorcycles, Restaurants & Hotels
298,009
2036559.72
2,341,121
7
Transport, Storage, Information and Communication
182,071
(
)
313,479
8
Finance Insurance, Real Estate, Professional and Administrative Services
952,222
(
)
1,316,408
9
Community, Social & Personal Services
67,626
2146228.645
959,746
3.4 Greenhouse gas emissions
The value of
per person emission in KSA was approximated to be 18.56 tons, which led her to become the 15th top emitter during 2009 (Amran et al., 2020). KSA’s current emissions are 517,079,407 tonnes of
equivalent and estimated to be 1.12 to 1.19 Gt
e by the year 2030 (Transparency, 2018). The country’s per capita
emissions in metric tons from 1960 to 2017 are depicted in Fig. 2. The country needs to emphasize the RES, such as wind, solar, geothermal energy, biomass, water, and ICT. The RES can be renewed continuously and naturally to minimize the high
emission level and invariably decrease electricity generation costs. They can replace coal, oil, and natural gas, which causes environmental safety. Carbon emission issues are addressed in several studies (Jemai et al., 2020; Yadav et al., 2021).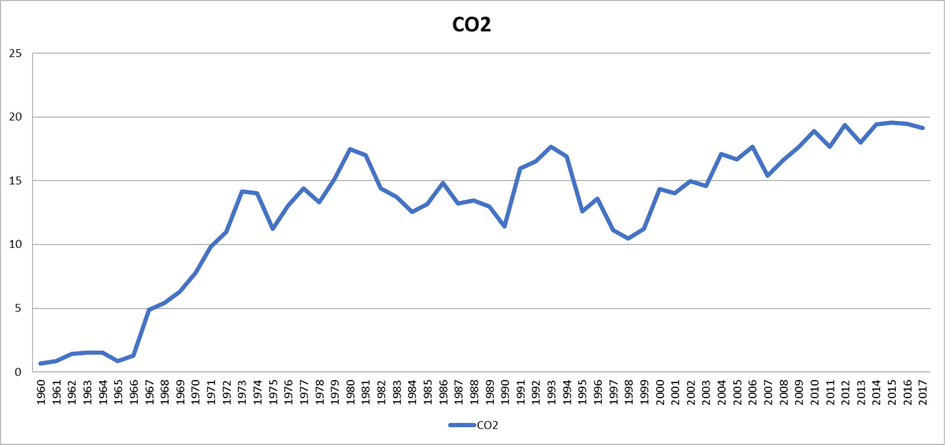
emissions (metric tons per capita) from 1960–2017.
4 Sustainable development goals
The United Nation’s (UN) general assembly in September 2015, came up with an agenda for 2030 known as SDGs. The agenda comprises 17 goals, 169 targets, and 244 indicators. According to Modibbo et al., 2021, the goals are ”end poverty in all its forms everywhere; end hunger, achieve food security and adequate nutrition for all and promote sustainable agriculture; attain healthy life for all at all ages; provide equitable and inclusive quality education and life-long learning opportunities for all; achieving gender equality, empower women and girls everywhere; secure water and sanitation for all for a sustainable world; ensure access to affordable, sustainable and reliable modern energy services for all; promote robust, inclusive and sustainable economic growth and decent work for all; promote sustainable industrialization; reduce inequality within and among countries; build inclusive, safe and sustainable cities and human settlements; promote sustainable consumption and production patterns; promote actions at all levels to address climate change; attain conservation and sustainable use of marine resources, oceans and seas; protect and restore terrestrial ecosystems and halt all biodiversity loss; achieve peaceful and inclusive societies, rule of law, competent and capable institutions; and strengthen and enhance the means of implementation and global partnership for sustainable development.”
5 SDGs model formulation
This section formulates the multi-objective problem relating to KSA’s SDGs as a general model and optimizes them accordingly.
5.1 GDP related goal
These criteria measure the economic output of every sector in a given nation globally. In a particular economic sector j, a per capita gross domestic product is defined as a ratio of its GDP output (expressed in millions SR) by total employees in that sector
expressed in thousands during the commencement year of the analysis. According to GAStat (2019), KSA has nine sectors contributing to her economy (Table 3, Fig. 1c). The GDP related goal can be expressed as goal
given by Eq. (1)
Source: aTradingEconomics (2019); bInstitute (2015); c ECRA (2019); dAl and Csala (2019); eGAStat (2019); fTransparency (2018).
S. No.
Goals
Current Value
Estimated value in the year 2030
Annual growth rate (%)
1.
Economic growth (GDP billion USD)
779.289a
800b
2.43
2
Electricity consumption
299,188 GWhc
442 TWhd
7.6d
3
Number of employment
3,170,272e
9,170,272b
88
4
Greenhouse gas emissions (GHGs)
517,079,407 tons
1.12 to 1.19 Gt
ef
4.94
5
Population
34,218,169e
39,322,336e
1.59
5.2 Electricity consumption goal
Similarly, the per capita electricity consumption (ECC) expressed in Mega Watt (goal
) for the nine contributing sectors can be computed similarly to model 1 as
5.3 Employment goal
For development enhancement, all economic sectors must ensure adequate required personnel for optimal running of the desired output sector’s functionalities. The model for KSA is given as
5.4 GHGs goals
The per capita GHG emissions (goal
) is expressed in tonnes of carbon dioxide equivalent per capita
, can be formulated as a ratio of
for sector j, expressed in thousands of tonnes by total employees in that sector in thousands (
). For the nine economic sectors of SA, the model can be expressed as
The complete model formulation for Saudi Arabia, SDGs vision 2030 are summarized in Eq. (5), and can be optimized accordingly alongside their constraints.
6 Methodology
This section discussed the methodologies used in this study.
6.1 Fuzzy goal programming (FGP)
Fuzzy goal programming is applied to the concept of fuzzy set theory. Fuzzy sets describe the imprecise goals of a DM. Fuzziness can be associated with an objective function or constraints. The degree (level of inclusion) of its memberships lies within a range of zero and one. The FGP concept in which both objectives and constraints are considered fuzzy was initially proposed by Zimmermann (1978). It is used widely for the uncertain condition (Sarkar et al., 2020; Tayyab and Sarkar, 2021). Mathematically, FGP is given as
Eq. (7) shows the linear membership function for fuzzy-max goals type as follows
The fuzzy constraints membership function can be written as in Eq. (10)
6.2 Weighted fuzzy goal programming
The weighted fuzzy goal programming (WFGP) is useful in comparing two or more values of an objective function by the DM (Modibbo et al., 2021). The ultimate goal of the DM is to prioritize and solve conflicting goals simultaneously. The resulting solution must satisfy its aspirational level and is known as the ideal or Pareto solution. A weight
is assigning to all prioritized goals where a higher value predominantly goes with a high priority goal. However, the total sum of all
must equal to 1. There exist different weighting methods; they measure the deviations of the objectives relatively from there targeted goals to adjust its membership function. The WFGP with k fuzzy goals is as follows:
6.3 Analytic hierarchy process
Analytic hierarchy process (AHP) is a well-known subjective technique for weight determination in multi-objective decision problems. It is useful in ranking a predetermined set of finite alternatives in the multi-criteria analysis (Modibbo et al., 2019, 2021). The method was initially proposed by Saaty (1980), and applied in many domain of study. It is based on ratio scale that judgment are expressed as relative value of two entities. It help DM to focus better on some specific criteria or sub-criteria while allocating weights. The step wise procedure for the AHP is as follows:
-
Step 1.
-
Step 2.
Normalize the pairwise comparison matrix in Step 1 using row geometric mean method (RGMM) and obtain the weights ( ) as
(14) -
Step 3.
Evaluate the consistency of the pairwise matrix in step 1 using consistency ration (CR) and consistency index (CI) using Eq. (15) suggested by Saaty (1980).
(15)where A represent the pairwise matrix, v the matrix eigenvector, is the highes eigenvalue of the matrix, and RI is the Saaty randomly generated index from simulation for different size of n, and is given in Table. -
Step 4.
Finally, decide whether the matrix is reasonably consistent and acceptable or otherwise based on the value of CR. The acceptance value of the CR varies by the size of the matrix. For a 3 3 matrix, it is 0.05, and for a 4 4 matrix, it is 0.08, and for matrix of , it is 0.1 (Shameem et al., 2020).
| Importance intensity | Defination |
|---|---|
| 1 | Equal importance |
| 3 | Moderate importance |
| 5 | Strong importance |
| 7 | Very importance |
| 9 | Extreme importance |
| 2,4,6,8 | intermediate values |
Source: Saaty (1980).
| n | 1 | 2 | 3 | 4 | 5 | 6 | 7 | 8 | 9 | 10 | |
|---|---|---|---|---|---|---|---|---|---|---|---|
| RI | 0 | 0 | 0.58 | 0.9 | 1.12 | 1.24 | 1.32 | 1.41 | 1.45 | 1.45 |
Source: Saaty (1980).
7 Result analysis and discussion
This section analyzes the model and discusses the result obtained and its implication to attaintment of KSA vision 2030 in light of SDGs.
The information in Table 4 and 3 use for the numerical results of Eq. (5) of Section 5 for the KSA. However, due to lack of data on the sectoral contribution for GHGs emissions, goal
is not considered in the numerical solution. Thus, using LINGO optimization package version 16 (Guide, 2016), the individual optimal solution of formulated model obtained as
, and
, respectively. The procedure for the solving the multi-objective optimization problem is that, consider one objective under the same set of constraints and ignore others; solve and record the value of the objective function considered and that of variables in an n
n matrix. Use the record and interchange the objective functions and solve again using the same set of solutions obtained in the first instance until all objective values are exhausted and values obtained. Repeat the process using the second goal until all exhausted. Then use the concept of fuzzy programming discussed in Section 6.1, and obtain the individual compromise solution. The results indicate that goals related to economic growth could be achieved by 47%, this could be attributed to the oil prices crisis in the world market due to the COVID-19 pandemic that resulted to the shutdown of business around the globe for nearly one year. Evident from Table 7, the goal of clean energy consumption is achievable by 67% in 2030. The goal related to employment is achievable by 78% based on the analysis; this is quite promising in attaining the vision 2030. Source: Author’s computation via Lingo System Inc (Guide, 2016).
Variable
Value
Reduced Cost
0.4453146
0.000000
0.6738684
0.000000
0.7844499
0.000000
85240
0.000000
184527
0.000000
824735
0.000000
108001
0.000000
2252259
0.000000
230926600
0.000000
313479
0.000000
1316408
0.000000
959746
0.000000
Row
Slack or Surplus
Dual Price
1
0.5688585
1.000000
2
0.7131851E+14
0.000000
3
0.000000
0.000000
4
0.000000
0.000000
5
0.000000
0.000000
6
0.000000
0.1106465E−08
7
0.2899170E+09
0.000000
8
0.000000
−0.3164202E−07
9
0.000000
−0.4969487E−07
10
0.000000
0.000000
11
0.000000
−0.4589051E−06
12
0.000000
−0.3164202E−07
13
0.2285855E+09
0.000000
14
0.000000
−0.3164202E−07
15
0.000000
−0.3164202E−07
16
0.000000
0.000000
8 Conclusions
Achieving the sustainable development goals meant excelling and boosting the Kingdom of Saudi Arabia’s economic growth. Economic growth was a desirable element for any nation’s economy and is responsible for increasing energy consumption, contributing to emission that affects the environment we live in. Adequate availability of electricity for satisfying high demands for both domestic and industrial usage is necessary. It is optimizing the standard of living by engaging more citizenry into jobs to guarantee future population expansion and ensuring environmental safety.
The study modelled the SDGs of Saudi Arabia mathematically and quantified its achievement by 2030 to the best of our knowledge. The analysis showed that only 47% GDP related goals, 67% in energy consumption related goals, and 78%, and job-related goals will be achieved by the year 2030. Despite the increment in electricity tariff by the kingdom in an attempt to benchmark the domestic energy price with international standards, the country needed to diversify its energy mix and invest more in renewable energy sources to meet the industrial and domestic energy demands. More talented and productive youths should be engaging in boosting all the economic contributing sectors’ output to raise and stimulate government revenues and productivity.
Funding
This study received no funding from any agency or organization.
Declaration of Competing Interest
The authors declare that they have no known competing financial interests or personal relationships that could have appeared to influence the work reported in this paper.
References
- Developing sustainable energy policies for electrical energy conservation in Saudi Arabia. Energy Policy. 2006;34(13):1556-1565.
- [Google Scholar]
- Saudi arabia’s electricity: Energy supply and demand future challenges. In: 2019 1st Global Power, Energy and Communication Conference (GPECOM). IEEE; 2019. p. :467-472.
- [Google Scholar]
- An integrated multi-objective optimization modelling for sustainable development goals of india. In: Environment, Development and Sustainability. Vol 23. Springer; 2021. p. :3811-3831.
- [CrossRef] [Google Scholar]
- Carbon emissions and oil consumption in saudi arabia. Renew. Sustain. Energy Rev.. 2015;48:105-111.
- [Google Scholar]
- Energy consumption, carbon dioxide emissions and economic growth: The case of saudi arabia. Renew. Sustain. Energy Rev.. 2015;41:237-247.
- [Google Scholar]
- Energy efficiency initiatives for saudi arabia on supply and demand sides. Energy Efficiency-A Bridge to Low Carbon Economy 2012:297-308.
- [Google Scholar]
- Estimating gdp growth in saudi arabia under the government’s vision 2030: a knowledge-based economy approach. J. Knowl. Econ. 2019:1-26.
- [Google Scholar]
- Amran, Y.A., Amran, Y.M., Alyousef, R., Alabduljabbar, H., 2020. Renewable and sustainable energy production in saudi arabia according to saudi vision 2030; current status and future prospects. J. Cleaner Production, 247:119602. Elsevier. doi: 10.1016/j.jclepro.2019.119602.
- ECRA, 2019. Electricity & cogeneration regulatory authority: Kingdom of saudi arabia. https://www.ecra.gov.sa/en-us//DataAndStatistics. [Accessed on 16/06/2020]
- EIA, 2017. Country analysis brief: Saudi arabia. United State Energy Information Administration.
- GAStat, 2019. General authority for statistics: Kingdom of saudi arabia. Labour Markt 2019 Fourth Quarter: https://www.stats.gov.sa/en/823. [Accessed on 16/06/2020]
- Guide, L.U., 2016. Lindo systems inc. Chicago, IL.
- Management of animal fat-based biodiesel supply chain under the paradigm of sustainability. Energy Convers. Manage.. 2020;225:113345
- [Google Scholar]
- Economic development and energy consumption in the gcc: An international sectoral analysis. Energy Transitions. 2017;1(2):6.
- [Google Scholar]
- Institute, M.G., 2015. Saudi arabia beyond oil: The investment and productivity transformation.
- Multi-criteria model for sustainable development using goal programming applied to the united arab emirates. Energy Policy. 2015;87:447-454.
- [Google Scholar]
- A weighted goal programming model for planning sustainable development applied to gulf cooperation council countries. Appl. Energy. 2017;185:1931-1939.
- [Google Scholar]
- Environmental effect for a complex green supply-chain management to control waste: A sustainable approach. J. Cleaner Prod.. 2020;277:122919
- [Google Scholar]
- Sustainability, cooperation and mobility of workers within and between european countries: a two-stage goal programming model. Ann. Oper. Res. 2020:1-21.
- [CrossRef] [Google Scholar]
- Energy consumption, economic growth and pollution in saudi arabia. Manage. Sci. Letters. 2020;10(5):979-984.
- [Google Scholar]
- Agriculture development and co2 emissions nexus in saudi arabia. Plos one. 2019;14(12):e0225865
- [Google Scholar]
- Energy consumption and economic growth: An empirical study of the electricity consumption in saudi arabia. Renew. Sustain. Energy Rev.. 2017;75:145-156.
- [Google Scholar]
- Multi-objective optimization modelling for analysing sustainable development goals of nigeria: Agenda 2030. Environment, Development and Sustainability. 2021;23(6):9529-9563.
- [CrossRef] [Google Scholar]
- Multi-criteria decision analysis for malaria control strategies using analytic hierarchy process: A case of yola north local government area, adamawa state nigeria. Amity J. Comput. Sci.. 2019;3(2):43-50.
- [Google Scholar]
- Nechi, S., Aouni, B., Mrabet, Z., 2019. Managing sustainable development through goal programming model and satisfaction functions. Annals of Operations Research, pages 1–20. Springer. https://doi.org/10.1007/s10479-019-03139-9
- A fuzzy goal programming approach to analyse sustainable development goals of india. Appl. Econ. Letters. 2017;24(7):443-447.
- [Google Scholar]
- Greenhouse gas emissions from road transportation in saudi arabia-a challenging frontier. Renew. Sustain. Energy Rev.. 2017;69:812-821.
- [Google Scholar]
- The analytical hierarchy process, planning, priority. Resource Allocation. USA: RWS publications; 1980.
- SAMA, 2020. General authority for statistics: Kingdom of Saudi Arabia. Gross Domestic Product First Quarter 2020: https://www.stats.gov.sa/en. [Accessed on 1/07/2020].
- How does an industry reduce waste and consumed energy within a multi-stage smart sustainable biofuel production system? J. Cleaner Prod.. 2020;262:121200
- [Google Scholar]
- A cooperative advertising collaboration policy in supply chain management under uncertain conditions. Appl. Soft Comput.. 2020;88:105948
- [Google Scholar]
- Analytic hierarchy process based prioritisation and taxonomy of success factors for scaling agile methods in global software development. IET Software 2020
- [Google Scholar]
- An interactive fuzzy programming approach for a sustainable supplier selection under textile supply chain management. Computers Ind. Eng.. 2021;155:107164
- [Google Scholar]
- TradingEconomics, 2019. Trading economics.com. world bank. https://www.tradingeconomics.com/saudi-arabia/gdp. [Accessed on 16/06/2020].
- Brown to green: the g20 transition to a low-carbon economy. Retrieved. 2018;12(12):2018.
- [Google Scholar]
- Reduction of waste and carbon emission through the selection of items with cross-price elasticity of demand to form a sustainable supply chain with preservation technology. J. Cleaner Prod.. 2021;297:126298
- [Google Scholar]
- Fuzzy programming and linear programming with several objective functions. Fuzzy Sets and Systems. 1978;1(1):45-55.
- [Google Scholar]


