

Translate this page into:
A highly sensitive colorimetric sensor for Hg2+ detection based on the oxidative enzyme mimics-like activity of hierarchical porous carbon@chitosan-modified silver nanoparticles
⁎Corresponding author.
-
Received: ,
Accepted: ,
This article was originally published by Elsevier and was migrated to Scientific Scholar after the change of Publisher.
Peer review under responsibility of King Saud University.
Abstract
In this paper, DMC was prepared via carbonization in nitrogen with plexiglass as the template and sucrose as the carbon source. The hierarchical porous carbon (DHPC) was prepared by treating DMC with potassium hydroxide. The DHPC was loaded on chitosan to prepare DHPC@CS, which was then doped into nanosilver via the one-pot process to prepare DHPC@CS-AgNPs. The morphology of DHPC@CS-AgNPs was characterized using the Scanning Electron Microscope (SEM) and the Transmission Electron Microscope (TEM). In the presence of Hg2+, DHPC@CS-AgNPs will catalyze the oxidation of TMB, resulting in an observable change of color, so a rapid, sensitive and highly selective method could be established to detect trace Hg2+ colorimetric sensors. The conditions of the TMB color reaction, characteristics of the Hg2+ -DHPC@CS-AgNPs oxidized enzyme mimics and their color reaction characteristics were studied. Under the optimized conditions, coloration could not be catalyzed in the DHPC@CS-AgNPs-TMB system, but with the addition of the mercury ions, the catalytic activity was enhanced and the oxidized enzyme mimic activity was observed. In the Hg2+-DHPC@CS-AgNPs-TMB system, when TMB was used as a substrate, Km = 0.0165 mM, and Vmax = 4.6512 × 10⁻⁸ M·s−1. Under the optimized conditions, the linear range of mercury ion was determined to be 1 × 10⁻⁸–1 × 10⁻⁶ mol·L−1 using the above method, the linear relationship was r = 0.99753, the detection limit (S/N = 3) was 7 × 10⁻⁹ mol·L−1, and the recoveries of spiked water sample and fish sample ranged from 84.4% to 103%.
Keywords
Mercury ion
Nanosilver
Photochemical sensor
Water sample
Fish sample

1 Introduction
Mercury is a toxic heavy metal. Exposure to high levels of mercury will seriously damage the central nervous system. An overdose of methylmercury will poison the body, which is referred to as Minamata disease (Chen et al., 2016a). In the natural environment, mercury exists in different forms, the most stable of which is methylene mercury. There is thus an urgent need for reliable methods to determine the mercury content in the environment.
Given the harm of mercury, people have developed many methods for determining the quantity of mercury ions. Conventional methods include the electrochemical method (Kuswandi et al., 2007; Qiu et al., 2016), inductively coupled plasma mass spectrometry (Zhang et al., 2013), high performance liquid chromatography (Zhang et al., 2013), atomic absorption spectroscopy (Nevado et al., 2011) and atomic fluorescence spectrometry (Chen et al., 2016b). Although these methods have low detection limits and are suitable for trace Hg2+ detection, it is difficult to carry them out on site because they require complicated sample preparation, time-consuming analysis and costly instruments. The colorimetric sensor method (Bai et al., 2014) is more ideal because it is low cost, fast and easy to operate. The color change can be easily observed with the naked eye, removing the need for any expensive equipment, and is therefore suitable for on-site analysis. In this method, the change of the optical absorption of the sensor unit is used as the output signal to detect the analyte (Jia and Feng, 2013). Using the absorbance or the change of migration of the UV absorption spectrum, the analytes can be distinguished and detected, which may apply to the detection of biological samples, gases, ions and small molecules (See Fig. 1).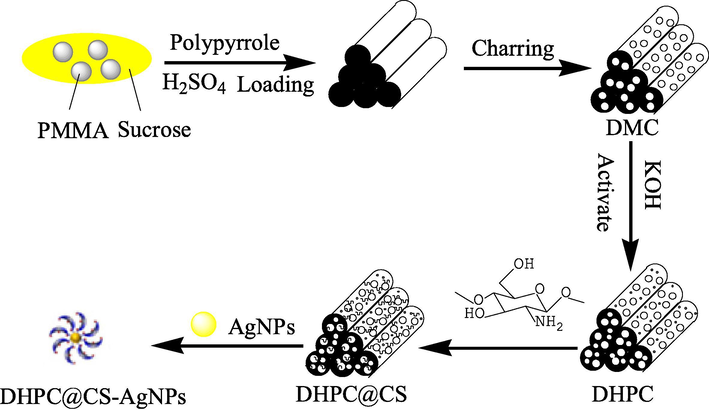
Preperation of DHPC@CS-AgNPs.
In recent years, nanozymes have been in the spotlight in the field of catalysis. Common nanozymes may be divided into oxide enzyme mimics, carbon-based nanozymes and precious metal nanozymes. Compared with other types of enzyme mimics, oxidative enzyme mimics are less studied. Luo et al. (2015) modified the stabilized gold nanoclusters with bovine serum albumin and found that, under illumination, it can catalyze the TMB coloration via oxygen dissolved in water, which enables the rapid detection of trypsin. Florina Pogacean et al. (2015) compared the catalytic activity of nitrogen-doped graphene loaded with different kinds of nano-precious metals and that of different kinds of nano-precious metals, and found that the nitrogen-doped graphene loaded with nano-precious metal has a higher catalytic activity. Zhang et al. (2015). Synthesized Au@Fe3O4@GO, a magnetic composite material. Its catalytic activity would increase immediately once Hg2+ is present, and a detection method is thus established. Yang’s team (Yang et al., 2015) used glutathione and nano-manganese oxide to make oxidative enzyme mimics that could rapidly restore the blue color of nano-manganese oxide in the presence of mercury and glutathione, and a fast detection method was therefore established. Asati et al. (2009) prepared ceria and found that it has the properties of oxidative enzyme mimics. In the absence of hydrogen peroxide, the ceria could catalyze the oxidative substrate, resulting in color changes. A new immunoassay is thus established. Li (2012) found that both the gold-platinum composite and palladium-platinum core-shell composite materials have the activity of oxidative enzyme mimics, so they can catalyze the oxidation of TMB and OPD, but some metal ions would inhibit the catalytic activity of nano-platinum. Xu (2014) prepared the oxidative enzyme mimics of mercury-enhanced nano silver that has the catalytic activity to catalyze different substrates. They are selective of mercury ions, enabling the detection of the mercury ion content.
In this study, a new type of oxidative enzyme mimic DHPC@CS-AgNPs was produced with self-made macroporous carbon and silver nanoparticles. Mercury ions were reduced to mercury on the surface of the nanosilver, which covered its surface and formed a shell, without adding hydrogen peroxide to provide hydroxyl radicals. Self-made macroporous carbon can increase its catalytic activity, by aiding its catalysis for the transformation of dissolved oxygen into superoxide anions, which promoted the oxidation of TMB, resulting in a significant change of color from yellow to blue. Other metal ions, compared with mercury ions, did not possess the ability to enhance the catalytic activity of nanosilver. Therefore, this method of mercury ion detection showed good selectivity. Hg@DHPC-AgNPs, which have a core-shell structure, can catalyze the oxidation of TMB by oxygen and build a photocatalytic sensor to detect mercury ions. Compared with catalases, the oxidative enzyme mimic method avoided the use of unstable and destructive hydrogen peroxide (See Table 1).
Sample
Measured value (μmol·L−1)
Scalar (μmol·L−1)
Measured Concentration (μmol·L−1)
Average recovery rate
RSD (%)
Water sample of Xijiang
–
50
200
50042.2
191.8
513.184.4
95.9
1033.1
2.6
4.0
Meat sample of Crucian Carp
–
50
200
50043.4
183.8
469.286.8
91.9
93.83.3
4.4
5.2
2 Experiment
2.1 Instruments and reagents
UV2600 ultraviolet-visible spectrophotometer (Shimadzu Corporation, Japan), SUPRA 55 SAPPHIRA scanning electron microscope (Carl Zeiss Company, Germany), PHS-3C pH-meter (INESA, Shanghai), 78-1 magnetic heating stirrer Changzhou Putian Instrument Manufacturing Co., Ltd.), SPH-200D incubator (Shanghai Shiping Co., Ltd.), GSL-170OX tube furnace (Hefei Kejing Materials Technology Co., Ltd.), AFS-9780 atomic fluorescence photometer (Thermo Fisher Scientific Inc., US).
Standard mercury (0.1000 mg·mL−1, Tianjin Guangfu Fine Chemical Research Institute), silver nitrate (AR, Tianjin Kemiou Chemical Reagent Co., Ltd.), chitosan (AR, Aladdin Chemical Reagent Co., Ltd.) 3,3′,5,5′-tetramethylbenzidine (AR, Aladdin Chemical Reagent Co., Ltd.); sucrose, acetic acid, sodium acetate, sulfuric acid, nitric acid were purchased from Guangzhou Chemical Reagent Co., Ltd. All the reagents were analytically pure, the water used in the experiments was ultrapure water; water samples were collected from the Xijiang River and tap water; fish samples were the carp and sun fish.
2.2 Preparation of DHPC@CS
In a 250 mL three-necked flask, 100 mL of ultrapure water was added, followed by 15 mL of 20% methyl methacrylate, 0.1 mL of 10% methacrylic acid and 1 mL of 5% ethyleneglycol dimethacrylate, stirred mechanically at 350 r/min and heated to 75 °C. Then 0.05 g of potassium persulfate was added, the mix was heated to 90 °C and remained at the temperature for 1.5 h before the reaction was stopped to obtain polymethylmethacrylate (PMMA). 20 g of PMMA emulsion and 0.5 g of sucrose were mixed and stirred for 15 min, then 0.1 g of polypyrrole and 0.5 mL of 1 mol/L H2SO4 were added successively and stirred for 15 min. The mixture was poured on a petri dish and dried at 60 °C for 6 h, then kept in a tube furnace at 150 °C in the atmosphere of nitrogen for 6 h and then carbonized at 900 °C for 3 h to obtain macroporous carbon (DMC). 0.5 g of the DMC prepared was added to a mixed solution of 5 mL of acetone and 20 mL of 0.1 g·mL−1 KOH. The liquid was stirred magnetically at 100 °C until a slurry-like mixture was formed. Then the mixture was placed n a tube furnace and activated in nitrogen at 200 °C. The activated product was washed with distilled water until pH = 7 and filtered and dried in vacuum to produce DHPC. Next, 0.1 g of CS was added in 100 mL of 1% acetic acid with magnetically stirring at room temperature untill CS is completely dissolved. Then 0.1 g of DHPC was added and the mixture was dispersed for 4 h with ultrasonic and filtered to obtain DHPC@CS solution. Based on a modified version of the method provided by existing studies (Wang et al., 2014), with magnetic stirring, 30 mL of 0.6 mmol·L−1 AgNO3 was slowly added dropwise to a 70 mL mixed solution of 7.6 mmol·L−1 NaBH4 and 2 mg·mL−1 DHPC@CS. The mixture was then stirred for 24 h, and stored at 4 °C.
2.3 Kinetics of DHPC@CS-AgNPs enhanced by mercury
500 μL of 0.18 mmol·L−1 DHPC@CS-AgNPs and 500 μL of 10−6 mol·L−1 Hg2+ were added into 300 μL of TMB solutions of different concentrations, and then 1 mL of HAc-NaAc buffer solution (pH = 4) was added. The mixtures were diluted with ultrapure water to 5 mL and their absorbance was measured at 652 nm with a UV spectrophotometer (See Table 2).
Sample
Hg2+(μmol·L−1)
AFS (μg·L−1)
Tap water
–
–
Water from Xingzhi Lake
–
–
Crucian fishtail
–
0.0173
Sunfish meat
–
0.0187
Sunfish tail
–
0.0214
2.4 Photochemical detection
500 μL of 0.18 mmol·L−1 DHPC@CS-AgNPs and 500 0−6 mol·L−1 Hg2+ were put in a 5 mL colorimetric tube, then 300 μL of 400 mmol·L−1 TMB solution and 1 mL HAc-NaAc buffer solution (pH = 4) were added. The mixture was diluted with ultrapure water to 5 mL and incubated in an incubator shaker at 40 °C for 10 min, and its absorbance was measured.
2.5 Sample processing
2.5.1 Fish sample processing
According to the national standard (Yang et al., 2015), 2.0 g of the sample was put in a digestion tank, and then 5 mL of concentrated nitric acid was added. The tank was sealed with the lid and let sit for 12 h, then it was placed in a microwave digestion system to be digested, cooled down and taken out when finished. The cap was washed with ultrapure water, and the tank was placed in an ultrasonic water bath for 2 min for gas expulsion. Then the solution was moved to a 25 mL volumetric flask, and diluted to the volume. Then 500 μL of the sample solution was taken and tested with the method in 2.5.
2.5.2 Water sample processing
The sample was filtered with a 0.22 μm membrane, adjusted with 0.05 mol·L−1 HAc-NaAc buffer solution till pH = 4 and reserved at 4 °C. 500 μL of the sample solution was taken and tested with the method in 2.5.
3 Results and discussion
3.1 Characterization of DHPC@CS-AgNPs and Hg2 + -DHPC@CS-AgNPs
The electron microscopy scanning results of DMC, DHPC and DHPC@CS are shown in Fig. 2. The pores of DMC are evenly distributed and the size is large. The high-temperature carbonization removed the template without causing collapse, indicating that microporous carbon was successfully prepared. After KOH activation, pores of different sizes were formed on the surface of DHPC, including macropores, mesopores and micropores, and the surface is smooth, indicating the preparation of hierarchical porous carbon. The prepared DMC and DHPC are consistent with the literature (Wang et al., 2014). The pores of DHPC@CS were not blocked by chitosan, and remained the original diameter, while the smooth surface became rough, indicating that chitosan was adsorbed on the surface of DHPC, and thus showing that DHPC@CS was prepared.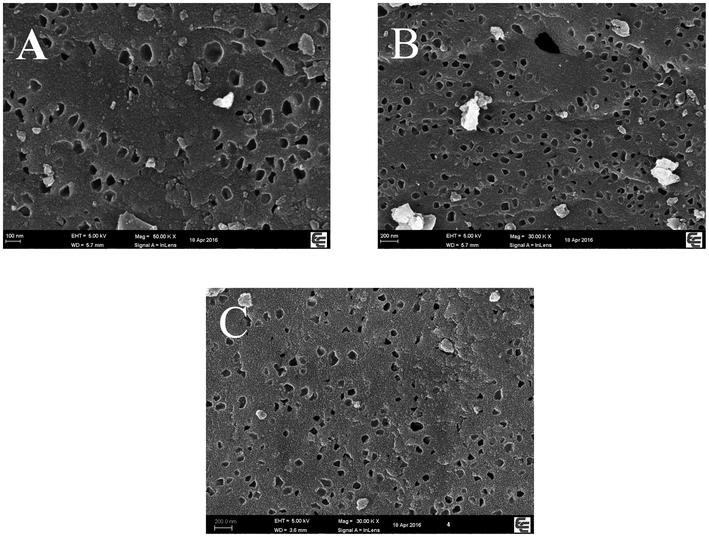
Scanning electron micrographs (A: DMC, B: DHPC, C: DHPC@CS).
3.2 Examination of the enhancement of DHPC@CS-AgNPs by mercury
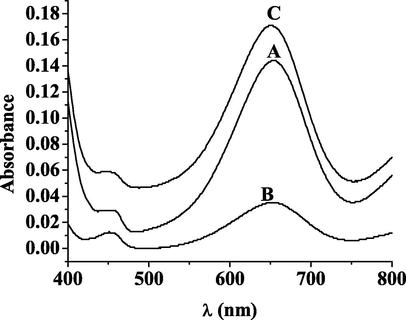
To examine the activity of Hg2+-DHPC@CS-AgNPs oxidative enzyme mimics, TMB was used as a substrate and the activity can be determined through the characteristic absorption peak of TMB oxidation. The study examined whether in the three systems, Hg2+-TMB, DHPC@CS-AgNPs-TMB and Hg2+-DHPC@CS-AgNPs, TMB can be oxidized and colored. The results showed that there was no change of color in the presence of Hg2+-TMB, the result was colorless and transparent and it could not catalyze the oxidation of TMB by oxygen (Fig. 3 curve a). In the DHPC@CS-AgNPs-TMB system, the characteristic absorption peak did not change and remained that of nanosilver, and the color was still yellow, indicating that DHPC@CS-AgNPs cannot catalyze the oxidation of TMB by oxygen (Fig. 3, curve b); curve c in Fig. 3 shows that with the presence of Hg2+, the catalytic activity of DHPC@CS-AgNPs was immediately increased, and catalyzed the oxidation of TMB, changing its color. TMB, after color rendering, showed at 370 nm and 652 nm characteristic absorption peaks, and the solution turned from yellow to blue. The experiments showed that the presence of Hg2+ can enhance the catalytic activity of carbon-doped nano-silver oxidation enzyme mimics, coloring TMB. This result is basically consistent with the literature (Asati et al., 2009), indicating that Hg2+-DHPC@CS-AgNPs has oxidative mimic enzyme activity.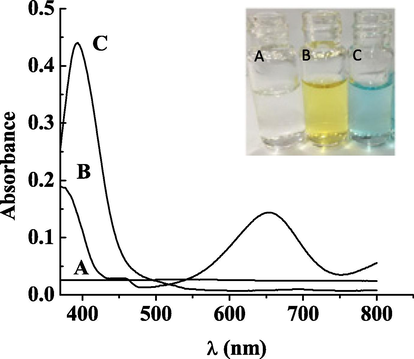
UV absorption spectroscopy of Hg2++TMB(A); DHPC@CS-AgNPs + TMB(B); DHPC@CS-AgNPs + TMB + Hg2+ (C).
3.3 Optimization of Hg2+-DHPC@CS-AgNPs reaction system conditions
3.3.1 Effect of solution pH value
Since the catalytic activity of nano-silver is greatly affected by the pH value of the solution, in this study, the pH value of the solution is adjusted in the 0.05 mol·L−1 NaAc-HAc buffer solution to investigate the effects of 1.0 × 10⁻⁶ mol·L−1 standard mercury solution, 500 μL of 400 mmol·L−1 TMB and 500 μL of 0.18 mmol·L−1 DHPC@CS-AgNPs for 10 min at 40℃ and pH = 3–8 on the catalytic activity of carbon-doped nano-silver. When pH = 3–5, carbon-doped nano-silver to maintained a high level of catalytic activity. The aminos of the chitosans in 0.05 mol·L−1 NaAc-HAc buffer solution was protonated, giving the DHPC@CS-AgNPs system positive charges. The electrostatic repulsion among the protonated chitosans prevented the nano-silver from agglomerating and improved its catalytic activity. When pH > 5, the catalytic activity gradually decreased. This was caused by the deprotonation of chitosans. The silver nano-particles agglomerated, and their catalytic activity decreased, which is consistent with the literature (Li, 2012). The experimental results showed that, when pH = 4, the nano-silver particiles enhance by mercury ions has the best catalytic activity.
3.3.2 Effect of temperature
Under the conditions of pH = 4, 1.0 × 10⁻⁶ mol·L−1 standard mercury solution, 500 μL of 400 mmol·L−1 TMB and 500 μL of 0.18 mmol·L−1DHPC@CS-AgNPs, the reaction was carried out for 10 min to examine the effect of temperature on the catalytic activity. The catalytic activity of the nano-silver gradually increased at temperatures ranging from 20 to 40 °C. DHPC@CS-AgNPs-Hg2+ has the highest catalytic activity at 40 °C. And when T > 40 °C, the catalytic activity began to decline. At high temperatures, the catalytic activity of the system is relatively low. Under normal conditions, HRP shows almost no catalytic activity at temperatures above 55 °C, whereas DHPC@CS-AgNPs-Hg2+ still showed better catalytic activity, indicating the stability of the DHPC@CS-AgNPs was better than natural enzyme. Therefore, the best temperature is 40 °C.
3.3.3 Effect of TMB concentration
Under the conditions of 40 °C, pH = 4, 1.0 × 10⁻⁶ mol·L−1 mercury standard solution and 500 μL of 0.18 mmol·L−1DHPC@CS-AgNPs, the reaction was carried out for 10 min to investigate the effects of different concentrations of TMB on the catalytic activity. The absorbance increases as the concentration of TMB increases. When the concentration reaches 400 mmol·L−1, the absorbance at 652 nm was the maximum. When the TMB concentration continues to increase, the absorbance does not substantially change. Only 400 mmol·L−1 can be oxidized in the whole system, therefore the optimal TMB concentration is 400 mmol·L−1.
3.3.4 Effect of DHPC @ CS-AgNPs catalyst amount
The effects of DHPC @ CS-AgNPs dosage on the reaction system were investigated under the conditions of 40 °C, pH = 4, 1.0 × 10⁻⁶ mol·L−1 mercury standard solution and 500 μL 400 mmol·L−1 TMB for 10 min. When the amount of DHPC @ CS-AgNPs is between 0.10 and 0.18 mol·L−1, the absorbance of the color rendering system increases with the amount of the catalyst. The absorbance of the color rendering system reaches its maximum when the catalyst concentration is between 0.18 and 0.20 mmol·L−1. However, when the concentration of catalyst is 0.22 mmol·L−1, the absorbance of the color rendering system decreased sharply, which was due to the high concentration of nanosilver. When its concentration is too high, the electrostatic repulsion of chitosan could not prevent nanosilver from aggregation. Lead to the catalytic effect of decline. Therefore, the optimal concentration of DHPC @ CS-AgNPs is 0.18 mmol·L−1.
3.4 Catalytic mechanism
The chitosan-modified nano-silver can reduce Hg2+ to elemental mercury. After Hg2+ was added to the solution of DHPC @ CS-AgNPs, the absorption peak of nanosilver shifted from 400 nm to 392 nm (Fig. 4). Mercury ions bonded with chitosan and absorbed on the surface of nanosilver. Then the redox reaction occured and a large number of mercury deposited on the surface of nanosilver, forming a core–shell nano structure. To prove that elemental mercury can enhance the enzyme-mimic activity of DHPC @ CS-AgNPs, a solution of 0.5 mL of 1 mmol·L−1 NaBH4 was added and placed in the same condition for 12 h, to reduce mercury ions and form elemental mercury. Because sodium borohydride a stronger reducing agent than chitosan, so it can reduce more mercury ions to more elemental mercury. As the reaction goes, a mercury-silver core–shell structure is formed, and the original properties of the silver nanosilver is changed. It continues to catalyze the oxidation of TMB, which leads to the rendering of color and the catalytic activity is further improved (Fig. 5-c). In order to explore where the superoxide anion (O2−) was generated, we performed a control test, where we reduced the superoxide anion with supersonic waves. As a result, the enzyme-mimic activity was greatly reduced. (Fig. 5) It is demonstrated that the dissolved oxygen in the catalytic process acts as an oxidant. The color rendered by the TMB oxidation, is due to the catalytic oxidation of dissolved oxygen, in which superoxide anions are formed, it is not resulted of the reaction of TMB with DHPC @ CSAgNPs or Hg2+.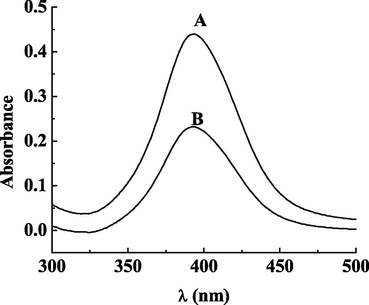
UV Absorption Spectrum of DHPC @ CS-AgNPS (A); DHPC @ CS-AgNPS + Hg2+ (B).
Ultrasound deoxygenation on the catalytic activity (A) without ultrasound (B) ultrasonic deoxygenation (C) without ultrasound, DHPC @ CS-AgNPs + TMB + Hg2 NaBH4 reaction, for 12 h.
3.5 Interference testing and selectivity
In actual samples, the presence of other ions may affect the catalytic activity of the system. Therefore, we investigated whether the presence of 500-fold Ca2+, K+, Na +, SO42−, CO32− or 100-fold glucose and glycine will affect the measure of mercury ions, under the optimal conditions. The results showed that with the presence of these ions, the relative errors of all tests were ≤f al%. It indicates that the above-mentioned coexisting ions do not affect the measure of mercury ions. Under the same optimal conditions, we conducted other tests in which 10−6 mol·L−1 other metal ions were added respectively to replace mercury ions. The methods were consistent with 2.5. Mercury ions is the only chemical that significantly enhances the catalytic activity of the enzyme mimic in the oxidization reaction, and help the system to render a color of blue, with the maximum absorption appearing at 652 nm of the TMB wavelength. The results show that the mercury ion is more reactive to the carbon-doped nano-silver and DHPC @ CS-AgNPs has a good selectivity to it.
4 Methods
4.1 Methods linear equations and detection limits
We used the extracting solution comprised of the blank water samples and the blank fish samples to prepare standard solutions of mercury ion with concentrations of 0.02, 0.05, 0.2, 0.5 and 1 μmol·L−1 respectively. Our purpose is to measure the absorption wavelength of the color rendering system at 652 nm of the spectrum, under the optimal experimental conditions. We also constructed a calibration plot of absorbance A on the y-axis and concentration c (μmol·L−1) on the x-axis for the standard solutions. The results are shown in Figs. 6 and 7. The concentration of mercury ion ranges from 0.02 to 1 μmol·L−1 presents a good linear relationship with A (absorption). The linear relationship of water samples satisfies the equation: A = 0.332c + 0.085, with the correlation coefficient r = 0.99753, and the detection limit was (S/N = 3) 0.014 μg mL−1. The national standard (Standards Press of China, 2014) used the cold atomic absorption spectrophotometer to detect the environmental water quality. Its detection limit was rather low, with the minimum amount of 0.0001 mg·L−1. The linear relationship of fish samples satisfies the equation of A = 0.292c + 0.110, with the correlation coefficient r = 0.99791, and the detection limit was (S/N = 3) 0.018 mg kg−1. The minimum detection limit of mercury ion in fish samples of national standard (Standards Press of China, 2014) is 0.012 mg·kg−1, which is close to the lowest detection limit results from using colorimetric sensor, so it can be well applied.12345Curves 1–5: Mercury ion concentrations were 0.02, 0.05, 0.2, 0.5 and 1 μmol·L−1, respectively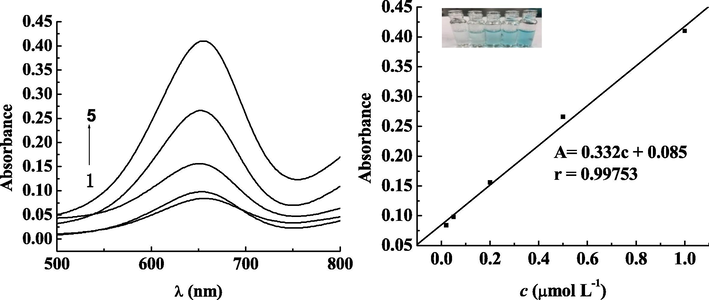
Relationship between mercury ion concentration and absorbance at different concentrations in water samples.
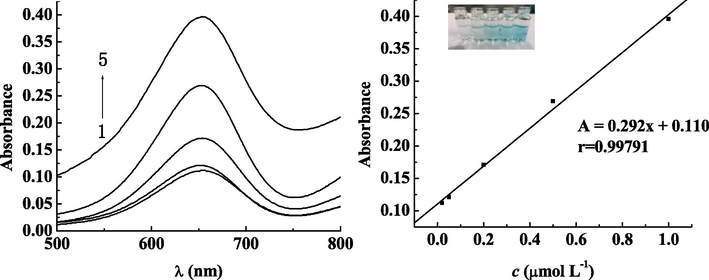
Fish samples of different concentrations of mercury ions and absorbance relationship Curves 1–5: Mercury ion concentrations were 0.02, 0.05, 0.2, 0.5 and 1 μmol·L−1, respectively.
4.2 Precision and accuracy
The water samples were treated based on the method in 2.5.2. The fish samples were diluted based on the method in 2.5.1. Then, spike-and-recovery experiments were performed to analyze and access the accuracy. We added (spiked) a known concentration of 50, 200, and 500 μmol·L−1 respectively into the samples. The recovery rates in water samples ranged from 84.4% to 103%. The recovery rates of fish samples ranged from 86.8% to 93.8%. RSD ranged from 2.6% to 5.2%, indicating a high precision and accuracy. “−” Indicates” not detected”
5 Application
Under the best experimental conditions, we measured the level of mercury ions for different water samples and fish samples. We conducted parallel experiments for three times and the results of these tests and of national standard are shown in the table below “-” indicates not detected
6 Conclusion
This paper uses plexiglass as a template, KOH as a modifier to prepare hierarchical porous carbon. The surface of hierarchical porous carbon is doped and modified by nano-silver. Then we use mercury ions to enhance the activity of carbon-doped nano-silver, which serves as a enzyme mimic in the oxdization reaction. In this way, a colorimetric sensor based on mercury ions is created. This method is fast, sensitive, and selective. Experimental results show that the catalytic activity of carbon-doped nano-silver can be enhanced with the increase of mercury ions, Mercury ions-enhanced and carbon-doped nanosilver could catalyze dissolved oxygen to form superoxide anion, rendering the color in TMB. Nanosilver synthesis method is simple and convenient and nanosilver has good chemical activity, so it is a promising nanomaterial. This system can be mass-produced. And such testing method does not need complicated pre-treatment. Therefore, nanosilver can be used to measure mercury ion content in daily life and it has a good application prospect.
Acknowledgments
This work is financially supported by the National Natural Science Foundation of China (NO. 20968005), the fund of the Key Laboratory for Processing of Sugar Resources of Guangxi Higher Education Institutes (2016TZYKF01) and the high levels of innovation team and excellence Scholars Program in colleges of Guangxi. The first two authors contributed equally.
Declaration of Competing Interest
All the authors hereby agreed and confirm that there is no conflict of interest for this research work and publication of this paper.
References
- Oxidase-like activity of polymer-coated cerium oxide nanoparticles. Angew. Chem. Int. Ed.. 2009;48(13):2308-2312.
- [Google Scholar]
- Gold nanoparticle based colorimetry and its application in rapid detection for food safety. J. Food Saf. Qual.. 2014;5(7):1943-1950.
- [Google Scholar]
- Determination of extractable arsenic, antimony and mercury in leather by atomic fluorescence spectrometry. Leather Sci. Eng.. 2016;26(1):69-72.
- [Google Scholar]
- Research progress in the determination of mercury speciation in aquatic products. Sci. Technol. Food Ind.. 2016;6(3):368-372.
- [Google Scholar]
- Progress in optical colorimetric/fluorometric sensor array. Chin. J. Anal. Chem.. 2013;5(41):795-802.
- [Google Scholar]
- Development of a disposable mercury ion-selective optode based on trityl-picolinamide as ionophore. Anal. Chim. Acta. 2007;591(2):208-213.
- [Google Scholar]
- Study on the New Method of Visual. Lanzhou: Detection for Micro Hg2+; 2012.
- Recent advances in applications of nanoparticles as enzyme mimetics. Sci. Sin. Chim.. 2015;45(10):1026-1041.
- [Google Scholar]
- Comparison of gas chromatographic hyphenated techniques for mercury speciation analysis. J. Chromatogr. A. 2011;1218(28):4545-4551.
- [Google Scholar]
- Graphene based nanomaterials as chemical sensors for hydrogen peroxide–A comparison study of their intrinsic peroxidase catalytic behavior. Sens. Actuat. B. 2015;213:474-483.
- [Google Scholar]
- Electrochemical determination of Hg (II) at gold nanoparticles@Carbonaceous microspheres modified electrode. J. Electrochem.. 2016;22(1):20-24.
- [Google Scholar]
- Standards Press of China, 2014. National Food Safety Standards, Beijing
- Mercury (II)-stimulated oxidase mimetic activity of silver nanoparticles as a sensitive and selective mercury (II) sensor. RSC Adv.. 2014;4(12):5867-5872.
- [Google Scholar]
- X.F. Xu Nanomaterials as enzyme mimetics and its application in analysis 2014 Wuxi
- Colorimetric detection of mercury ions using MnO 2 nanorods as enzyme mimics. Anal. Methods. 2015;7(11):4596-4601.
- [Google Scholar]
- Microwave-assisted ex-traction and liquid chromatography-Determination of mercury compounds in samples coupled plasma-mass spectrometry (ICP-MS) Environ. Chem.. 2013;32(11):2219-2222.
- [Google Scholar]
- A strongly coupled Au/Fe3O4/GO hybrid material with enhanced nanozyme activity for highly sensitive colorimetric detection, and rapid and efficient removal of Hg2+ in aqueous solutions. Nanoscale. 2015;7(18):8495-8502.
- [Google Scholar]


