

Translate this page into:
A cross-sectional study on the association of single nucleotide polymorphism of leptin receptor (Gln223Arg) and insulin resistance in gestational diabetes mellitus
⁎Corresponding author. ushachidu@nitte.edu.in (Usha Adiga)
-
Received: ,
Accepted: ,
This article was originally published by Elsevier and was migrated to Scientific Scholar after the change of Publisher.
Peer review under responsibility of King Saud University.
Abstract
Background
The role of genetics in pathophysiology of gestational diabetes mellitus (GDM) is least explored. Objective of the study is to find the association of leptin receptor (LEPR) gene polymorphism with GDM and its role in altered leptin levels, insulin resistance, and dyslipidemia in GDM.
Methods
Hundred GDM patients and an equal number of BMI and gestational age matched normal glucose tolerant pregnant women were recruited as cases and controls. Five milliliters of venous blood was drawn for biochemical and genetic analysis. Genotyping of LEPR (Gln223Arg) was performed by PCR-RFLP. Fasting blood sugar, leptin, insulin, C-peptide, and lipid profile estimations were done. Various insulin resistance models were constructed using suitable formulae. The statistical analysis was performed using SPSS 23.0 software.
Results
There was no significant association found between LEPR gene polymorphism with leptin levels and insulin resistance in GDM. However, Odd’s ratio showed that individuals with the “A” allele were at 1.25 times higher risk of developing GDM. HOMA B-cell significantly varied among LEPR genotypes (p < 0.0001), values being double in AA genotype, compared to AG (p < 0.05), ten times higher in AA compared to GG (p < 0.0001). There was no significant deviation of the genotype frequency distributions for rs1137101 variants from HWE in GDM cases, suggesting that alleles were in equilibrium.
Conclusion
The study established a cycle of gene polymorphism altering leptin levels which in turn can alter insulin secretion and insulin resistance, contributing to dyslipidemia of pregnancy as well as gestational diabetes.
Keywords
Gestational diabetes mellitus
Insulin resistance
Hardy-weinberg equillibrium
Leptin

1 Introduction
Gestational diabetes mellitus (GDM) is one of the major complications that occur due to impaired carbohydrate tolerance metabolism during pregnancy (Metzger et al., 2007). It develops as a result of decreased insulin sensitivity and results in altered metabolic effects like increased postprandial FFAs, increased hepatic glucose production high blood glucose levels. Adipose tissue acts as an endocrine gland, producing various adipokines which help in establishing communication between adipose tissue and other organs. Leptin is an important adipokine, mediating a wide range of functions like lipid and carbohydrate metabolism, insulin sensitivity, atherosclerosis, angiogenesis, etc. Leptin levels are reported to be altered, may be increased or decreased in GDM (McLachlan et al., 2006).
There are various studies, which have reported the influence of gene polymorphisms on causation of GDM. Study by Hoffstedt et al. (2002) reported an association between LEP G2548A polymorphism and elevated leptin levels. The relationship between polymorphisms of leptin as well as its receptor with type 2 diabetes mellitus is well established. Yang et al. (2016) studied both leptin gene and its receptor polymorphism in Chinese population, however they didn’t find any significant association between leptin receptor gene polymorphism and GDM. Genetic polymorphisms may vary from population to population. There are no such reports available in Indian population, however, reports available are conflicting and the fact is yet to be established.
Insulin resistance in GDM has been associated with elevated leptin levels (Laivuori et al., 2000). As leptin is closely associated with lipid metabolism, it may be attributed to dyslipidemia in GDM. As leptin has a wide range of metabolic roles, it may have an impact on pregnancy outcomes, both maternal as well as fetal.
Pregnancy complicated with GDM may have a higher risk of developing postpartum hemorrhage, miscarriage, macrosomia, hypertensive disorders, operative delivery, and patients may develop diabetes mellitus in the future (Kim et al., 2002). The offsprings may be associated with hypoglycemia, neonatal respiratory distress syndrome, premature birth, impaired glucose metabolism at an early age. (Kampmann et al., 2015). Thus the present study was aimed to evaluate the pattern of LEPR (Gln223Arg) gene polymorphism in GDM and to find its association with insulin resistance and serum biochemical parameters.
2 Materials and methods
2.1 Study design
A prospective cross-sectional study was conducted in hundred GDM patients diagnosed based on 75 g oral glucose tolerance test (OGTT) as per American diabetic association (ADA) 2016 criteria. Hundred BMI and gestational age matched normal glucose tolerant pregnant women were considered as a control group. Multiple pregnancies, known pre-gestational diabetes, pregnancies complicated by major fetal malformations or known major cardiac, renal or hepatic disorders, pregnancy induced hypertension (PIH) were the exclusion criteria. The study was conducted at Central Research Laboratory of K.S. Hegde Medical Academy and Department of OBG, Justice K.S. Hegde Charitable Hospital of NITTE (Deemed to be University), Mangaluru, Karnataka, India. Approval from Institutional Ethics committee was obtained and written informed consent was collected from patients prior to the study. 5 ml of venous blood was drawn from overnight fasted patients for biochemical and genetic analysis. A data extraction sheet with general information on socioeconomic status, demographic characteristics, family history of diabetes and hypertension, education level, parity, and history of GDM, were obtained.
2.2 Biochemical analysis
Blood samples collected in a 2 ml plain vial were used for assaying leptin, insulin, C-Peptide, and lipid profile. Fasting leptin, insulin, and C-peptide were assayed by ELISA [Sincere biotech, China] Lipid profile fasting blood sugar was analyzed using a fully automated chemistry analyzer, CobasC311 [Roche Diagnostics, Switzerland]. Insulin resistance was calculated by the homeostasis model assessment (HOMA) model (Arora et al., 2016). Both insulin and C-peptide based insulin resistance models were constructed using the formulae mentioned in Table 1.
HOMA –IR
(fasting glucose × fasting insulin)/22.5; insulin expressed in μ U/L, glucose in mmol/l.
HOMA B cell
20× insulin/(Fasting blood glucose −3) ; FBS in mmol/l
HOMA B 1%
20× Insulin/Fasting Plasma Glucose- 3.5 ; FBS in mmol/l
QUICKI
1/(log G + log I)
C-peptide insulin resistance, CIR
20/(Glucose X C-Peptide); glucose and C-peptide in mmol/L
2.3 Genetic analysis
Three milliliters EDTA (2%) blood was utilized for DNA extraction and genotyping. DNA was extracted from leukocytes by using a DNA extraction mini kit. The quantification and purity of DNA was checked using spectrophotometer (ratio of OD260/OD280). Genotyping of all genes were analyzed by Polymerase chain reaction – Restriction fragment length polymorphism (PCR-RFLP) technique (Suriyaprom et al., 2014). The PCR was carried out using suitable forward and reverse primers for LEPR (Gln223Arg) alleles. MspI restriction enzyme was used to digest the amplified product. The reaction mixtures were run in gel electrophoresis on 3% agarose gel and visualized by ethidium bromide staining (Fig. 1). Details of primers and restriction enzymes used are depicted in Table 2.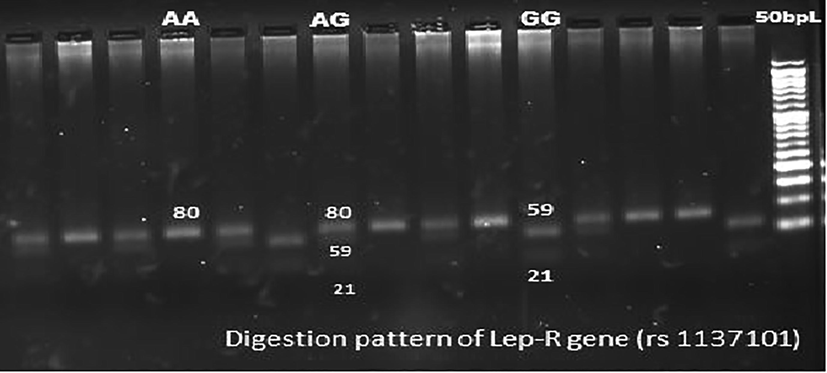
Sample pattern of distribution of alleles of leptin receptor gene (LEPR).
SNP
Location (Base change)
Forward primer reverse primer
PCR program
PCR fragment length (bp)
Restriction enzyme, incubation temp.
Allele: RFLP fragment size
LEPR
(rs1137101)Exon 6
(A > G)5′-AAACTCAACGACACTCTCCTT-3′
5′-GAACTGACATTAGAGGTGAC-3′93 °C,45′
57 °C,30′
72 °C,30′
35 cycles80
MspI,
37 °CAllele A:80
Allele G:59 + 21
2.4 Statistical analysis
The statistical analysis was performed using SPSS 23.0 software. Categorical data was expressed in percentage and continuous data was expressed as mean ± standard deviation (SD). Hardy-Weinberg Equilibrium (HWE) for the LEPR gene variant among cases and controls were carried out and comparisons of allelic frequencies distributions between different variants were done using the chi-square test. Comparison between biochemical parameters between cases and controls was done by Mann Whitney U test. Spearman's correlation test was used to find the correlation between biochemical parameters. Odd’s ratio was computed to study the extent of risk of leptin gene polymorphism in causing GDM. Statistically significant value was fixed at ‘p’ value < 0.05. ROC curves were constructed to assess whether leptin levels and IR models can be used as markers to predict GDM.
3 Results
GDM patients of 29.62 ± 4.3 years and normal glucose tolerant pregnant women of 27.08 ± 3.73 years were recruited in the study. Their mean BMI was 25.78 ± 6.84 kg/m2 and 25.86 ± 5.86 kg/m2 respectively. The gestational age of the subjects was 25.87 ± 1.21 weeks and 26.1 ± 1.54 weeks respectively. The association between LEPR gene polymorphism and GDM was not significant when analysed with chi-square statistical analysis followed with Yate’s correction 0.3096 and p = 0.577. However, Odd’s ratio showed that individuals with the ‘A’ allele were at 1.25 times higher risk of developing GDM.
Insignificant association was observed between the LEPR gene polymorphisms and leptin levels with Chi-square test with Yate's correction being 0.0626 and 0.742 respectively (P = 0.802 and P = 0.388 respectively). However, subjects with the 'G' allele for the LEPR gene showed twice the risk of hyperleptinemia. Insignificant association between LEPR gene polymorphisms and insulin resistance (chi-square = 0.1419p = 0.706) was noted. Odd's ratio showed 1.2 times the risks of IR in patients with ‘A’ allele for LEPR genes.
Table 3 shows the allelic distribution of LEPR (rs1137101) gene variants in GDM patients. There was no significant deviation of rs1137101 variants from HWE in GDM cases (p > 0.05), suggesting that alleles were in equilibrium. AA: Homozygous dominant, AG: Heterozygous, GG: Homozygous Recessive. LEPR Cases: Frequency range: ‘A’ allele = 0.48; ‘G’ allele = 0.515. Controls: p allele frequency: 0.42, q allele frequency: 0.58.
Gene variant
Frequency of pattern in LEPR gene (%) (rs1137101)
Chi -square value
Cases
Controls
AA
Observed
27
25
1.94 (Cases)
Expected
23.5
20.39
AG
Observed
43
46
3.15 (Control)
Expected
49.95
55.2
GG
Observed
30
42
Expected
26.5
37.38
Association between GDM and LEPR Gene polymorphism
0.3096
p = 0.577
Comparison of biochemical parameters showed significantly high (p < 0.0001) FBS in GDM cases. Fasting C peptide also was significantly higher in cases (p = 0.0014). Fasting serum insulin and leptin levels were insignificantly low in GDM patients (p = 0.6968 and p = 0.213). There was no significant difference between lipid profile parameters like TG, TC, HDL, LDL, and VLDL levels between cases and controls (p = 0.069, p = 0.12, p = 0.73, p = 0.255, and p = 0.06 respectively) (Table 4).
Parameters
GDM
Control
p value
Spearman’s Correlation
r value
p value
Mean age (year)
29.62 ± 4.3
27.08 ± 3.73
BMI (kg/m2)
25.78 ± 6.84
25.86 ± 5.86
Gestational age(week)
25.87 ± 1.21
26.1 ± 1.54
Baby birth weight (kg)
3.8 ± 1.10
3.22 ± 0.55
FBS sugar (mg/dl)
136.14 ± 34.99
90.58 ± 24.4
<0.0001
Fasting Insulin μIU/L
5.46 ± 11.95
7.13 ± 6.74
0.6968
−0.606
0.0005*
C-peptide(nmol/L)
2.17 ± 1.71
1.57 ± 1.55
0.0014
−0.203
0.29
Leptin(ng/ml)
57.33 ± 23.96
63.11 ± 25.46
0.213
–
–
TG(mg/ml)
237.74 ± 97.81
246.68 ± 73.55
0.069
–
–
TC (mg/ml)
222.32 ± 49.96
231.45 ± 46.04
0.12
–
–
HDL (mg/ml)
51.43 ± 12
54.55 ± 12.4
0.73
–
–
LDL (mg/ml)
149.07 ± 50.24
154.7 ± 44.9
0.255
–
–
VLDL (mg/ml)
47.42 ± 19.54
48.6 ± 13.68
0.06
–
–
HOMA IR
2.94 ± 1.64
1.63 ± 0.89
0.604
−0.4856
0.0065*
HOMA B cell
35.78 ± 10.55
75.73 ± 30.89
<0.0001
−0.4262
0.0211*
HOMA 1% B cell
42.62 ± 13.75
114.03 ± 56.99
<0.0001
−0.4274
0.02*
QUICKI
2.39 ± 0.46
8.89 ± 3.8
0.466
0.501
0.0056*
HOMA IRC
0.7 ± 0.12
0.36 ± 0.14
<0.0001
−0.214
0.27
HOMA B cell-C
11.03 ± 3.07
17.31 ± 7.25
0.0045
−0.030
0.876
HOMA 1% B cell-C
13.58 ± 8.16
24.65 ± 4.5
0.0002
−0.034
0.859
CIR
3.13 ± 1.07
11.47 ± 4.17
<0.0001
−0.214
0.265
Comparison of IR models among cases and controls showed a significantly low (p < 0.0001) HOMA B cell and HOMA 1% B cell (insulin based) as well as significantly high (p < 0.0001) HOMA B cell, HOMA 1% B cell (C peptide-based) in cases. It was also observed that C peptide-based insulin resistance models (HOMA IR -C and CIR) were significantly high (p < 0.0001) in cases as compared to controls (Table 4). However, there was no significant difference in insulin-based HOMA IR and QUICKI, between cases and controls (p = 0.604 and p = 0.466).
Biochemical parameters were compared among cases with different genotypes of LEPR gene, AA, AG, and GG, insignificant difference was observed in Insulin, C peptide, leptin, TG, TC, HDL, LDL, and VLDL (p values being 0.22, 0.66, 0.237, 0.65, 0.60, 0.40, 0.62, 0.667 respectively) (Table 4).
IR models, HOMA IR, HOMA 1%B cell, QUICKI, HOMA IRC, HOMA B cell- C, HOMA 1% B cell -C and CIR (both insulin and C peptide-based) in different genotypes of LEPR didn’t vary significantly (p values being 0.27,0.198,0.185,0.784,0.805,0.59 respectively) (Table 4). However, HOMA B cell significantly varied among LEPR genotypes (p < 0.0001), values being double in AA genotype, compared to AG (p < 0.05), 10 times higher in AA compared to GG (p < 0.0001). The value was four times higher in AG compared to GG (p < 0.01).
Biochemical parameters were compared between insulin resistant cases (HOMA IR > 2.4) compared to GDM patients with normal insulin sensitivity. Serum C-peptide, TG, and VLDL were significantly higher in IR cases (p values being 0.0001, 0.022, and 0.034 respectively) (Table5). Data expressed in Mean ± SD, * p-value significant.
Parameters
Insulin resistant cases
Cases with Normal Insulin sensitivity
p-value
C-peptide(nmol/L)
3.15 ± 1.85
1.72 ± 1.44
0.0001*
Leptin(ng/ml)
56.31 ± 24.45
57.79 ± 23.91
0.99
TG(mg/ml)
285.53 ± 129.76
217.26 ± 71.56
0.022*
TC (mg/ml)
216.5 ± 35.26
224.31 ± 55.11
0.40
HDL (mg/ml)
50.56 ± 12.01
51.8 ± 12.07
0.833
LDL (mg/ml)
137.13 ± 46.85
154.19 ± 51.29
0.164
VLDL (mg/ml)
56.66 ± 26.23
43.45 ± 14.34
0.034*
Correlation studies showed a significant negative correlation between FBS and leptin (r = -0.232, p = 0.0237). A significant positive correlation was observed between leptin and TG, TC and VLDL levels (r = 0.219, p = 0.0325, r = 0.248, p = 0.0150 and r = 0.217, p = 0.0347 respectively) among GDM patients.
Significant negative correlation was noted between leptin levels and insulin, HOMA IR, HOMA B cell, HOMA 1%B cell, and QUICKI among insulin-resistant GDM patients (Table 6). *p-value significant.
Parameters
Spearman’s correlation value
p-value
Insulin
−0.606
0.0005*
C peptide
−0.203
0.29
HOMA IR
−0.4856
0.0065*
HOMA B cell
−0.4262
0.0211*
HOMA 1% B cell
−0.4274
0.02*
QUICKI
0.501
0.0056*
HOMA IRC
−0.214
0.27
HOMA B cell-C
−0.030
0.876
HOMA 1% B cell-C
−0.034
0.859
CIR
−0.214
0.265
ROC was constructed to assess the utility of leptin as a marker of GDM. The area under the curve was 0.446, with a sensitivity of 49.5% and specificity of 60.7% at a cut-off value of leptin being 52.7 ng/ml (Fig. 2). ROC was also constructed to assess if any of the IR models could be used to predict GDM. It was observed that only HOMA IRC was a better marker with AUC = 0.679, with 37% sensitivity and 87% specificity at a cut-off value of HOMA IRC being 0.7. However other IR models were found to be poor predictors of GDM (Fig. 3).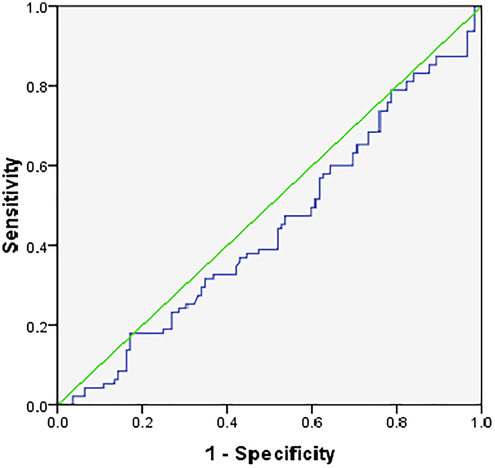
ROC for leptin as a marker for GDM.
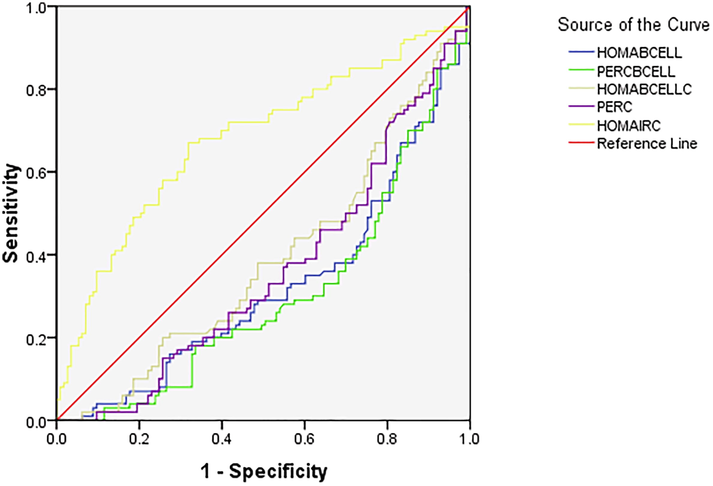
ROC of IR models for prediction of GDM.
There was no significant association between the birth weight of the babies and different genotypes (p = 0.440). The BW of the babies also didn’t differ significantly between the different genotypes (p = 0.124). Patients with AA genotypes were 1.5 times at risk of low birth weight babies.
4 Discussion
Insignificant association was noted between LEPR (Gln223Arg) polymorphisms and GDM in our study population. However, subjects with homozygous dominant AA allele were at higher risk of (1.25 times) developing GDM. There was no significant difference between allele distribution between cases and control. On analyzing LEPR (Gln223Arg) gene, allele frequencies noted in the present study were following the ones described in different other populations by Van Rossum et al. (2003). However, the lack of significant association between polymorphisms of these genes and GDM could be due to the variation in the genetic patterns in different populations.
The risk of hyperleptinemia was twice among patients with the 'G' allele as compared to the homozygous 'A' allele for the LEPR gene. An association between LEPR Gln223Arg gene polymorphism and leptin levels were found in the Thai population (Suriyaprom et al., 2014) and Dutch population (Van Rossum et al., 2003). However, no such association was found in Turkish subjects (Komsu-Ornek et al., 2012) and in Chinese population (Yang et al., 2016). No significant association was present between the LEPR Gln223Arg polymorphism and other metabolic parameters in our study population which are in agreement with the findings of the meta-analysis (Heo et al., 2002). Insignificant difference was noted in the serum leptin concentrations between GDM patients and subjects with NGT (Table 4). However, hyperleptinemia was observed in both cases and controls, considering 2.5–21.8 ng/ml as the normal reference range for serum leptin. ROC analysis showed that leptin is not a good marker to predict GDM.
As leptin may have a major role in maternal metabolism and maternal glucose homeostasis regulation, plasma leptin levels may be an important marker for predicting GDM. However, reports available on the levels of maternal leptin in GDM, are conflicting. Studies have reported elevated leptin levels in GDM (Gao et al., 2008; Ishak et al., 2003), diminished leptin levels, or insignificant differences in leptin levels among GDM patients (Mokhtari et al., 2011; Fruscalzo et al., 2015). A study by Noureldeen et al. (2014) reported no significant change in leptin levels at 2nd trimester but diminished leptin levels at the 3rd trimester among GDM patients. Qiu et al. (2004) and colleague, showed that risk of GDM raised by 20% with each 10 ng/ml rise in the leptin concentration in early pregnancy. Mutation in leptin receptor Gln223Arg results in impaired signaling capacity of leptin receptors (Hoffstedt et al., 2002). Placenta may be the main contributor of the altered plasma leptin concentration in pregnancy (Bi et al., 1997). The human placental promoter region might be differently regulated compared to adipose tissue. The fetus may be contributing to the maternal leptin load from the early second trimester (Christou et al., 2002). A positive correlation between umbilical cord plasma leptin and the BW of newborns were also reported (Gross et al., 1998).
In our study, insignificant difference in insulin levels between cases and controls were noted, but C-peptide was significantly higher (p = 0.0014). Comparison of IR models showed a significantly low insulin-based IR models. It was also observed that C peptide-based insulin resistance models (HOMA IR -C and CIR) were significantly high (p < 0.0001) in cases as compared to controls (Table 4). Since it has been proved that C-peptide is a better marker of endogenous production of insulin and the C-peptide-based IR model is a good indicator of insulin resistance, we can conclude that GDM patients have higher IR compared to normal glucose tolerant pregnant women.
It has been suggested that as gestation progresses, insulin secretion increases, with a maximum being in the third trimester (Catalano et al., 1999), however insulin sensitivity declines by70% (Sivan et al., 1999). In GDM, deterioration of glucose tolerance is due to reduced insulin secretion and chronic insulin resistance. The correlations between leptin and IR were confirmed in some studies (Ozcimen et al., 2008; Yilmaz et al., 2010), but contradicted in a few studies, suggesting contradictory results.
In our study, there was no significant difference between lipid profile parameters like TG, TC, HDL, LDL, and VLDL levels between cases and controls (Table 4). On comparing lipid profile among cases with different genotypes leptin receptor genes, AA, AG, and GG, no significant difference was observed among them. A significant negative correlation between FBS and leptin in our study supports the presence of hyperleptinemia in GDM. A significant positive correlation was observed between leptin and TG, TC, and VLDL levels among GDM patients. A significant negative correlation was noted between leptin levels and insulin, insulin-based IR models, HOMA IR, HOMA B cell, HOMA 1%B cell, and QUICKI among insulin resistant GDM patients (Table 6). GDM, insulin resistance and dyslipidemia may make a vicious cycle. GDM patients may have higher TG levels and low HDL compared to normal pregnant women (Herbert, 2001). Insignificant difference was reported in total cholesterol, HDL and apolipoprotein between. GDM and normal pregnancy (Wauters et al., 1998). Leptin synthesis is induced by hyperglycemia, hyperlipidemia, and a replete fat mass, and also leptin suppresses insulin production (Wauters et al., 1998). A positive correlation was noted between leptin & TG, negative correlation between HDL and leptin (Ceddia et al., 2002).
It was also observed in the present study that there was insignificant association between leptin receptor gene polymorphisms and insulin resistance. However, Odd’s ratio showed 1.2 times the risks of IR in patients with ‘A’ allele for leptin and leptin receptor genes. Biochemical parameters were compared between insulin resistant cases (HOMA IR > 2.4) compared to GDM patients with normal insulin sensitivity. Serum C-peptide, TG, and VLDL were significantly higher in IR cases (Table 4). Some studies suggest that leptin may regulate entire glucose homeostasis in pregnancy (Al-Daghri et al., 2002). Maternal leptin levels rise 2–3 fold above the non-pregnant values with the maximum being at 28 weeks of gestation, the reason may be reason may be an elevation of leptin synthesis by adipocytes in addition to elevated IR (Laivuori et al., 2000). Leptin regulates insulin-mediated glucose metabolism in skeletal muscle as well as gluconeogenesis in liver (Rossetti et al., 1997; Donahue et al., 1999). Epidemiological studies have reported positively associated plasma leptin concentrations and insulin resistance in men and non-pregnant women (Donahue et al., 1999).
5 Conclusion
It could be concluded from the study that, there is an insignificant association between LEPR Gln223Arg alleles and gestational diabetes, leptin concentration, and insulin resistance. However, patients with the 'G' allele for LEPR were more prone for hyperleptinemia. C-peptide based insulin resistance models were elevated in GDM patients. Subjects with homozygous dominant, 'AA' of LEPR showed higher insulin resistance, HOMA B cell compared to other genotypes. Leptin levels was found to bear a positive correlation with triglycerides, total cholesterol, and VLDL levels in GDM.TG and VLDL were significantly elevated in IR-resistant GDM patients. Leptin showed a significant negative correlation with insulin levels, HOMA-IR, and a positive correlation with QUICKI in IR GDM cases. The study can establish a cycle of gene polymorphism altering leptin levels which in turn can alter insulin secretion and insulin resistance, contributing to dyslipidemia of pregnancy as well as gestational diabetes.
6 Limitation of the study
Leptin resistance may influence the leptin levels, insulin resistance and lipid profile, however, leptin resistance is not taken into consideration in the present study.
Acknowledgements
Sincere thanks to Dr. Suchetha Kumari, Molecular Genetics Laboratory in charge for the permission to carry out the work. The authors acknowledge the funding from Research Society for the Study of Diabetes in India.
Declaration of Competing Interest
The authors declare that they have no known competing financial interests or personal relationships that could have appeared to influence the work reported in this paper.
References
- Role of leptin in glucose metabolism in type 2 diabetes. Diabet. Obesit. Metabol.. 2002;4(3):147-155.
- [Google Scholar]
- An investigation of the associations among sleep duration and quality, body mass index and insulin resistance in newly diagnosed type 2 diabetes mellitus patients. Therapeutic Advances in Endocrinology and Metabolism. 2016;7(1):3-11.
- [Google Scholar]
- Identification of a placental enhancer for the human leptin gene. J. Biol. Chem.. 1997;272(48):30583-30588.
- [Google Scholar]
- Longitudinal changes in glucose metabolism during pregnancy in obese women with normal glucose tolerance and gestational diabetes mellitus. Am. J. Obstet. Gynecol.. 1999;180(4):903-916.
- [Google Scholar]
- Analysis of paradoxical observations on the association between leptin and insulin resistance. FASEB J.. 2002;16(10):1163-1176.
- [Google Scholar]
- Christou, H., Serdy, S., & Mantzoros, C. S. (2002). Leptin in relation to growth and developmental processes in the fetus. In Seminars in reproductive medicine (Vol. 20, No. 02, pp. 123-130). Copyright© 2002 by Thieme Medical Publishers, Inc., 333 Seventh Avenue, New York, NY 10001, USA.
- Is fasting leptin associated with insulin resistance among nondiabetic individuals? The miami community health study. Diabetes Care. 1999;22(7):1092-1096.
- [Google Scholar]
- Second trimester maternal plasma and amniotic fluid adipokines in women who will develop gestational diabetes mellitus. Gynecol. Endocrinol.. 2015;31(12):934-938.
- [Google Scholar]
- Variations of tumor necrosis factor-α, leptin and adiponectin in mid-trimester of gestational diabetes mellitus. Chin. Med. J.. 2008;121(8):701-705.
- [Google Scholar]
- Plasma leptin concentrations in newborns of diabetic and nondiabetic mothers. Am. J. Perinatol.. 1998;15(04):243-247.
- [Google Scholar]
- A meta-analytic investigation of linkage and association of common leptin receptor (LEPR) polymorphisms with body mass index and waist circumference. Int. J. Obes.. 2002;26(5):640-646.
- [Google Scholar]
- Herbert PN. Eating Disorders. In: Andreoli TE, Carpenter ChJ, Griggs RC, Loscalzo J. Cecil Essentials of Medicine, 5thed. W.B. Saunders Company 2001;59,515-521.
- A polymorphism in the leptin promoter region (-2548 G/A) influences gene expression and adipose tissue secretion of leptin. Horm. Metab. Res.. 2002;34(07):355-359.
- [Google Scholar]
- Gestational diabetes among Aboriginal Australians: prevalence, time trend, and comparisons with non-Aboriginal Australians. Ethn. Dis.. 2003;13(1):55-60.
- [Google Scholar]
- Gestational diabetes and the incidence of type 2 diabetes: a systematic review. Diabetes Care. 2002;25(10):1862-1868.
- [Google Scholar]
- Leptin receptor gene Gln223Arg polymorphism is not associated with obesity and metabolic syndrome in Turkish children. Turk. J. Pediatr.. 2012;54(1):20-24.
- [Google Scholar]
- Leptin during and after preeclamptic or normal pregnancy: its relation to serum insulin and insulin sensitivity. Metabolism. 2000;49(2):259-263.
- [Google Scholar]
- Do adiponectin, TNFα, leptin and CRP relate to insulin resistance in pregnancy? Studies in women with and without gestational diabetes, during and after pregnancy. Diabet. Metabol. Res. Rev.. 2006;22(2):131-138.
- [Google Scholar]
- Summary and recommendations of the fifth international workshop-conference on gestational diabetes mellitus. Diabet. Care. 2007;30(Supplement 2):S251-S260.
- [Google Scholar]
- Evaluation of the serum leptin in normal pregnancy and gestational diabetes mellitus in Zahedan, southeast Iran. Arch. Gynecol. Obstet.. 2011;284(3):539-542.
- [Google Scholar]
- Maternal leptin, adiponectin, resistin, visfatin and tumor necrosis factor-alpha in normal and gestational diabetes. Indian Journal of Clinical Biochemistry. 2014;29(4):462-470.
- [Google Scholar]
- Diagnosis of gestational diabetes mellitus by use of the homeostasis model assessment-insulin resistance index in the first trimester. Gynecol. Endocrinol.. 2008;24(4):224-229.
- [Google Scholar]
- Increased maternal plasma leptin in early pregnancy and risk of gestational diabetes mellitus. Obstetrics & Gynecology. 2004;103(3):519-525.
- [Google Scholar]
- Short term effects of leptin on hepatic gluconeogenesis and in vivo insulin action. J. Biol. Chem.. 1997;272(44):27758-27763.
- [Google Scholar]
- Effect of insulin on fat metabolism during and after normal pregnancy. Diabetes. 1999;48(4):834-838.
- [Google Scholar]
- Measurement of the levels of leptin, BDNF associated with polymorphisms LEP G2548A, LEPR Gln223Arg and BDNF Val66Met in Thai with metabolic syndrome. Diabetol. Metab. Syndrome. 2014;6(1):1-9.
- [Google Scholar]
- Genetic variation in the leptin receptor gene, leptin, and weight gain in young Dutch adults. Obes. Res.. 2003;11(3):377-386.
- [Google Scholar]
- Are leptin levels dependent on body fat distribution in obese men and women? Eating and Weight Disorders-Studies on Anorexia. Bulimia Obes.. 1998;3(3):124-130.
- [Google Scholar]
- Relationships between plasma leptin levels, leptin G2548A, leptin receptor Gln223Arg polymorphisms and gestational diabetes mellitus in Chinese population. Sci. Rep.. 2016;6(1):1-6.
- [Google Scholar]
- Assessment of insulin sensitivity/resistance and their relations with leptin concentrations and anthropometric measures in a pregnant population with and without gestational diabetes mellitus. J. Diabet. Complic.. 2010;24(2):109-114.
- [Google Scholar]


