

Translate this page into:
A bibliometric analysis of inverse optimization
⁎Corresponding author. yusufstats@gmail.com (Ahmad Yusuf Adhami)
-
Received: ,
Accepted: ,
This article was originally published by Elsevier and was migrated to Scientific Scholar after the change of Publisher.
Peer review under responsibility of King Saud University.
Abstract
This paper presents an overview of inverse optimization through a bibliometric approach. The goal of this study was to discover research trends and knowledge growth in the field of inverse optimization. We collected the most cited articles and documents related to the topic in the SCOPUS database. We analyzed and conducted bibliometric analyses, such as citation analysis, publication counts, and co-occurrence analysis on top articles, authors, countries, institutions, and journals, using the VOSviewer software. The results of our analyses are presented as comprehensive network maps, in which we can identify the previous and current publication trends as well as forecast future publishing trends, in the context of inverse optimization.
Keywords
Inverse Optimization
Bibliometric Analysis
Citation Analysis
VOSviewer
Operations Research

1 Introduction
Inverse optimization and its problems have evinced great interest among researchers in recent years. Inverse optimization is a relatively recent field of research, with applications in various fields. Many of its applications, including those in geophysical sciences, transportation, healthcare, power systems, economics, portfolio optimization, traffic equilibrium, and isotonic regression, have been discovered over the last 20 years. In most optimization problems, there is an objective function and constraints, and both the parameters are known. Solving the problem provides the optimal solution. There is another scenario where the values of these parameters are not known but an optimal solution is available. In such cases, inverse optimization is used to find out the unknown parameters.
Inverse optimization is a process that is the opposite or reverse of mathematical optimization. In mathematical optimization, we compute optimal decisions based on objectives and constraints. The general formula for mathematical optimization is given as follows:
Contrary to this, inverse optimization focuses on developing the best objective functions or constraints with the help of decision variables that are approximately or exactly optimal. The general formula for inverse optimization is given as follows:
Inverse optimization has diverse applications in the areas, such as transportation, healthcare, power sector, finance, and economics. In each of the domains, we observe a data set of decisions and build a decision-making model that best reproduces these observations. The decision data can include individual routing choices, electricity consumption patterns, investment decisions, or medical treatments. The inverse optimization model can be used to estimate route-choice preferences, utility functions, investment risk preferences, or clinical treatment objectives that are most consistent with the observed decisions.
In this study, we carried out quantitative and qualitative analyses of inverse optimization, by performing a bibliometric analysis. Bibliometric analysis is a statistical tool used to examine books, papers, and other publications in terms of authorship, sources, subjects, geographical origins, citations, and so on. It helps in studying and identifying research trends and the growth of knowledge. It also helps in identifying journals with the greatest impact in various research areas. It is useful for understanding the structure of the knowledge base in a particular domain, presenting strong and weak parts of a research area, and for providing quantitative analysis of academic literature. Different types of bibliometric techniques are citation analysis, citation indexing, self-citation and co-authorship, publication counts, direct citations, bibliographic coupling, and co-citation coupling. The VOSviewer software, developed by Nees Jan van Eck and Ludo Waltman of the Centre for Science and Technology Studies at Leiden University, is used for bibliometric analysis.
2 Background Literature
Inverse optimization was well-studied during the 1980s. Many authors have attempted to explore the concept and use of inverse optimization in real-life applications and a wide range of literature is dedicated to inverse optimization problems and related solution methods. Ahuja and Orlin presented the most significant work on inverse optimization. Tarantola (1987) discussed and published the theory of inverse problems in an introductory book, which aids in the study of inverse problems in geophysical sciences.
Several authors have studied different problems of network models using discrete optimization procedures. Among different network problems, minimum spanning tree, minimum cost network flow, and maximal capacity flow have been widely studied and a few of them are mentioned here. Burton and Toint were the first to propose inverse optimization for the shortest path problem (1992, 1994). Cai and Yang (1994) improved on the inverse shortest path problem, which was afterward investigated by Xu and Zhang (1995), Zhang et al. (1995), and Burton et al. (1997). The inverse maximum capacity path problem was invented by Yang and Zhang (1998). The inverse spanning tree issue was invented by Sokkalingam et al. (1996), and Ahuja and Orlin (1998). Hu and Liu (1995) made significant contributions to the inverse shortest arborescence problem. He discussed the inverse problem of the weighted shortest path problem and provided an O(n3) combinatorial technique for solving the inverse weighted shortest path problem. Huang and Liu (1995a) developed an inverse bipartile k-matching problem.
Some of the real-life problems are also investigated as inverse optimization problems and their outcomes are analyzed. Cai and Li (1995) showed the idea of the inverse matroid intersection problem, whereas Cai et al. established the concept of the inverse polymatroidal flow issue (1996). Ahuja and Orlin proposed the inverse sorting problem (1997). The inverse minimum cut problem was brought to by Yang et al. (1997) and Zhang and Cai (1998). Inverse minimum cost flow problems were contributed to by Huang and Liu (1995b) and Sokkalingam (1996). Inverse maximum flow and minimum cut problems were developed by Yang et al. (1997). He considered both the inverse problems in combinatorial optimization, and finally proposed a strong polynomial algorithm for the two inverse problems. Zhang and Cai (1998) created an inverse issue of minimal cuts to show how strong polynomial algorithms may effectively handle inverse problems of minimum cuts by immediately transforming them into minimum-cost circulation problems. Yang and Zhang (1998) proposed the inverse maximum capacity problem. As special examples, their model includes the inverse maximum capacity spanning tree problem, the inverse maximum capacity path problem, and so on. They turned the problem into a minimum weight cut set problem and demonstrated that if an effective algorithm for identifying the least weight cut set is available, it can be solved efficiently. Pt Sokkalingam et al. (1999) provided the idea of solving inverse spanning tree problems through network flow techniques. Ahuja and Orlin (2000) proposed a faster algorithm for the inverse spanning tree problem. Cai et al. (2000) introduced the idea for inverse problems of submodular functions on digraphs, and they demonstrated that the problem may be expressed as a combinatorial linear program and then translated into a lowest cost circulation problem, and solved it in strongly polynomial time. They are also extending this version of inverse problems with multiple feasible solutions.
Various applications of inverse optimization are reported in the binary and integer optimization problems. Ahuja and Orlin (2002) provided the concepts of combinatorial algorithms for inverse network flow problems. Iyengar and Kang (2003) discussed the applications of inverse conic programming by considering the special classes of conic programs having similar duality, and showed that the corresponding inverse problems are efficiently solvable. They also discussed inverse conic programming in portfolio optimization, utility function identification, and inverse quadratically constrained quadratic programming. Heuberger (2004) suggested the survey problems, methods, and results on inverse combinatorial optimization, after studying several problems and finally considering a combinatorial optimization problem. He developed the corresponding inverse optimization problem by finding minimal adjustment of the cost function to obtain the optimal solution. By analyzing the integer programming version of inverse optimization, Schaefer (2009) proposed the integer programming version of inverse optimization. He presented a polyhedral description of the set of inverse feasible objectives and two algorithmic approaches to solve problems utilizing super-additive duality.
Ayer (2015) implemented inverse optimization for assessing emerging technologies in breast cancer screening by focusing on the optimal sensitivity and specificity values for a screening policy. Cao and You (2017) proposed the idea of the inverse optimization of exhaust hood by using artificial neural networks, genetic algorithms, and computational fluid mechanics simulation. By examining inverse optimization in a context where measurements of the optimal solutions of a convex optimization problem are contaminated by noise, Aswani et al. (2018) created inverse optimization with noisy data. Ghobadi et al. (2018) developed robust inverse optimization by assigning an objective function that is robust against mis-specifications of the decision-maker’s uncertain behavior. A unified framework for closed-form solutions, geometry, and goodness of fit using inverse optimization is provided by Timothy Chan et al. (2019).
Timothy and Neal (2020) developed an inverse optimization model for the recovery of constraint parameters. Bennet and Sebastian (2021) developed the idea of inverse multi-objective optimization, where they presented a method to construct the objective function vector of an unconstrained multi-objective optimization problem such that the Pareto critical set contains a given set of data points that follows KKT multipliers. Kovács (2021) proposed an inverse optimization approach to the identification of electricity consumer models where the parameters of electricity consumer models are formulated as linear programs are induces from historical samples using an inverse optimization strategy. Based on sample data, Rummukainen (2021) investigated the practicability of inverse optimization as a method for automating warehouse management. Ajayi et al. (2022) developed an inverse optimization approach as objective selection for cancer treatment.
Although a lot of literature is available in different domains of studies, some well-known studies on inverse optimization are discussed above in a systematic manner. In the present study, we are providing a quantitative analysis of academic literature; therefore, we conducted a bibliometric analysis related to the topic. This study provides an understanding of the structure of knowledge-base in a particular domain.
3 Methodology
Every analysis needs data, which can be obtained from various available bibliographic data sources, such as Web of Science (WoS), SCOPUS, Google Scholar, Dimensions, Lens, and PubMed. We employed SCOPUS for our study because it is the largest abstract and citation database, is owned by Elsevier, and has a wider coverage of bibliometric information compared with that in other sources. It includes 82 million or more documents, 1.7 billion or more cited references, 17 million or more author profiles, 234 thousand or more publications, 7,000 publishers, and 80,000 or more institution profiles.
Step 1: SCOPUS Search and Extraction of data:
This is the most crucial phase of the study, which ensures that the data we collect are valid for our analysis, and therefore must be performed very cautiously.
On the home page of SCOPUS, we searched the term “Inverse Optimization” in article titles, abstracts, and keywords. We ensured keeping our topic name within inverted commas, to avoid getting unrelated search results including either “inverse” or “optimization.” The search resulted in papers in which the term “Inverse Optimization” appears in the article title, abstract, or keywords.
We retrieved 887 documents related to inverse optimization (dated March 15, 2022). We selected all the papers (there is an option for deselecting papers if they are deemed irrelevant) and exported them in CSV Excel type. We checked the columns for the information that we needed. We selected the citation information columns to include authors’ names, authors’ id, document title, year, EID, source title, volume, issue, pages, citation count, source, document type, publication stage, DOI, and whether it was open access or not. Affiliations, serial identifiers (ISSN), PubMed ID, publisher, editor(s), language, correspondence address, and abbreviated source title were all given in the bibliographical information columns. The columns of abstract and keywords included abstract, author–keywords, and index keywords. The columns of funding details included number, acronym, sponsor, and funding text. Finally, we checked the reference columns and exported them, and saved them as a csv file.
Step 2: Analysis of data:
Our next step, after getting the data, was to vet and analyze them thoroughly. A detailed analysis of the data can present several conclusions and interpretations. To get the number of publications on inverse optimization for each year, we separately selected the “year” column and “cited by” column, and arranged them in order of size, smallest to greatest. We applied the formula in Excel to get the year-wise number of publications and number of citations. From the information, thus obtained, we could easily visualize and predict the growth and trend of a number of publications in the current and coming year using a bar chart.
Step 3: Network visualization through VOSviewer:
We were interested in carrying out the bibliometric analysis of inverse optimization through citation analysis. Citation analysis is the network that shows who has cited whom, and it can be based on authors, documents, etc. In the present study, we employed citation analysis based on countries, organizations, authors, journal sources, and references. We extended our study to find out bibliometric analysis of keyword co-occurrence in title and abstract and the co-occurrence of author–keywords. This was expected to give us a prominent and clear picture of the future trend of inverse optimization. The number of times two keywords appear together in a publication's title, abstract, or keywords list is recognized as the co-occurrence rate.
All these analyses were carried out using the VOSviewer software. Once we open the software, we get an option to create a new file, after which we are required to select the option “create a map based on bibliographic data.” Subsequently, we have to choose the option “read data from bibliographic database files,” which leads to a window where we need to upload our file containing downloaded and extracted data, that is, “scopus.csv” under the section Scopus files. There are also options for selecting files from Web of Science, dimensions, lens, and PubMed. Co-authorship analysis, co-occurrence analysis, citation analysis, bibliographic coupling analysis, and co-citation analysis are just a few of the analyses available on this page. We need to select the appropriate analysis type and unit type. Documents, sources, authors, organizations, and countries are the various types of unit analyses.
Here, we carried out a different type of analysis using different unit types. For example, we carried out a citation analysis of authors to obtain data on the cited authors regarding the total number of publications, most often cited articles, links of the authors, total link strength, cluster of the authors, average citation of the authors, etc. All these data can be extracted into an Excel csv file, and we can easily analyze and interpret the data with the help of tables. However, VOS viewer produces a comprehensive network diagram of citation author analysis with all these details in the next step. The network diagrams are comprised of nodes and arcs. Different colors and sizes of these nodes and arcs are for identifying and interpreting different clusters, links, and strengths of corresponding analyses.
4 Findings and Discussions
-
Year-wise pattern of publications and citations:
Fig. 1 shows a graphical representation of publication trends in inverse optimization over the years, where the total number of publications is mapped against the corresponding year. It also represents the publication trends, where the total number of citations and publications are mapped against the corresponding year. The graph provides a good estimate of the research trend on inverse optimization. It also predicts probable research trends in the future. The graph shows that the first document related to inverse optimization was published in 1979. The number of papers is increasing each year; however, there was a slight fall in 2001, 2007, 2014, 2016, and 2020. The maximum number of publications, around 91 documents, occurred in 2021, followed by 79 documents in 2019, and 76 documents in 2018.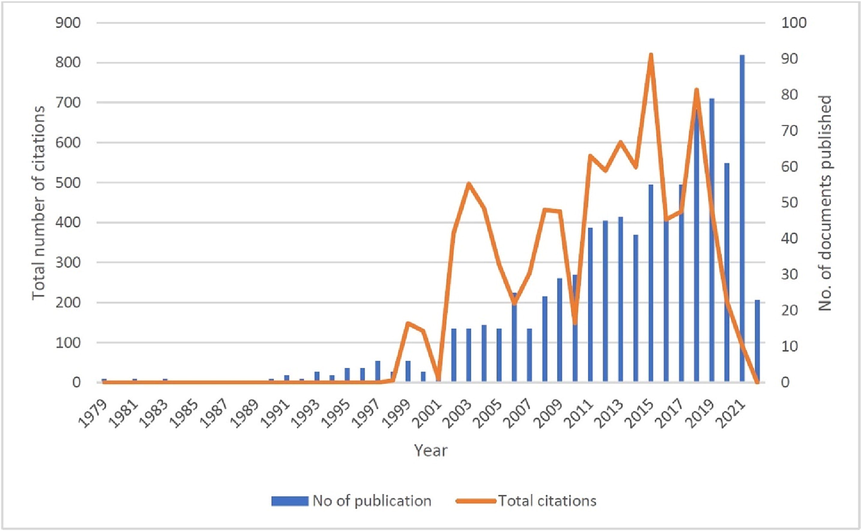
Publication and citation trends in inverse optimization.
Overall, a positive trend is observed in the total number of citations. Those papers, which were published in specific years, for example, the articles published in 2015 received the higher number of citations (820), followed by those published in 2018 (732 citations) and 2013 (601 citations). The recently published papers might have less number of citations because of the time elapsed since their publication was short. The graph shows that there will be a rising trend in both the total number of publications and total citations in the future because scholars all over the world have started paying attention to the field of inverse optimization.
-
Top countries and their contribution:
Table 1 represents the summary table of the number of publications, their percentages, number of citations, average citations per document, and total link strength for the top 20 countries out of the 72 countries for which the publication trend was analyzed. We carried out a citation analysis of country type to get this result.
Sl. No
Country
Documents
% of Documents
Citations
Av. Citations per Document
Total Link Strength
1
United States
278
24.39
4357
15.67
822
2
China
170
14.91
1203
7.08
391
3
Germany
72
6.32
920
12.78
125
4
Canada
59
5.18
798
13.53
302
5
France
50
4.39
557
11.14
131
6
Iran
46
4.04
631
13.72
356
7
India
37
3.25
345
9.32
75
8
United Kingdom
35
3.07
510
14.57
64
9
Japan
25
2.19
143
5.72
16
10
Austria
24
2.11
774
32.25
398
11
South Korea
23
2.02
185
8.04
39
12
Belgium
22
1.93
301
13.68
52
13
Hong Kong
21
1.84
461
21.95
264
14
Spain
20
1.75
436
21.80
47
15
Viet Nam
20
1.75
158
7.90
311
16
Russian Federation
19
1.67
116
6.11
29
17
Netherlands
18
1.58
393
21.83
92
18
Sweden
17
1.49
95
5.59
17
19
Switzerland
15
1.32
233
15.53
21
20
Italy
13
1.14
171
13.15
16
Out of these 20 countries, the United States is the leading country with 278 publications and a citation of 4357. The total link strength for the United States is 822. However, the average citation is only up to 15.67. China occupies second place with 170 publications and 1203 citations. Germany and Canada are in the third and fourth place with 72 and 59 documents, respectively. France, Iran, India, United Kingdom, Japan, and Austria are the remaining countries among the first ten on this list.
Although the USA is leading in terms of document numbers, the effective and most productive work is done in Austria, as it received an average citation per document of 32.25, which is significantly higher than that of the USA (15.67). Hong Kong is on the second place, with an average citation of 21.95. The Netherlands and Spain occupy third and fourth place with 21.83 and 21.80 average citations, respectively.
Fig. 2 represents the network map of countries and their collaboration with others through citation analysis via the VOS viewer software. Each node in the network map represents a country, and the size of each node represents a degree of documents, wherein a larger node reflects (Goodell et al., 2021) the greater intensity of the documents. The connection between each of the nodes symbolizes collaborative citations, and the size of the link indicates the amount and strength of the citations, with thicker linkages indicating higher intensity. For example, the size of the node representing the United States appears as bigger one than others, which means the United States is the country that has an origin of higher documents related to inverse optimization, and it is around 278 documents, and the country received an overall 4357 collaborative citations followed by China, where they have an origin of 170 documents and they received around 1203 collaborative citations.
-
Top institutions and their contribution:
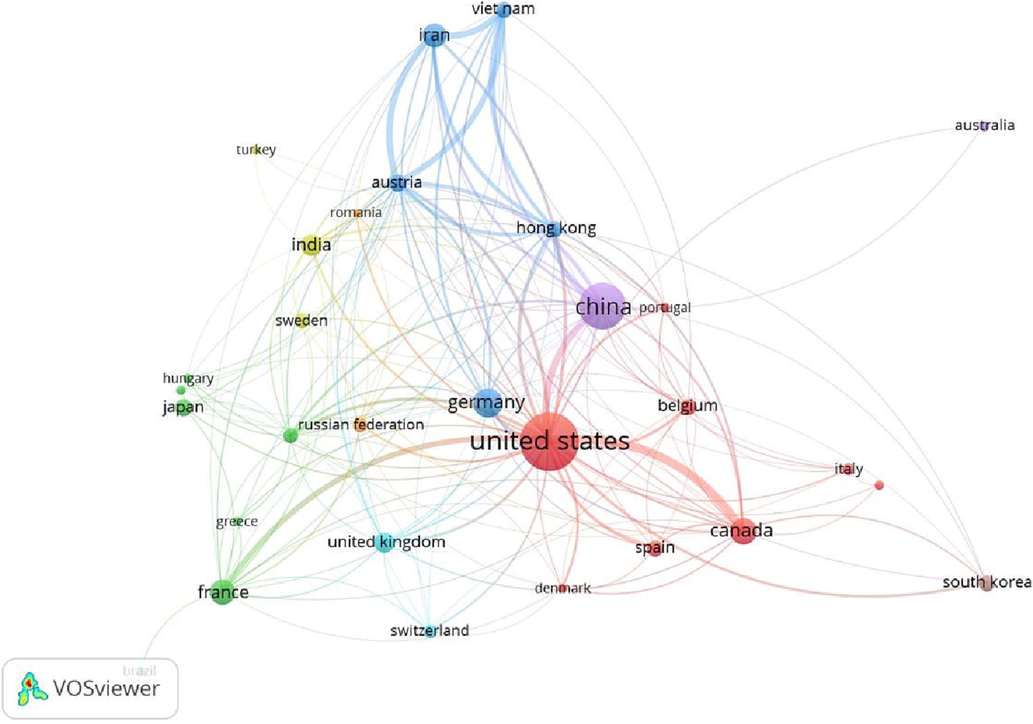
- Network map of citation analysis of countries.
Table 2 shows the summary table of the top 5 institutions from various countries. University of Toronto, Canada had the maximum number (27) of publications with 760 citations and total link strength of 429, having an average citation of 28.15. It was followed by the Dalian University of Technology, China having 25 documents with 108 citations and a total link strength of 201. Sahand University of Technology, Iran, and Pennsylvania State University, United States secured third and fourth place with 22 documents and 279 citations and 21 documents and 440 citations, respectively. Ministry of Education, China secured fifth place with 17 documents and 60 citations.
S.No.
Organizations
Documents
Citations
Average citations per document
Total link strength
1
University of Toronto, Canada
27
760
28.15
429
2
Dalian University of Technology, China
25
108
4.32
201
3
Sahand University of Technology, Iran
22
279
12.68
436
4
Pennsylvania State University, United States
21
440
20.95
443
5
Ministry of Education, China
17
60
3.53
9
In the case of institutional ranking based on an average number of citations per document, the University of Toronto, Canada occupies the first place with 28.15 average citations. Pennsylvania State University, United States occupies the second place with an average citation per document of 20.95, Sahand University of Technology, Iran is the third place with 12.68 average citations, whereas Dalian University of Technology, China, and the Ministry of Education, China received less number of average citations 4.32 and 3.53 respectively.
-
Top journals and their contribution:
The top journals are presented in Table 3. In terms of citations, Operations Research and the European Journal of Operational Research with 512 and 290 citations, respectively, are the two most influential journals. Medical Physics and Physics in Medicine and Biology are the two most productive journals in terms of publications, with 49 and 18 articles, respectively.
Sl. No
Journal source
Documents
Citations
Average citations per document
Total link strength
1
Medical Physics
49
259
5.29
17
2
Physics in Medicine and Biology
18
215
11.94
18
3
European Journal of Operational Research
17
290
17.06
86
4
Operations Research Letters
13
202
15.54
73
5
Proceedings Of Spie – The International Society for Optical Engineering
10
19
1.90
0
6
Journal of Applied Clinical Medical Physics
9
36
4.00
2
7
Radiotherapy and Oncology
9
169
18.78
7
8
Brachytherapy
8
148
18.50
7
9
International Journal of Radiation Oncology Biology Physics
8
217
27.13
10
10
Journal of Global Optimization
8
171
21.38
60
11
Lecture Notes in Computer Science
8
10
1.25
8
12
Operations Research
8
512
64.00
120
Operations Research is the most effective and quality journal having published 8 documents that have been cited 512 times an average of 64 citations per document. International Journal of Radiation Oncology Biology Physics is in second place with 8 documents, 217 citations, and an average citation of 27.13. Journal of Global Optimization is placed third with 8 documents, 171 citations, and an average citation of 21.38.
-
Top authors and their contributions:
The top authors along with their documents, citations, average number of citations, and total link strength are presented in Table 4. Based on the number of citations and publication productivity, Zhang J is a highly influential and most important author with 363 citations and 25 documents, followed by Alizadeh B with 238 citations and 20 documents. Wang L is the most productive author, with an average citation per document of 24.45 and 11 published documents. Zatsiorsky V.M. is the second most productive author with 12 published documents an average citation per document of 19.42.
-
Top references on inverse optimization:
| Sl. No. | Author | Documents | Citations | Average citations per document | Total link strength |
|---|---|---|---|---|---|
| 1 | Zhang | 25 | 363 | 14.52 | 223 |
| 2 | Alizadeh | 20 | 238 | 11.90 | 350 |
| 3 | Nguyen | 18 | 179 | 9.94 | 346 |
| 4 | Das | 13 | 187 | 14.38 | 5 |
| 5 | Latash | 13 | 249 | 19.15 | 143 |
| 6 | Chan | 12 | 212 | 17.67 | 121 |
| 7 | Hajimirza | 12 | 90 | 7.50 | 1 |
| 8 | Zatsiorsky | 12 | 233 | 19.42 | 143 |
| 9 | Zhang | 12 | 83 | 6.92 | 63 |
| 10 | Baroughi | 11 | 39 | 3.55 | 169 |
| 11 | Lee | 11 | 160 | 14.55 | 100 |
| 12 | Li | 11 | 39 | 3.55 | 4 |
| 13 | Wang | 11 | 269 | 24.45 | 29 |
We examined the most frequently cited publications to determine the most referenced one. Table 5 provides the top 15 references on inverse optimization. The best reference is a document, titled “Inverse optimization” written by Ahuja, with 288 citations and 140 links. This document was published in 2001 and is still being cited. The document by Liu C.K., titled “Learning physics-based motion style with nonlinear inverse optimization,” is the second most referenced article with 251 citations and 8 links. The article by Heuberger C., titled “Inverse combinatorial optimization: A survey on problems, methods, and results,” is the third highest referenced article with 218 citations and 107 links.
Sl. No.
Author
Document title
Citations
Links
1
Ahuja (2001)
Inverse optimization
288
140
2
Liu (2005)
Learning physics-based motion style with nonlinear inverse optimization
251
8
3
Heuberger (2004)
Inverse combinatorial optimization: A survey on problems, methods, and results
218
107
4
Beil (2003)
An inverse-optimization-based auction mechanism to support a multiattribute RFQ process
176
9
5
Torquato (2009)
Inverse optimization techniques for targeted self-assembly
142
3
6
Cai (1999)
The complexity analysis of the inverse center location problem
98
50
7
Tsirakos (1997)
Inverse optimization: Functional and physiological considerations related to the force-sharing problem
98
6
8
Zhou (2011)
Designing effective and efficient incentive policies for renewable energy in generation expansion planning
91
4
9
Kaveh (2015)
An improved CSS for damage detection of truss structures using changes in natural frequencies and mode shapes
88
5
10
Herrera-Solaz (2014a)
An inverse optimization strategy to determine single crystal mechanical behavior from polycrystal tests: Application to AZ31 Mg alloy
84
4
11
Horri (2012)
Practical implementation of attitude-control algorithms for an underactuated satellite
79
1
12
Burkard (2004)
Inverse median problems
79
41
13
Jacques (2002)
Calibration of Richards' and convection–dispersion equations to field-scale water flow and solute transport under rainfall conditions
78
4
14
Bertsimas (2015)
Data-driven estimation in equilibrium using inverse optimization
73
35
15
O'donovan (2014)
Learning layouts for single-page graphic designs
73
1
Fig. 3 represents the network map of documents and their collaboration among the others through citation analysis via the VOS viewer software where each node indicates the different documents and the size of each node indicates the degree of documents; a larger node reflects a higher intensity of documents. The link between the nodes represents collaborative citations, and the size of the link denotes the degree and strength of the citations, with thicker linkages signifying greater intensity. For example, a document written by Ahuja and Orlin (2001) received a higher intensity which means he got a collaborative citation of 288 documents in the field of inverse optimization followed by Heuberger (2004), where he got a collaborative citation of 218 documents.
-
Mapping of co-occurrence of keywords:
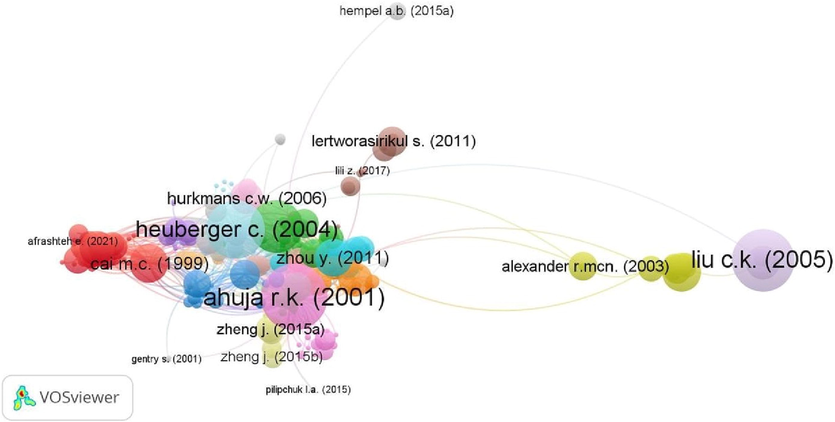
- Network map of citation analysis of documents.
Román et al. (2022) defined the number of co-occurrences of two keywords as the number of publications in which both terms appear together in the title, abstract, or keyword list. We found out all the key concepts that have been explored by researchers. This was done by analyzing the co-occurrence of keywords using the VOS viewer.
Donthu et al. (2021) reported that in a network, each node represents an entity, i.e. a term. The node's size shows how frequently the keyword appears. The relationship between the nodes represents the co-occurrence of terms (i.e., keywords that co-occur or occur together). The thickness of the link indicates keyword co-occurrences (i.e., the number of times those keywords co-occur or occur together). The more frequent the keyword, the larger the node. The more co-occurrences of terms there are, the thicker the link between the nodes. Each color symbolises a conceptual cluster, with nodes and connections describing the coverage of topics (nodes) by the concept (cluster) and the relationship (links) between the topics (nodes) emerging under that concept (cluster).
Fig. 4 represents all keyword co-occurrences related to our data file. We ran our file and set the minimum number of occurrences of a keyword to 5. We got 447 keywords and 5 clusters of different colors, namely red, green, blue, yellow, and violet. Each different color indicates a different theme. For example, “inverse optimization” is the keyword that appears the most (about 499 times) and has a total link strength of 3485. It is followed by the keyword “inverse problems” occurring about 405 times with total link strength of 3010 and “keyword optimization” occurring about 278 times with total link strength of 2068.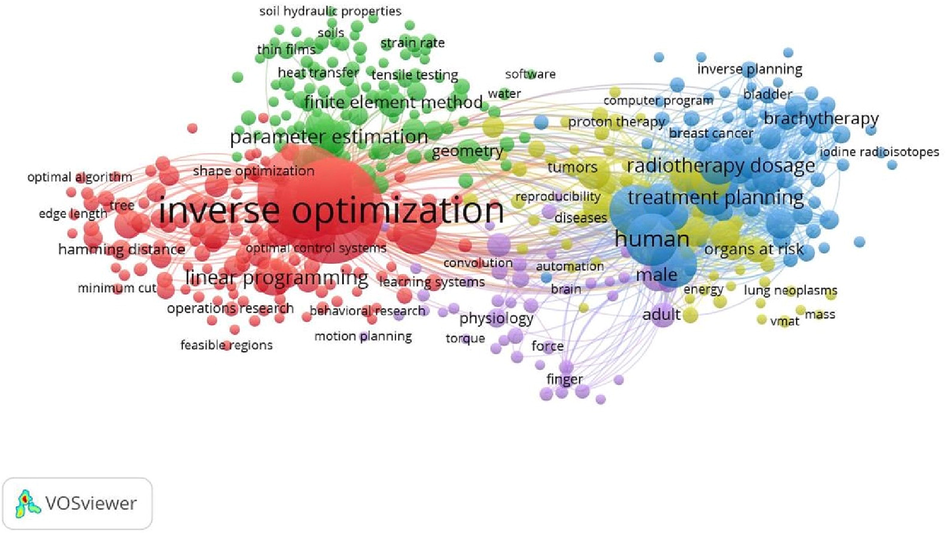
Network visualization of the co-occurrence of keywords using VOS viewer.
Author’s keywords can denote indications of research priorities and interest of scientists and researchers in the field. Fig. 5 provides the author–keyword co-occurrences of network visualization. We got 11 different clusters with 151 total links and total link strength of about 402.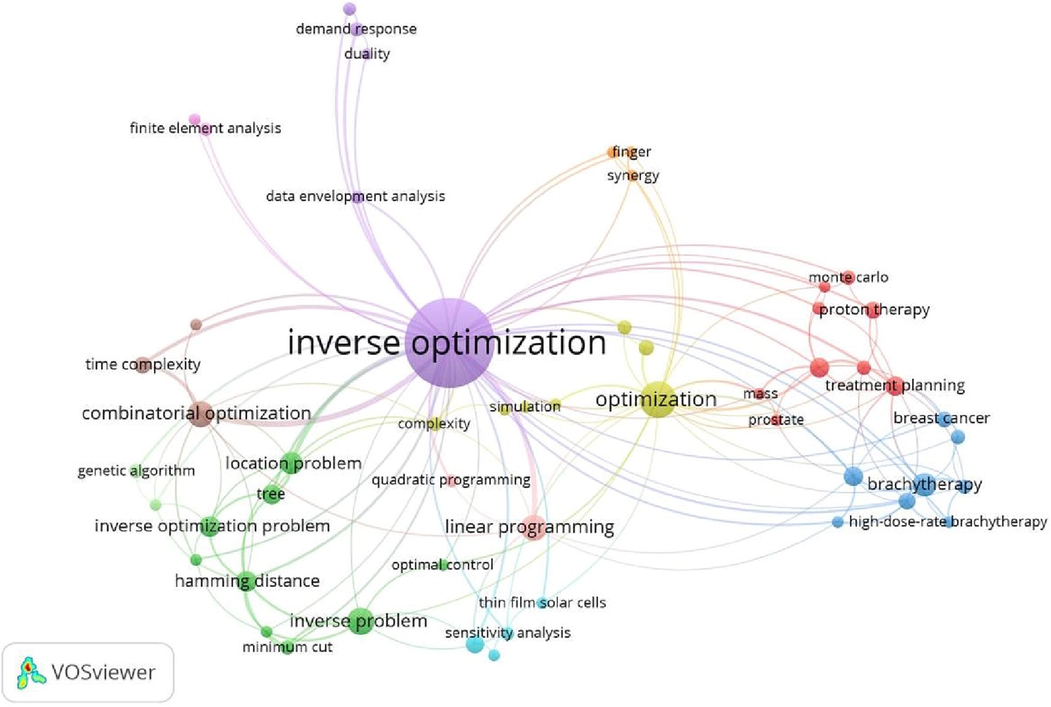
Network visualization of co-occurrence of author’s keywords using VOS viewer.
The most important author keyword was “inverse optimization” with 272 occurrences, followed by “optimization,” “inverse problems,” and “combinatorial optimization” with occurrences of 44, 25, and 24, respectively. The figure clearly shows strength and weakness of the area, which helps in forecasting the future publishing trends as it is based on top occurrences of author–keywords with a minimum threshold of 5. For example, it can be said that a research trend of inverse optimization in data envelopment analysis, combinatorial optimization, treatment planning, quadratic programming, and sensitivity analysis, can occur in the future.
5 Conclusion and implications
In this paper, we present the bibliometric analysis of inverse optimization. We studied the publication patterns of scholarly works from 1979 until the date of the search (March 15, 2022). We also analyzed and conducted some bibliometric analyses, such as citation analysis, publication counts, co-occurrence analysis on top articles, authors, countries, institutions, and journals, using the VOS viewer software.
We show that the maximum number of publications related to inverse optimization occurred in 2021, whereas the highest citations related to our topic occurred in 2015. Out of 72 countries, the United States is the leading country with the highest publications (approximately 278 publications), followed by China (170 documents). Even though the United States is number one in terms of publications, the University of Toronto, Canada is the institution that has produced qualitative research on inverse optimization, with 27 documents and 760 citations. Zhang J., with 25 documents and 363 citations, is the top author in the field, followed by Alizadeh B.
Medical Physics is the top journal with regard to the number of publications whereas Operations Research and European Journal of Operational Research are the two most influential and effective journals with the highest citations of 512 and 290, respectively. “Inverse Optimization” by Ahuja and Orlin (2001) is the most cited scholarly work.
Network visualization of keyword co-occurrences and author–keyword co-occurrences provide indications of research priorities and interests of scientists and researchers in the field. Network visualization using VOS viewer provides comprehensive network maps. It clearly shows the strength and weaknesses in the research area, which helps in forecasting future publishing trends as it is based on top occurrences of author–keywords. A research trend of inverse optimization can be developed in data envelopment analysis, combinatorial optimization, treatment planning, quadratic programming, and sensitivity analysis in the future.
Research involving human participants and/or animals
This article does not contain any studies with human participants or animals performed by any of the authors.
Funding
Fund has been provided by King Saud University, Deanship of Scientific Research, College of Science-Research Center.
Informed consent
Informed consent was obtained from all individual participants included in the study.
CRediT authorship contribution statement
Abdul Razzaq Abdul Ghaffar: Software. Anas Melethil: Conceptualization, Methodology, Writing – original draft. Ahmad Yusuf Adhami: Data curation, Writing – original draft.
Acknowledgments
The project was supported by King Saud University, Deanship of Scientific Research, College of Science-Research Center.
Declaration of Competing Interest
The authors declare the following financial interests/personal relationships which may be considered as potential competing interests: ‘Abdul Razzaq Abdul Ghaffar declares that he has no conflict of interest. Anas Melethil declares that he has no conflict of interest. Ahmad Yusuf Adhami declares that he has no conflict of interest.’.
References
- Solving the convex ordered set problem withapplications to isotonic regression. MIT, Cambridge, MA: Sloan School of Management; 1997. Working Paper
- A fast algorithm for the bipartite node weightedmatching problem on path graphs with application to the inverse spanning treeproblem. MIT, Cambridge, MA: Sloan School of Management; 1998. Working Paper
- A faster algorithm for the inverse spanning tree problem. J. Algorithms. 2000;34(1):177-193.
- [Google Scholar]
- Combinatorial algorithms for inverse network flow problems. Netw.: Int. J.. 2002;40(4):181-187.
- [Google Scholar]
- Objective selection for cancer treatment: an inverse optimization approach. Oper. Res.. 2022;70(3):1717-1738.
- [Google Scholar]
- Inverse optimization for assessing emerging technologies in breast cancer screening. Ann. Oper. Res.. 2015;230:57-85.
- [Google Scholar]
- The inverse shortest paths problem with upper bounds on shortest paths costs. In: Network optimization. Berlin, Heidelberg: Springer Berlin Heidelberg; 1997. p. :156-171.
- [Google Scholar]
- On an instance of the inverse shortest paths problem. Math. Program.. 1992;53:45-61.
- [Google Scholar]
- On the use of an inverse shortest paths algorithm forrecovering linearly correlated costs. Math. Program.. 1994;63:1-22.
- [Google Scholar]
- Inverse matroid intersection problem. Beijing, China: Institute of System Science, Academia Sinica; 1995. Research Report (To appear in ZOR-Mathematical Methods of Operations Research)
- Inverse shortest path problems. Beijing, China: Institute of Systems Sciences, Academia Sinica; 1994. Technical Report
- Inverse polymatroidal flow problem. Beijing, China: Institute of System Science, Academia Sinica; 1996. Research Report
- Inverse problems of submodular functions on digraphs. J. Optim. Theory Appl.. 2000;104(3):559-575.
- [Google Scholar]
- The inverse optimization of exhaust hood by using intelligent algorithms and CFD simulation. Powder Technol.. 2017;315:282-289.
- [Google Scholar]
- Inverse optimization: Closed-form solutions, geometry, and goodness of fit. Manag. Sci.. 2019;65(3):1115-1135.
- [Google Scholar]
- How to conduct a bibliometric analysis: An overview and guidelines. J. Bus. Res.. 2021;133:285-296.
- [Google Scholar]
- Artificial intelligence and machine learning in finance: Identifying foundations, themes, and research clusters from bibliometric analysis. J. Behav. Exp. Financ.. 2021;32:100577
- [Google Scholar]
- Inverse combinatorial optimization: A survey on problems, methods, and results. J. Comb. Optim.. 2004;8(3):329-361.
- [Google Scholar]
- A strongly polynomial algorithm for the inverse shortest arborescence problem. Beijing, China: Institute of Systems Science, Academia Sinica; 1995. Working Paper
- On the inverse problem of k-matching of bipartite graph. Hong Kong: Department of Management, School of Business and Management, Hong Kong University of Science and Technology; 1995. Working Paper
- On the inverse version of the minimum cost flowproblem. Hong Kong: Dept. of ISMT, School of Business and Management, Hong Kong University of Science and Technology; 1995. Working Paper
- Iyengar, G.N., Kang, W., 2003. CORC Technical Report TR-2003-02 Inverse conic programming and applications.
- Inverse optimization approach to the identification of electricity consumer models. CEJOR. 2021;29(2):521-537.
- [Google Scholar]
- Surfing the waves: Environmental and socio-economic aspects of surf tourism and recreation. Sci. Total Environ.. 2022;826:154122
- [Google Scholar]
- Inverse Optimization for Warehouse Management. In: Optimization, Learning Algorithms and Applications: First International Conference, OL2A 2021, Bragança, Portugal, July 19–21, 2021, Revised Selected Papers 1. Springer International Publishing; 2021. p. :56-71.
- [Google Scholar]
- The Minimum Cost Flow Problem: Primal Algorithms and Cost Perturbations. Kanpur, India: Department of Mathematics, Indian Institute of Technology; 1996. Unpublished Dissertation
- Solving the inverse spanning treeproblems through network flow techniques. Cambridge, MA: Sloan School of Management, MIT; 1996. Working Paper (To appear in Operations Research)
- Solving inverse spanning tree problems through network flow techniques. Oper. Res.. 1999;47(2):291-298.
- [Google Scholar]
- Inverse Problem Theory: Methods for Data Fitting and Model Parameter Estimation. Amsterdam: Elsevier; 1987.
- An inverse problem of the weighted shortest path problem. Jpn. J. Ind. Appl. Math.. 1995;12:47-59.
- [Google Scholar]
- Yang, C., Zhang, J., Ma, Z., 1997. Inverse maximum flow and minimum cut problems.
- A column generation method for inverse shortest path problems. ZOR-Math. Methods Oper. Res.. 1995;41:347-358.
- [Google Scholar]
Further reading
- Inverse optimization for the recovery of constraint parameters. European J. Oper. Res.. 2020;282(2):415-427.
- [Google Scholar]
- Inverse multiobjective optimization: Inferring decision criteria from data. J. Global Optim.. 2021;80:3-29.
- [Google Scholar]


