

Translate this page into:
Ultra-performance liquid chromatography/tandem mass spectrometry for the trace-level identification of perchlorate in filtered drinking water treated with ozonation and chlorination disinfection processes
⁎Corresponding author. mrkhan@ksu.edu.sa (Mohammad Rizwan Khan)
-
Received: ,
Accepted: ,
This article was originally published by Elsevier and was migrated to Scientific Scholar after the change of Publisher.
Peer review under responsibility of King Saud University.
Abstract
Abstract
Objectives
In the present study, a rapid, sensitive and selective method has been optimized for the quantification of perchlorate (ClO4−) in drinking water treated with ozonation and chlorination disinfection processes.
Methods
An analytical technique based on ultra-performance liquid chromatography/tandem mass spectrometry (UPLC-MS/MS) has been optimized for the determination of perchlorate in drinking water. Prior to the analysis, the filtered water samples were directly injected into the system without any sample pretreatment. The ClO4− was quantified by examining the high intensity ion signal (m/z 83), produced by a removal of an oxygen atom from the ClO4− parent ion.
Results
The performance of the method was established, achieving excellent values for instance linearity (R2 = 0.9999), limit of detection (0.009 µg/L), limit of quantification (0.030 µg/L), precisions (run-to-run, 1.56% and day-to-day, 2.15%) in terms of relative standard deviation while examining a standard of ClO4− (5 µg/L). The elution time of ClO4− was found to be 0.51 min at 300 µL/min flow rate. A total of forty-five water samples were studied, obtaining the ClO4− concentrations in bottled and metropolitan water ranging from 0.78 to 53.23 µg/L and 0.18 to 2.62 µg/L, respectively.
Conclusions
The metropolitan water was found to be least contaminated than the bottled water, and found to be lower than the Reference Dose (RfD) value 0.007 mg/kg body weight/day and Drinking Water Equivalent Level (DWEL) value 25 µg/L set by the Environmental Protection Agency (EPA). Furthermore, in comparison to the traditional methods, the proposed technique was found to be very efficient, cost-effective and rapid for the routine determination of ClO4− at trace level in water samples.
Keywords
Perchlorate
Drinking water
Ozonation
Chlorination
Ultra-performance liquid chromatography/tandem mass spectrometry

1 Introduction
Perchlorate (ClO4−) is considered as a promising persistent pollutant, occurred in water environment because of its high stability and solubility. The prime source of ClO4− pollution is from the production of rocket fuel, explosives, air bags and fireworks (Wan et al., 2015; Almeer et al., 2014). The infectivity of ClO4− in water, foods and soil is of great concern because of its potential adverse effect on human health even at very low levels (Karthikprabu et al., 2020). ClO4− has been extensively recognized as an endocrine disruptor since it aggressively reduced the iodide level in the thyroid gland and thus reduces the heart rate and other fatal diseases for instance alternation in fetal development during woman pregnancy (Rubin et al., 2017). Since drinking water is considered as the most important source of ClO4− to which human are exposed every day Lajin and Goessler, 2020). Lately, ClO4− has increased further anxiety because of its ubiquitous presence in drinking water and water surroundings, with amounts varied between <0.0001 µg/mL and 2.3 µg/mL (Qin et al., 2014). Moreover, ClO4− was detected in human biological samples for instance urine, blood, breast milk and saliva, with amounts varied between <0.0001 µg/mL and 0.16 µg/mL (Kirk et al., 2005; Zhang et al., 2010, 2015). On the basis of such evidences, the Environmental Protection Agency (EPA) has suggested the ClO4− oral Reference dose (RfD) of 0.007 mg/kg body weight/day and Drinking Water Equivalent Level (DWEL) of 25 µg/L (Almeer et al., 2014; Clark, 2000). In the United States, some local organizations for instance the Massachusetts Department of Environmental Protection and the California Department of Health Services have also publicized the maximum contaminant level for ClO4− in drinking water at 2 mg/L and 6 mg/L, respectively (Zewdie et al., 2010).
A range of sensitive analytical techniques have been developed for the analysis of ClO4− in drinking water and other matrices. The most common technique based on ion chromatography (IC) was extensively applied for the analysis of ClO4− in drinking water (Seiler et al., 2016; Lamb et al., 2006; Jackson and Chassaniol, 2002). On the other hand, the EPA method (314.0) has also been broadly applied IC for the analysis of ClO4− in drinking water (Hautman and Munch, 1999). However, IC offerings difficulties in the examination in highly complex matrices for instance lack of sensitivity, selectively and a high possibility of false positive outcomes (Yu et al., 2006). Later on, to achieve the higher sensitivity and selectively in complex samples, the IC-tandem mass spectrometry has been applied, and thus the EPA accepted the method (331.0) based on IC-mass spectrometry (IC-MS) and IC-tandem mass spectrometry (IC-MS/MS) for the trace identification of ClO4− in various matrices such as drinking water, food, beverages and biological samples (Wendelken et al., 2005; El Aribi et al., 2006; Liu et al., 2019) which offered the low detection limits between 5 ng/L and 25 ng/L. Even though the analytical method based on IC-MS and IC-MS/MS is specifically designed to separate ionic substances, a post-column suppressor is needed to eliminate non-volatile ionic eluent that conciliations in the efficiency of ionization. However, in the meantime more advanced methods based on liquid chromatography-mass spectrometry (LC-MS) or liquid chromatography-tandem mass spectrometry (LC-MS/MS) have been optimized for the quantitative and qualitative identification of ClO4− in various matrices for instance water, food, infant formula and, biological and environmental samples (Li and George, 2005; El Aribi et al., 2006; Chen et al., 2009; Wang et al., 2011; Lajin and Goessler, 2020; Dong et al., 2019; Constantinou et al., 2019; Liu et al., 2019; Song et al., 2019). Relatively, LC-MS and LC-MS/MS found to be more sensitive and selective than IC-MS and IC-MS/MS methods.
Owing to ClO4¯ toxicity, there has been concern in establishing drinking water safety benchmarks and in health influences while ClO4− is existing at low concentrations. Therefore, we studied the presence of ClO4− in bottled and metropolitan water by ultra-performance liquid chromatography and tandem mass spectrometry (UPLC-MS/MS). This method was established with simple filtration (Azmi et al., 2020) and a novel UPLC technique by means of diverse analytical columns and mobile phase compositions (Azmi et al., 2017) to easier the separation and detection of ClO4− (Khan et al., 2012, 2014, 2016, 2020a, 2020b). Numerous bottled and metropolitan water samples were obtained from diverse localities to offer a nationwide source of ClO4− concentration which possibly will signify a reference point for future threat assessment estimation as ClO4− is presently not measured in Saudi Arabian bottled and metropolitan water samples. This is the first information relating to the presence of ClO4− in bottled and metropolitan water samples from Saudi Arabia. The high throughput delivered by proposed technique can be a benefit for such kind of investigation.
2 Materials and methods
2.1 Reagents and chemicals
ClO4− (1000 mg/L) standard as IC certified was obtained from Merck (Darmstadt, Germany). Methanol for HPLC, ≥99.9%, acetonitrile for HPLC, gradient grade, ≥99.9% and Formic acid, reagent grade, ≥95% were supplied from Sigma-Aldrich (Darmstadt, Germany). Milli–Q ultrapure water was used for standard preparation and mobile phase application, obtained from water purification system from Millipore Corporation, model Advantage A10 (Bedford, USA). The stock ClO4− (1000 mg/L) standard was diluted at required levels for the preparation of calibration curve and standard addition quantification purposes. The five individual calibration solutions were prepared at concentrations of 0.05, 1, 10, 30, 60 and 100 µg/L. Standards including calibration and standard addition solutions were store at a low temperature (4 °C) to avoid any microbial contamination. The standards and samples were filtered by Chromafil Xtra PTFE (Polytetrafluoroethylene) syringe filter of pore size 0.20 μm (Macherey-Nagel GmbH, Duren, Germany) before being analyzed by the UPLC–MS/MS system.
2.2 Sample analysis
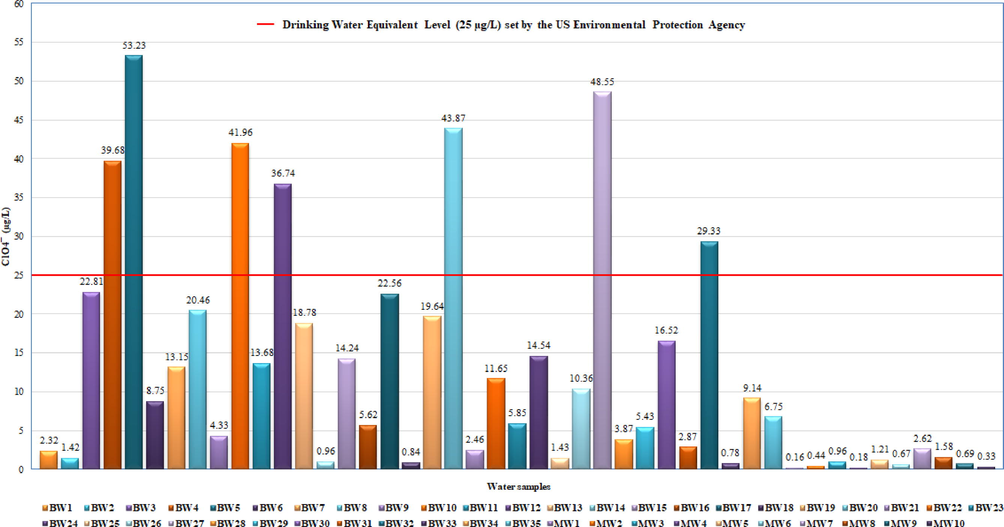
A total of forty-five samples including thirty-five bottled water and nine metropolitan water of various sources were obtained from various supermarkets located in Riyadh, Saudi Arabia. The metropolitan water was obtained from various local municipalities and collected in glass bottles. The bottled water production time was between December 2019-January 2020 and expiry was one year from the date of production. The total volume of the bottled water was 330 mL and the container was made from polyethylene terephthalate plastic and glass bottles. Water samples were stored at low temperature (4 °C) and studied within a week time. Water samples were filtered by Chromafil Xtra PTFE (Polytetrafluoroethylene) syringe filter of pore size 0.20 μm (Macherey-Nagel GmbH, Duren, Germany) prior to analysis by the UPLC–MS/MS system. In each sample batch, the quality controls and blanks (Milli-Q water, free from ClO4−) samples were studied to confirm the samples contamination did not take place and the system sensitivity was maintained throughout the analysis. In addition, the sampling procedures were performed with precaution to ease any sample adulteration. The sampling materials including glassware were cautiously cleaned with Milli-Q water and methanol to evade any uncleanness. The details relating to the water samples have been demonstrated in Table 1. BW, bottled water (BW1-BW35); MW, metropolitan water (MW1-MW10); -, not described; conc., concentration; sd, standard deviation (n = 3); PET, polyethylene terephthalate.
Sample
Source
Disinfection method
Container
Origin
35ClO4− before addition, (µg/L) ± sd
35ClO4− added low conc. (µg/L)
35ClO4− after addition, low conc.(µg/L) ± sd
R. values (%), low conc.
35ClO4− added high conc. (µg/L)
35ClO4−after addition, high conc. (µg/L) ± sd
R. values (%), high conc.
BW 1
Well water
Ozonation
PET
KSA
2.32 ± 0.02
2
4.23 ± 0.04
96
10
12.10 ± 0.13
98
BW 2
Well water
–
PET
KSA
1.42 ± 0.01
2
3.32 ± 0.03
95
10
11.20 ± 0.12
98
BW 3
–
Ozonation
PET
KSA
22.81 ± 0.22
2
24.77 ± 0.24
98
10
32.75 ± 0.31
99
BW 4
Well water
Ozonation
PET
KSA
39.68 ± 0.38
2
41.66 ± 0.42
99
10
49.55 ± 0.47
99
BW 5
Well water
Ozonation
PET
KSA
53.23 ± 0.52
2
55.20 ± 0.50
99
10
63.12 ± 0.60
99
BW 6
Well water
Ozonation
PET
KSA
8.75 ± 0.08
2
10.71 ± 0.09
98
10
18.68 ± 0.16
99
BW 7
–
Ozonation
PET
KSA
13.15 ± 0.10
2
15.12 ± 0.11
98
10
23.01 ± 0.21
99
BW 8
–
Ozonation
PET
KSA
20.46 ± 0.20
2
22.43 ± 0.21
98
10
30.38 ± 0.28
99
BW 9
Well water
–
Glass
KSA
4.33 ± 0.04
2
6.26 ± 0.05
97
10
14.10 ± 0.12
98
BW 10
–
Ozonation
PET
Turkey
41.96 ± 0.40
2
43.94 ± 0.42
99
10
51.85 ± 0.49
99
BW 11
Well water
Ozonation
PET
KSA
13.68 ± 0.10
2
15.63 ± 0.12
98
10
23.55 ± 0.22
99
BW 12
Well water
–
PET
KSA
36.74 ± 0.35
2
38.73 ± 0.36
99
10
46.62 ± 0.43
99
BW 13
–
Ozonation
PET
KSA
18.78 ± 0.18
2
20.75 ± 0.19
98
10
28.65 ± 0.25
99
BW 14
Well water
Ozonation
Glass
KSA
0.96 ± 0.008
2
2.85 ± 0.02
95
10
10.72 ± 0.08
98
BW 15
Well water
–
PET
France
14.24 ± 0.13
2
16.20 ± 0.15
98
10
24.10 ± 0.20
99
BW 16
–
Ozonation
PET
KSA
5.62 ± 0.04
2
7.55 ± 0.06
97
10
15.45 ± 0.14
98
BW 17
Well water
–
PET
KSA
22.56 ± 0.22
2
24.53 ± 0.23
99
10
32.42 ± 0.30
99
BW 18
Well water
Ozonation
PET
KSA
0.84 ± 0.007
2
2.72 ± 0.02
94
10
10.65 ± 0.08
98
BW 19
–
Ozonation
Glass
KSA
19.64 ± 0.18
2
21.61 ± 0.20
98
10
29.55 ± 0.27
99
BW 20
Well water
Ozonation
Glass
KSA
43.87 ± 0.42
2
45.85 ± 0.44
99
10
53.77 ± 0.51
99
BW 21
Well water
Ozonation
PET
KSA
2.46 ± 0.02
2
4.39 ± 0.04
97
10
12.29 ± 0.11
98
BW 22
Well water
Ozonation
PET
KSA
11.65 ± 0.09
2
13.60 ± 0.10
98
10
21.55 ± 0.19
99
BW 23
Well water
Ozonation
PET
KSA
5.85 ± 0.05
2
7.78 ± 0.06
97
10
15.62 ± 0.14
98
BW 24
Well water
–
PET
KSA
14.54 ± 0.13
2
16.49 ± 0.15
98
10
24.45 ± 0.23
99
BW 25
Well water
–
PET
KSA
1.43 ± 0.01
2
3.32 ± 0.02
95
10
11.25 ± 0.09
98
BW 26
Well water
Ozonation
PET
KSA
10.36 ± 0.10
2
12.30 ± 0.13
97
10
20.22 ± 0.18
99
BW 27
–
Ozonation
Glass
KSA
48.55 ± 0.46
2
50.52 ± 0.48
99
10
58.45 ± 0.54
99
BW 28
Well water
Ozonation
PET
KSA
3.87 ± 0.03
2
5.79 ± 0.04
96
10
13.65 ± 0.12
98
BW 29
Well water
Ozonation
PET
KSA
5.43 ± 0.05
2
7.35 ± 0.06
96
10
15.20 ± 0.13
98
BW 30
–
Ozonation
PET
KSA
16.52 ± 0.17
2
18.48 ± 0.18
98
10
26.45 ± 0.23
99
BW 31
Well water
–
Glass
KSA
2.87 ± 0.03
2
4.78 ± 0.04
96
10
12.65 ± 0.10
98
BW 32
Well water
Ozonation
PET
KSA
29.33 ± 0.28
2
31.30 ± 0.29
99
10
39.21 ± 0.37
99
BW 33
Well water
Ozonation
Glass
KSA
0.78 ± 0.007
2
2.68 ± 0.02
95
10
10.55 ± 0.08
98
BW 34
Well water
Ozonation
PET
KSA
9.14 ± 0.08
2
11.10 ± 0.09
98
10
18.97 ± 0.16
98
BW 35
Well water
Ozonation
PET
KSA
6.75 ± 0.06
2
8.68 ± 0.07
97
10
16.58 ± 0.14
98
MW 1
Desalinated
Chlorination
–
KSA
0.16 ± 0.001
2
2.03 ± 0.02
94
10
9.85 ± 0.08
97
MW 2
Desalinated
Chlorination
–
KSA
0.44 ± 0.004
2
2.33 ± 0.02
95
10
10.22 ± 0.08
98
MW 3
Desalinated
Chlorination
–
KSA
0.96 ± 0.006
2
2.87 ± 0.03
96
10
10.75 ± 0.09
98
MW 4
Desalinated
Chlorination
–
KSA
0.18 ± 0.005
2
2.05 ± 0.02
95
10
9.77 ± 0.08
96
MW 5
Desalinated
Chlorination
–
KSA
1.21 ± 0.02
2
3.13 ± 0.03
96
10
11.02 ± 0.10
98
MW 6
Desalinated
Chlorination
–
KSA
0.67 ± 0.006
2
2.56 ± 0.02
95
10
10.44 ± 0.08
98
MW 7
Desalinated
Chlorination
–
KSA
2.62 ± 0.02
2
4.53 ± 0.04
96
10
12.37 ± 0.11
98
MW 8
Desalinated
Chlorination
–
KSA
1.58 ± 0.02
2
3.49 ± 0.03
96
10
11.36 ± 0.10
98
MW 9
Desalinated
Chlorination
–
KSA
0.69 ± 0.007
2
2.61 ± 0.02
96
10
10.46 ± 0.08
98
MW 10
Desalinated
Chlorination
–
KSA
0.33 ± 0.003
2
2.22 ± 0.02
95
10
10.00 ± 0.08
97
The ClO4− quantification in water samples was carried out using standard addition method, however this quantification method offers to reduce the influence of samples matrices which obstruct with the analyte peak determination. Moreover, the quality control and blank samples were also analyzed at every sample to retain the applied technique (UPLC-MS/MS) sensitivity. Standard addition quantification method comprises four fortified samples and two non-fortified samples at zero levels. The four fortified samples comprise the ClO4− levels at 0.15 µg/L, 0.3 µg/L, 30 µg/L and 60 µg/L. The ClO4− recovery values in water samples were determined from the linear regression slope values and between the fortified and obtained ClO4− concentration in water samples. All samples were studied in triplicates (n = 3). Statistical information relating to the ClO4− identification has been performed using ANOVA (analysis of variance), a statistical way applied to the estimation of variances between two or more means of the attained amounts. The outcomes from the present study are illustrated as the mean ± standard deviation (n = 3).
Equipment and parameters
2.3 UPLC
The chromatographic separation of ClO4− was carried out by means of UPLC system (Waters, Milford, USA) which was coupled with triple quadrupole mass spectrometry and comprises with auto sampler, solvent binary pump, vacuum degasser, column oven. The reversed phase analytical column (Acquity BEH C18, Waters, Milford, USA) with dimension 0.21 cm × 5 cm and particle size 1.7 µm was used for the separation of ClO4−. During analysis, the analytical column was maintained at room temperature, and to maintain its effectiveness a safety guard column (VanGuard™ BEH C18, Waters, Milford, USA) of particle size 1.7 µm was also used. The mobile phase was used as methanol (90%) and water (10%) in isocratic mode, and the flow rate was 300 µL/min. The total sample analysis time was 2 min, and the injection volume was 5 µL. To avoid contamination during analysis, the column was continuously washed with a mixture solution (50/50, v/v) of water and methanol at every 5 sample injections.
2.4 MS/MS
The MS/MS acquisition was performed using TQD triple quadrupole mass spectrometer (Waters, Micromass, Milford, USA) attached with an electrospray ionization (ESI) interface operated in negative ionization mode. The Multiple Reaction Monitoring (MRM) mode was applied to acquire the data of the analyzed compound. The optimized MS/MS conditions were used to monitor the ClO4− and their corresponding transitions in analyzed samples. The conditions are: capillary voltage (2.8 kV), cone voltage (60 V), ion source temperature (110 °C), desolvation temperature (350 °C), cone gas (60 L/h) and desolvation gas (600 L/h). The high purity nitrogen and argon gases were used as cone and collision gas, respectively, and were obtained from nitrogen generator (Peak Scientific, NM30LA, (Inchinann, United Kingdom) and Speciality Gas Centre (Jeddah, Saudi Arabia), respectively. An Oerlikon rotary pump model SOGEVAC SV40BI (Paris, France) was used to create the MS vacuum. The MS/MS conditions for instance ion transitions, collision energies and dwell time have been demonstrated in Table 2. The data has been achieved using system software MassLynx V4.1 from Waters (Milford, USA). MRM, multiple reaction monitoring; 35ClO4− transition (m/z 99.16 > 83.21) used for quantification; 37ClO4− transition (m/z 101.14 > 85.16) used for confirmation.
Analyte
Precursor ion (m/z)
Product ion(m/z)
Collision energy (eV)
Dwell time (s)
35ClO4−
99.16
83.21
75
0.025
37ClO4−
101.14
85.16
80
0.025
3 Results and discussion
3.1 Optimization of UPLC-MS/MS
In order to achieve the best ClO4¯ separation behavior, three types of analytical column for instance Acquity UPLC® BEH C18, C8 and hydrophilic interaction liquid chromatography (HILIC) were tested out which typically offers strong retention of the compounds. The columns were established using ClO4¯ fortified Milli-Q water samples at different flow rates (100–500 µL/min) and various mobile phases either used separately (water, methanol and acetonitrile) or in different compositions. To acquire the most ClO4¯ symmetric peak deprived of substantial band broadening, primarily, individual columns were verified using specific mobile phase in isocratic mode. Nevertheless, the poor retention features were identified from all types of applied columns, and produced broader unsymmetrical peak with higher background noise and retention time. The formic acid (0.01–0.05%) was also added as an organic modifier in the mobile phase but the peak symmetry was little improved even the produced higher background noise and retention time. Afterward, the columns were studied using various mobile phase compositions, the high intense symmetrical peak of ClO4¯ was acquired by Acquity BEH C18 column and binary mobile phase consisting of methanol (90%) and Milli-Q water (10%) in isocratic mode at the optimum flow rate of 300 µL/min. The system dead volume was 0.35 min and the ClO4¯ was eluted at the retention time of nearly 0.51 min. At higher flow rate the peak was eluted more rapidly nonetheless the peak intensity response was reduced may be because of the existence of other ions which may come from mobile phases in the source of mass spectrometer. Thus, the less ionization of the studied compound takes place and congruently its intensity decrease. The influence of columns on the separation of ClO4¯ has been demonstrated in Fig. 1. Fig. 1 (A) corresponds to the UPLC-MS/MS chromatogram of ClO4¯ (1 µg/mL) using Acquity BEH C18 whereas Fig. 1 (A) and (B) relate the UPLC-MS/MS chromatograms of ClO4¯ using Acquity BEH C8 and HILIC, respectively. In all cases, the studied compound was eluted at similar retention time (∼0.50 min). However, the asymmetrical peak with considerable peak broadening was obtained in both Acquity BEH C8 and HILIC columns, the isotope ion (37ClO4−) in both cases (Fig. 1 (A) and (B) were also obtained in poor retention characteristic. Thus, the Acquity BEH C18 was selected for the analysis of ClO4¯ in water samples. To evade any carryover, the Milli-Q water (free from ClO4¯) samples were analyzed after each injection, and no any retained compound was identified during the analysis. The sample injection volume was 5 µL in all type of samples.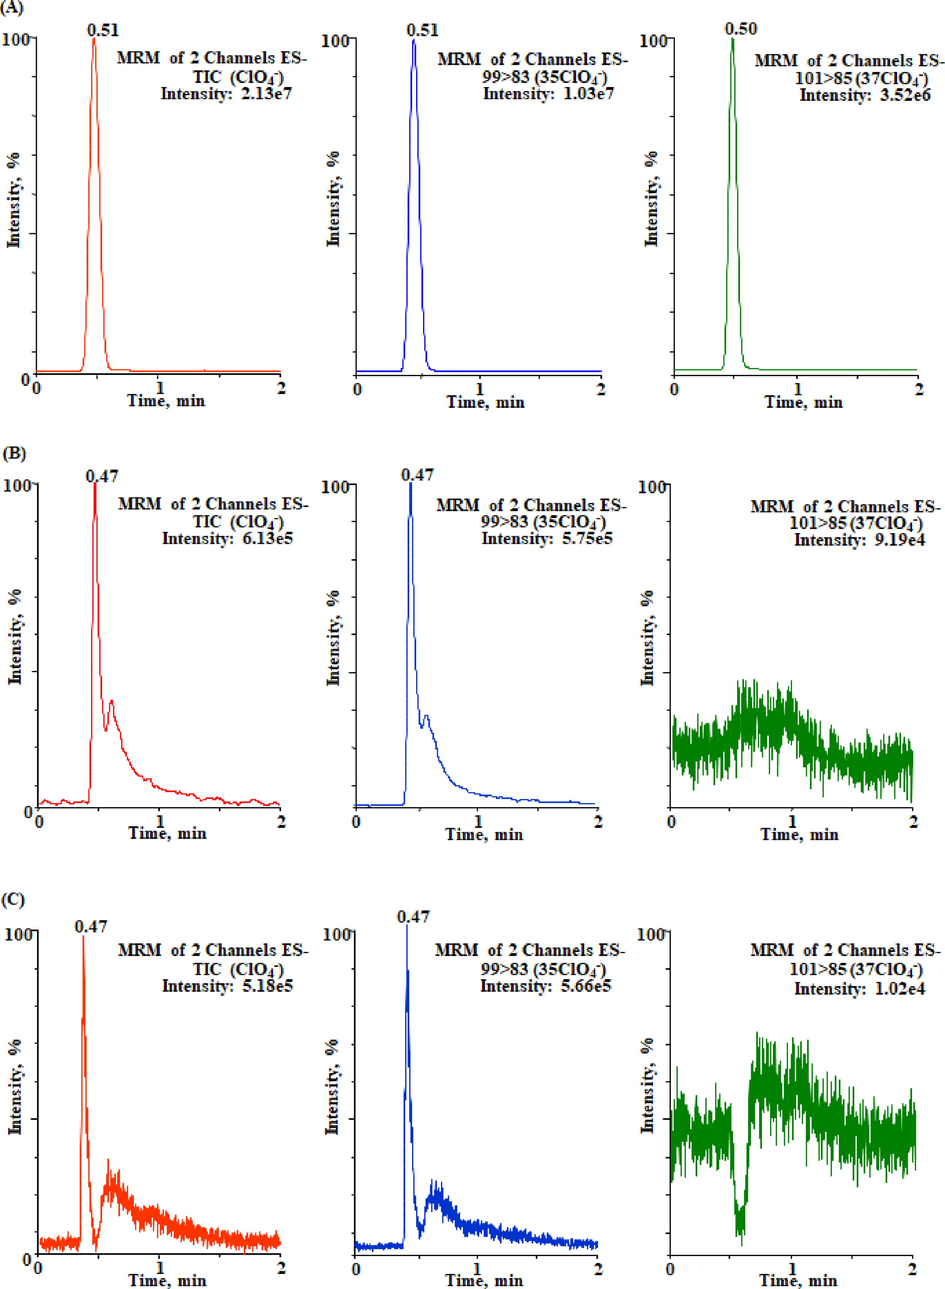
Multiple reaction monitoring chromatograms of ClO4¯ (1 µg/mL) isotopes 35ClO4¯ (m/z 99.16 > 83.21) and 37ClO4¯ (m/z 101.14 > 85.16) obtained using analytical columns (A) Acquity BEH C18 (B) Acquity BEH C8 and (C) Acquity HILIC.
In order to study the ClO4¯ ion transmission and its fragmentation arrangements, a standard solution of ClO4¯ (5 µg/mL) was infused into the mass spectrometric system by applying independently positive and negative ionization mode to desolvate the organic/aqueous mobile phase proficiently and acquire the highest compound response. In electrospray positive ionization mode, no signal was observed under different applied ion source parameters for instance cone voltage (5–100 V), capillary voltage (1.0–5 kV) and desolvation temperature (100–500 °C). Hence, the MS operation conditions were prudently optimized in negative ionization mode, as presented in Table 2. The ClO4¯ was monitored by mass transitions and the main compound was studied as a most abundant precursor ions [M − H]− at m/z 99.16 (35ClO4¯) and its corresponding isotope at m/z 101.14 (37ClO4¯), and their respective fragmented ions are m/z 83.21 and m/z 85.16 correspondingly. The ion transition at m/z 99.16 > 83.21 was used for the quantification and m/z 101.14 > 85.16 was used for the confirmation of ClO4¯ in the studied samples.
3.2 Method validation
UPLC-MS/MS method validation was performed using earlier guidelines established by the European Commission relating to the performance of analytical methods and the interpretation of results which make assured the quality and comparability of the results obtained by the certified analytical research centers (European Commission, 2002). The analytical method validation was carried out by means of linearity, limit of detection (LOD), limit of quantification (LOQ), precision (run-to-run and day-to-day) and accuracy.
Linearity was performed by five individual calibration solutions at concentrations (0.05, 1, 10, 30, 60 and 100 µg/L) prepared in Milli-Q water (free from ClO4¯). Applying the most favorable experimental parameters, a linear correlation for the optimized analytical system was assessed by the chromatographic peak area as a function of the ClO4¯ levels, with the help of a linear regression equation using least-squares method. Calibration curve was found to be linear over the higher ClO4¯ levels with correlation coefficient (R2) > 0.9999. The equations of the regression line have been demonstrated in Table 3. The limit of detection (LOD, signal to noise (S/N) ratio of 3:1) and limit of quantification (LOQ, signal to noise (S/N) ratio of 10:1) of the UPLC-MS/MS method was evaluated at the lowest fortified amount of ClO4¯ in Milli-Q water (blank sample). The LOD and LOQ were found 0.009 µg/L and 0.030 µg/L, respectively (Table 3). The achieved LOD and LOQ values signify that the proposed technique is very sensitive and selective and can be appropriate for the low-level determination of ClO4¯ in water samples. The precision of the optimized method was evaluated on the basis of intra-day (run-to-run) and inter-day (day-to-day). The intra-day precision was estimated by analyzing five replicate injections of ClO4¯ standard (0.1 μg/mL) in the same day and inter-day precision was estimated by means five replicate injections of ClO4¯ standard (0.1 μg/mL) over three successive days. Acceptable intra-day and inter-day precision were achieved with relative standard deviation (RSD) ranging from 1.56% and 2.15% (Table 3). The accuracy was estimated with recovery study by fortifying the samples at low (2 µg/L) and high concentration (10 µg/L). The adequate recovery values at both concentrations were obtained ranging from 95% to 99% (Table 1). The achieved values from the validation study have authenticated that the proposed UPLC-MS/MS system can be effectively applied for the routine determination of ClO4¯ in water samples. *Standard solution of ClO4−; LOD, limit of detection (signal-to-noise, 3:1); LOQ, limit of quantification (signal-to-noise, 10:1); RSD, relative standard deviation.
Compound*
Correlation coefficient (R2)
LOD(µg/L)
LOQ(µg/L)
run-to-run precision (RSD%)
day-to-day precision (RSD%)
35ClO4−
0.9999
0.009
0.030
1.56
2.15
37ClO4−
0.9991
0.017
0.058
1.74
3.23
3.3 Comparison of UPLC-MS/MS method with earlier analytical methods
The comparison of developed UPLC-MS/MS method with earlier analytical methods has been illustrated in Table 4. Compared with the existing methods based on ion chromatography (IC), IC-MS/MS, UPLC-MS/MS, HILIC-MS/MS and LC-MS/MS (El Aribi et al., 2006; Chen et al., 2009, 2010; Xian et al., 2017; Yu-zhe et al., 2016; Zhao et al., 2018; Xiaofang et al., 2016; Sungur and Sangün, 2011; Lin et al., 2012), the proposed method has reduced the ClO4¯ retention time almost by 3–13 times (depending on the earlier applied methods) and the analysis times in part as a result of the elution in isocratic modes. The method sensitivity in the analysis of ClO4¯ has enhanced by greater extent which well encounters the need of high throughput sample analysis. However, the technique established in this work is limited to the determination of ClO4¯ in drinking water samples. The sensitivity and selectivity obtained by the present UPLC-MS/MS system advance the performance presented by previous published analytical methods for instance 0.2 µg/Kg by IC system (Sungur and Sangün, 2011); 0.005 µg/L by IC-ESI-MS/MS (El Aribi et al., 2006); 0.08 μg/L by HILIC-MS/MS (Chen et al., 2010); 0.01–0.2 μg/L (water) and 0.5 µg/Kg (tea) using HPLC-MS/MS (Chen et al., 2009; Lin et al., 2012); 0.1 µg/Kg (flour) and, 2.49 µg/Kg (tea) by LC-MS/MS (Xian et al., 2017; Xiaofang et al., 2016); 1–2.5 µg/Kg (tea) by UPLC-MS/MS (Yu-zhe et al., 2016). Eventually, the proposed method acquired lower LOD value (0.009 μg/L) and shorter retention time (0.51 min) when compared with UPLC-MS/MS (Yu-zhe et al., 2016) where LOD values (1–2.5 µg/Kg) and retention times (1.7–7.5 min) were achieved. Nevertheless, the sample matrix was different in previous applied UPLC-MS/MS than the current method. At the end, the proposed method was found to be very efficient, speedy, and simple for the analysis of ClO4¯ in drinking water samples. Moreover, after sample filtration the direct injection could be assumed to be a key benefit over the traditional approaches since sample pretreatment procedures increase the analysis time, decrease the precision of the method, and generally consequence in considerable losses of the analyzed compounds. SPE, Solid-phase extraction; QA-Mag-CCNTs, quaternary ammonium modified magnetic carboxyl-carbon nanotubes; LOD, limit of detection; LOQ, limit of quantification; *liquid samples measured in μg/L whereas solid samples measured in μg/Kg.
Sample
Extraction method
Determination method
Retention time (min)
LOD* (μg/L/μg/Kg)
LOQ* (μg/L/μg/Kg)
Recovery values (%)
RSD/%
References
Water
–
HPLC-MS/MS
5.9
0.2
–
105–114
3.8–6.1
Chen et al., 2009
Milk
Strata X SPE
HILIC-MS/MS
2.25
0.08
–
91.3–96.8
1.2–12
Chen et al., 2010
Flour
C18
LC-MS/MS
2.86
0.1
2
84.6–104.9
2.9–8.2
Xian et al., 2017
Tea
Cleanert PWAX SPE
UPLC-MS/MS
1.7
1
10
79.2–104.6
1.3–16.3
Liu et al., 2019
Tea
Carb SPE
UPLC-MS/MS
7.5
2.5
–
95.6–120
1.9–17.5
Yu-zhe et al., 2016
Tea
QA-Mag-CCNTs
LC-MS/MS
3.5
2.49
8.21
85.2–107
8.0
Zhao et al., 2018
Tea
–
IC-MS/MS
6.75
–
–
87.3–112.2
2.67
Xiaofang et al., 2016
Soil
–
IC
14
0.2
–
–
2.5
Sungur and Sangün, 2011
Water
–
IC-ESI-MS/MS
12
0.005
–
95.3–103
0.3–8.5
El Aribi et al., 2006
Tea
ENVI-Carb SPE
HPLC-MS/MS
≤26
0.5
1.5
94.4
6.81–9.85
Lin et al., 2012
Water
–
HPLC-MS/MS
≤26
0.01
0.05
100.3
5.08–6.23
Lin et al., 2012
Water
Filtration
UPLC-MS/MS
0.51
0.009
0.030
95–99
1.56–2.15
This work
3.4 Real sample analysis
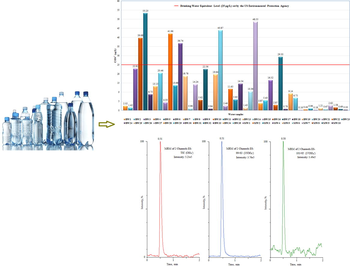
The developed UPLC-MS/MS method was practically applied for the analysis of ClO4¯ in drinking water samples which include thirty-five bottled water and ten metropolitan water samples. The disinfection treatment of bottled and metropolitan water was performed by ozonation oxidation and chlorination process, respectively. The results have been displayed in Table 1 and, as an example, Fig. 2 illustrates UPLC-MS/MS chromatogram of ClO4¯ and their respective mass spectra obtained in water samples (BW4). The chromatogram did not display any interference, as no noticeable matrix peak was identified in the elution time of the studied compound. The ClO4¯ have been identified in all of the analyzed samples ranging from 0.78 to 53.23 µg/L (bottled water) and 0.18 to 2.62 µg/L (metropolitan water) with adequate recovery rates ranging from 95% to 99%. The metropolitan water was found to be least contaminated than the bottled water where 84.4% of the samples were identified below the DWEL value 25 µg/L set by the EPA (Fig. 3) (Clark, 2000). However, ClO4¯ was still identified in both bottled and metropolitan water samples from Saudi Arabia. Therefore, the identifying and reducing the amount of ClO4¯ in water samples required additional concerns to encounter better needs of policies for end user health.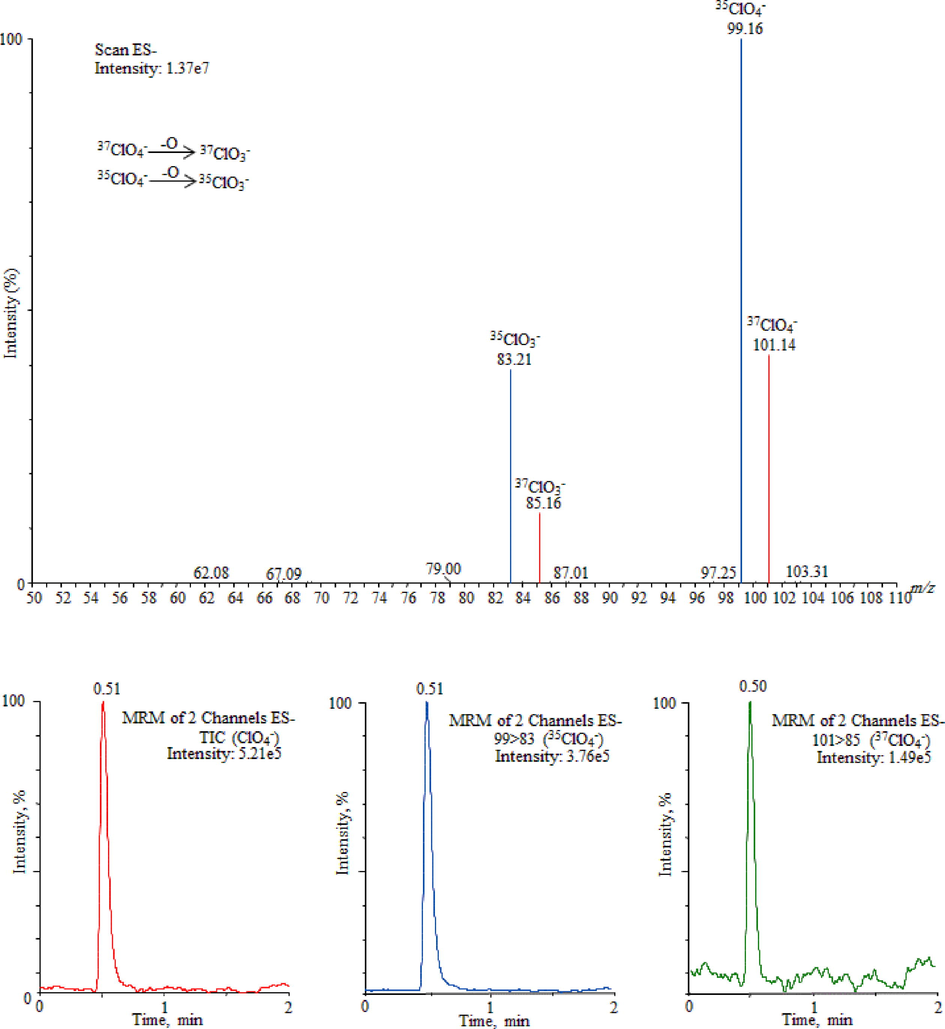
UPLC-MS/MS chromatogram of ClO4¯ and their respective mass spectra obtained in water samples (BW4).
Identified amounts of ClO4− in water samples and DWEL value 25 µg/L set by the EPA.
4 Conclusions
The UPLC-MS/MS has demonstrated to be a sensitive, selective, speedy and simple robust method particularly for the determination of ClO4¯ in drinking water samples. The use of Acquity BEH C18 column and sample filtration prior to the injection allowed the ClO4¯ separation from water samples in a very short analysis time (0.51 min). Furthermore, owing to high sensitivity and selectivity, the present method offers benefits over traditional methods in eradicating the laborious and expensive sample extraction process prior to analysis. The proposed method has shown rapid analysis time almost by 3–13 times compared to the earlier developed methods (Table 4). The ClO4¯ have been identified in all of the analyzed samples ranging from 0.78 to 53.23 µg/L (bottled water) and 0.18 to 2.62 µg/(metropolitan water) with adequate recovery rates ranging from 95% to 99%. The metropolitan water was found to be least contaminated than the bottled water where 84.4% of the samples were identified below the DWEL value 25 µg/L set by the EPA (Clark, 2000). Based on the facts, the method sensitivity in the analysis of ClO4¯ has enhanced by greater extent which well encounters the need of high throughput sample analysis.
Acknowledgements
The authors extend their appreciation to the Deputyship for Research & Innovation, “Ministry of Education” in Saudi Arabia for funding this research work through the project number IFKSURG-1437-004.
Declaration of Competing Interest
The authors declare that they have no known competing financial interests or personal relationships that could have appeared to influence the work reported in this paper.
References
- Almeer SH, Zogby IA, Hassan SS (2014) Novel miniaturized sensors for potentiometric batch and flow-injection analysis (FIA) of perchlorate in fireworks and propellants. Talanta 129:191-197.
- Adsorptive removal of Pb(II) ions from groundwater samples in Oman using carbonized Phoenix dactylifera seed (Date stone) J. King Saud Univ. Sci.. 2020;32:2931-2938.
- [Google Scholar]
- High performance liquid chromatographic-UV method for determination of atorvastatin calcium in pharmaceutical formulations. J. New Dev. Chem.. 2017;1(3):38-50.
- [Google Scholar]
- Determination of perchlorate in river by ion-pair hollow-fiber liquid-phase microextraction coupled with electrospray ionization tandem mass spectrometry. Talanta. 2009;79(2):442-445.
- [Google Scholar]
- Analysis of perchlorate in milk powder and milk by hydrophilic interaction chromatography combined with tandem mass spectrometry. J. Agric. Food Chem.. 2010;58(6):3736-3740.
- [CrossRef] [Google Scholar]
- Clark JJ (2000) Toxicology of perchlorate. In: Perchlorate in the Environment. Springer, pp 15-29.
- LC-ESI-MS/MS determination of oxyhalides (chlorate, perchlorate and bromate) in food and water samples, and chlorate on household water treatment devices along with perchlorate in plants. Chemosphere. 2019;235:757-766.
- [CrossRef] [Google Scholar]
- A novel approach for simultaneous analysis of perchlorate (ClO4−) and bromate (BrO3−) in fruits and vegetables using modified QuEChERS combined with ultrahigh performance liquid chromatography-tandem mass spectrometry. Food Chem.. 2019;270:196-203.
- [CrossRef] [Google Scholar]
- Analysis of perchlorate in foods and beverages by ion chromatography coupled with tandem mass spectrometry (IC-ESI-MS/MS) Anal. Chim. Acta. 2006;567(1):39-47.
- [CrossRef] [Google Scholar]
- Commission Decision of 12 August 2002 implementing Council Directive 96/23/EC concerning the performance of analytical methods and the interpretation of results. Off. J. Eur. Commun.. 2002;221:8-36.
- [Google Scholar]
- Determination of perchlorate in drinking water using ion chromatography. EPA Method. 1999;314:1999.
- [Google Scholar]
- Advances in the determination of inorganic ions in potable waters by ion chromatography. J. Environ. Monit.. 2002;4(1):10-15.
- [Google Scholar]
- Perchlorate contamination assessment and hypothyroidism in rat studies using water samples collected around Kovil Patti, Tuticorin District of Tamil Nadu, India. Microchem. J.. 2020;154:104570.
- [CrossRef] [Google Scholar]
- Perchlorate and iodide in dairy and breast milk. Environ. Sci. Technol.. 2005;39(7):2011-2017.
- [CrossRef] [Google Scholar]
- Trace identification of sulfate anion in bottled and metropolitan water samples collected from various provinces of Saudi Arabia. J. King Saud Univ. Sci.. 2020;32:1986-1992.
- [Google Scholar]
- Assessment of inorganic ion in drinking water using new method based on ultra-performance liquid chromatography-mass spectrometry. J. King Saud Univ. Sci.. 2020;32:2329-2335.
- [Google Scholar]
- Determination of bromate in drinking water by ultraperformance liquid chromatography-tandem mass spectrometry. J. Sep. Sci.. 2012;35(19):2538-2543.
- [CrossRef] [Google Scholar]
- Quantitative analysis of bromate in non-alcoholic beer using ultra performance liquid chromatography-electrospray ionization mass spectrometry. Anal. Methods. 2014;6(12):4038.
- [CrossRef] [Google Scholar]
- Method for the fast determination of bromate, nitrate and nitrite by ultra performance liquid chromatography–mass spectrometry and their monitoring in Saudi Arabian drinking water with chemometric data treatment. Talanta. 2016;152:513-520.
- [CrossRef] [Google Scholar]
- HPLC-ICPMS/MS shows a significant advantage over HPLC-ICPMS for the determination of perchlorate in ground, tap, and river water. Anal. Chim. Acta. 2020;1094:11-17.
- [CrossRef] [Google Scholar]
- Determination of perchlorate in drinking water by ion chromatography using macrocycle-based concentration and separation methods. J. Chromatogr. A. 2006;1118(1):100-105.
- [CrossRef] [Google Scholar]
- Analysis of perchlorate in water by reversed-phase LC/ESI-MS/MS using an internal standard technique. Anal. Chem.. 2005;77(14):4453-4458.
- [CrossRef] [Google Scholar]
- Quantitative determination of perchlorate in bottled water and tea with online solid phase extraction high-performance liquid chromatography coupled to tandem mass spectrometry. J. Chromatogr. A. 2012;1246:40-47.
- [CrossRef] [Google Scholar]
- Quantitative determination and contamination pattern of perchlorate in tea by ultra performance liquid chromatography and tandem mass spectrometry. Food Chem.. 2019;274:180-186.
- [CrossRef] [Google Scholar]
- Spatial distribution of perchlorate, iodide and thiocyanate in the aquatic environment of Tianjin, China: environmental source analysis. Chemosphere. 2014;111:201-208.
- [CrossRef] [Google Scholar]
- Maternal perchlorate exposure in pregnancy and altered birth outcomes. Environ. Res.. 2017;158:72-81.
- [CrossRef] [Google Scholar]
- Validation data for the determination of perchlorate in water using ion chromatography with suppressed conductivity detection. Environ. Sci. Eur.. 2016;28(1)
- [CrossRef] [Google Scholar]
- One-step sample processing method for the determination of perchlorate in human urine, whole blood and breast milk using liquid chromatography tandem mass spectrometry. Ecotoxicol. Environ. Saf.. 2019;174:175-180.
- [CrossRef] [Google Scholar]
- Ion chromatographic determination of perchlorate in foods consumed in Hatay region. Food Chem.. 2011;126(1):326-331.
- [CrossRef] [Google Scholar]
- Occurrence of perchlorate in indoor dust from the United States and eleven other countries: implications for human exposure. Environ. Int.. 2015;75:166-171.
- [CrossRef] [Google Scholar]
- Determination of perchlorate in infant formula by isotope dilution ion chromatography/tandem mass spectrometry. Food Additives Contam.: Part A. 2011;28(6):799-806.
- [CrossRef] [Google Scholar]
- Wendelken S, Munch D, Pepich B, Later D, Pohl C (2005) Method 331.0, Determination of Perchlorate in Drinking Water by Liquid Chromatography Electrospray Ionization Mass Spectrometry. Revision 1.0. US Environmental Protection Agency: Cincinnati, OH, USA.
- A modified quick, easy, cheap, effective, rugged, and safe cleanup method followed by liquid chromatography-tandem mass spectrometry for the rapid analysis of perchlorate, bromate and hypophosphite in flour. J. Chromatogr. A. 2017;1526:31-38.
- [CrossRef] [Google Scholar]
- Determination of perchlorates in tea by ion chromatography. Tandem mass spectrometry. Chi J. Chromatogr.. 2016;34
- [Google Scholar]
- Detection of perchlorate in tea by ultra high performance liquid chromatography with tandem mass spectrometry and isotope dilution method. Chi J. Food Hyg.. 2016;28(5):616-619.
- [Google Scholar]
- Challenges in determining perchlorate in biological tissues and fluids: Implications for characterizing perchlorate exposure. Anal. Chim. Acta. 2006;567(1):66-72.
- [CrossRef] [Google Scholar]
- Basis of the Massachusetts reference dose and drinking water standard for perchlorate. Environ. Health Perspect.. 2010;118(1):42-48.
- [CrossRef] [Google Scholar]
- Perchlorate in indoor dust and human urine in China: contribution of indoor dust to total daily intake. Environ. Sci. Technol.. 2015;49(4):2443-2450.
- [CrossRef] [Google Scholar]
- Perchlorate and iodide in whole blood samples from infants, children, and adults in Nanchang, China. Environ. Sci. Technol.. 2010;44(18):6947-6953.
- [CrossRef] [Google Scholar]
- Determination of perchlorate from tea leaves using quaternary ammonium modified magnetic carboxyl-carbon nanotubes followed by liquid chromatography-tandem quadrupole mass spectrometry. Talanta. 2018;185:411-418.
- [CrossRef] [Google Scholar]


