

Translate this page into:
Genetic divergence and phylogenetic relationship of the rabbitfish Siganus rivulatus inferred from microsatellite and mitochondrial markers
⁎Corresponding authors. nader.wheat@alexu.edu.eg (Nader R. Abdelsalam), meshafi@kau.edu.sa (Manal E. Shafi), helsanwey@kfu.edu.sa (Hesham A. Hassanien)
-
Received: ,
Accepted: ,
This article was originally published by Elsevier and was migrated to Scientific Scholar after the change of Publisher.
Peer review under responsibility of King Saud University.
Abstract
The rabbit fish, Siganus rivulatus, is a Mediterranean non-endogenous species, that has succeeded in migrating to the different coasts of the Mediterranean Sea. The success of this species in the new environment, with different trophic, biotic, and physical conditions, inspired the study of genetic variation between the Rea Sea and Mediterranean Sea populations. The current study aims to use microsatellite (SSR) and mitochondrial DNA sequence (mtDNA) markers to determine the genetic divergence and phylogenetic relationship of S. rivulatus from the Red Sea and the Mediterranean Sea. A total of 200 S. rivulatus samples (42.50 ± 3.89 gm) were collected from the Red Sea and the Mediterranean Sea. Twelve SSR loci were screened to detect genetic differentiation, in addition to those in mtDNA. The results for the SSR markers showed seventy polymorphic alleles, with an average of 5.83 alleles per locus. Additionally, the inter-population genetic diversity was 0.063. The nucleotide composition of the MT-CO1 sequences revealed clear variations between the two studied populations. Phylogenetic analyses indicated that the Red Sea samples were more versatile than the Mediterranean Sea samples. The results indicated that the mtDNA of S. rivulatus is very variable and a species-sensitive marker to detect possible genetic variations, which could be part of the eco-physiological adaptation and key to the success of the migrant S. rivulatus in the Mediterranean Sea.
Keywords
Genetic diversity
Rabbitfish
Microsatellite
Mitochondrial DNA

1 Introduction
Siganids (rabbit fishes) are a small family of marine herbivorous fish, with 27 species and two genera (Siganus and Lo), that are widely distributed in the tropical waters of the Indo-Pacific, Indian Ocean, and Red Sea (Woodland, 1983; Saoud, et al., 2008). Furthermore, these fish have been discovered in subtropical Mediterranean regions (Saoud, et al., 2008; Insacco and Zava, 2016). The siganidas were tolerant of a wide range of salinity and temperature levels (Woodland, 1983; Saoud, et al., 2007). The growth of siganida is comparable to that of other marine cultured species. It can reach a weight of 318.2 g and a length of 32 cm (Bariche, 2005). As herbivorous fish (mainly algaevorous), siganida can be reared for low-protein or vegetarian diets under captivity (Abou-Daoud, et al., 2014; Abass, et al., 2016), with a low environmental impact and nitrogen footprint (Roumieh, et al., 2013). Therefore, Marbled spinefoot rabbitfish, Siganus rivulatus, has a great fishery economic value and tremendous potential for intensive aquaculture production in warm water (Saoud, et al., 2008).
At the beginning of the last century and after the opening of the Suez Canal, S. rivulatus colonized the Mediterranean Sea by Lessepsian migration from the Red Sea, and the first record of this species in the Mediterranean was on the Palestinian coast in 1924 (Ben-Tuvia, 1964). Among a hundred species of Indo-Pacific fish species that were introduced into the Mediterranean, S. rivulatus succeeded in colonizing the eastern Mediterranean sea and spreading to the western Mediterranean, up to the Aegean sea and the Southern Mediterranean, from Egypt to Tunisia (Insacco and Zava, 2016). The introduction of these invasive species causes ecological changes (Zhao, et al., 2019). Furthermore, it may be able to adapt to the new environment, which will have different trophic and biotic conditions than the source water bodies (Bonhomme, et al., 2003). However, there were some alterations found in the ichthyofauna (prey size) and diet composition between the Mediterranean and Red Sea fish (Golani, 1993; 1996). To evaluate this eco-physiological adaptation of the invasive species, a study of the genetic diversity between populations, which provides clues to the population’s evolutionary and conservation history, is required (Williamson, 2001).
The development of molecular markers has the power to identify the genetic variations between individuals and evaluate the genetic diversity between or within species. Molecular markers, protein or DNA (genomic and mitochondrial DNA) are now being used in fisheries and aquaculture (Hallerman, 2003; Bektas and Belduz, 2009). The mitochondrial cytochrome c oxidase gene (MT-CO1) is frequently used as a barcoding method to identify animal species (Saoud, et al., 2007). For instance, mitochondrial DNA (mtDNA) sequences have been used as reliable markers for species identification, for instance, in tuna (Chow and Inoue, 1993), billfish (Finnerty and Block, 1992), snapper (Hare, et al., 1998), myctophidae (Suneetha, et al., 2000) and grey mullet (Murgia, et al., 2002). Additionally, mtDNA has been used as an adaptive evolution biomarker in several aquatic and terrestrial animals (Andrews, et al., 1998; Abdelsalam, et al., 2019). Therefore, the present work aimed to determine the genetic divergence and phylogenetic relationship between S. rivulatus from the Red and the Mediterranean Sea using microsatellite (SSR) and mitochondrial DNA sequence (mtDNA) markers.
2 Materials and methods
2.1 Sample collections
A total of 200 fish samples of S. rivulatus (42.50 ± 3.89 gm in weight, means ± SE) were collected from the Red Sea and the Mediterranean Sea. The samples (100 fish samples from each sea) were collected in a plastic sachet, immediately transported to the laboratory in an ice pack container and stored at −20 °C until use.
2.2 DNA extraction
Genomic DNA was obtained from the muscle tissues of S. rivulatus using a DNA extraction kit (G-Spin; iNtRON Biotechnology, Inc, Seongnam, Korea). The obtained DNA from all samples was stored at −20 °C until use. The quality of the DNA was detected by 1% agarose gel electrophoresis. The determination of the DNA concentration was conducted using a spectrophotometer (NanoDrop™ 2000 Spectrophotometer, Thermo Scientific).
2.3 Microsatellite markers assay
Twelve SSR loci were screened for 200 S. rivulatus samples (Table 1). These microsatellites were reported by (Ravago-Gotanco, et al., 2010). Amplification of SSR was assayed in PCR reactions in a total volume 25 μl, containing 20 ng template DNA, 1X PCR buffer (Promega), 0.3 mM of each dNTPs, 0.1 U of Taq polymerase (GoTaq, Promega), and 0.5 mM of each primer. The PCR conditions were 5 mins at 94 °C, followed by 60 sec at 94 °C, 45 sec at 50 °C and 60 Sec at 72 °C for 35 cycles, with a final step of 10 mins at 72 °C. The PCR products were separated on %6 denaturing polyacrylamide gels in 1X TBE buffer. After electrophoresis, the gel was stained with silver nitrate solution and photographed. A 100 bp DNA ladder plus (iNtRON Biotechnology, Inc, Seongnam, Korea) was used to detect the obtained PCR products.
Locus
Primer sequence (5′-3′)
Repeated motif
Sfus-5
F: GGTAAGGGGCCAGCAAAT
R: CCATTTCAGGTTTGCATGTG(GT)16
Sfus-6
F: ACAATCCAGGATGCAAGTCC
R: CGAATTGCCACATGCAATAA(AC)10
Sfus-8
F: TCAAAAAGAAGAGCAAGGAGAA
R: AAGAGAGGATGGGTTTGTGG(AGAA)17
Sfus-9
F: CAATGTGTCACAGATGGTAACAA
R: TGGCCTGGTGCTTTTCTACT(AG)8
Sfus-21
F: CCCAGCTTTTGTTTTATTCA
R: TGCAAGCTTTTAGAAGACTGTAT(CT)27
Sfus-22
F: GAGCACAACAGGCATTTGAA
R: CTGGGATCAGAGGGTGAAAG(AC)19
Sfus-56
F: ACGATACAGGGGCAACAATA
R: TGCTCGGCTTTTATATTATGAC(TTC)4
Sfus-76
F: ACGAGTAAGGACGTTGTCCA
R: AAATGTTCTCTGTCTCCTCATTTTT(TG)32
Sfus-95
F: TCCTCCTTGCTTTTCCTGTG
R: ATCACTGTGCCCCACACAAT(CT)20
Sfus-98
F: TATGAACACTTCCGCTGCTG
R: ACCCAAACCCATTTTCACAC(GT)16
Sfus-113
F: CTTCGCCTGAACCCTCATCT
R: TGGAGTAACAGTCCAGGTTGTG(TG)21
Sfus-167
F: CAACGTGCTGCCTCTAAACA
R: GCCAAGGTTTTCCATTTAGC(AC)15
2.4 Data analysis
Microsatellites data were calculated by using GenAlEx Version 6.5 Software (Peakall and Smouse, 2006) and POPGENE Version 1.32 Software (Yeh, et al., 1999) to determine genetic parameters, such as genetic variation (Ht), inter-population genetic diversity (GST), Nei’s genetic diversity (Ne), gene flow (Nm), and genetic distance between two S. rivulatus populations.
3 Mitochondrial cytochrome oxidase subunit I gene (MT-CO1).
To study the MT-CO1, 36 S. rivulatus individuals from the Red Sea and Mediterranean Sea (18 samples from each sea, 9 males and 9 females) were used, and the MT-CO1 primer sequences used with the S. rivulatus individuals from both seas are shown in Table 2.
Primer name
Primer sequence (50–30)
FishF1
5′-TCAACCAACCACAAAGACATTGGCAC-3′
FishF2
5′-TCGACTAATCATAAAGATATCGGCAC-3′
FishR1
5′-TAGACTTCTGGGTGGCCAAAGAATCA-3′
FishR2
5′-ACTTCAGGGTGACCGAAGAATCAGAA-3′
3.1 MT-CO1 primers
To amplify the target region of the MT- CO1 gene, universal primer pairs (F. 5′-TCGACTAATCATAAAGATATCGGCAC-3′ and R. 5′-TAGACTTCTGGGTGGCCAAAGAATCA-3′), were used as universal for fishes (Ward, et al., 2005). The different combinations of primers were made to detect the most suitable and productive one. The different primer combinations that were used in the present study are presented in Table 3.
Combination name
Primers combinations
Combination 1
FishF1- 5′-TCAACCAACCACAAAGACATTGGCAC-3
FishR1-5′-TAGACTTCTGGGTGGCCAAAGAATCA-3′
Combination 2
FishF2- 5′-TCGACTAATCATAAAGATATCGGCAC-3′
FishR2- 5′-ACTTCAGGGTGACCGAAGAATCAGAA-3′
Combination 3
FishF2- 5′-TCGACTAATCATAAAGATATCGGCAC-3′
FishR1-5′-TAGACTTCTGGGTGGCCAAAGAATCA-3′
Combination 4
FishF1- 5′-TCAACCAACCACAAAGACATTGGCAC-3′
FishR2- 5′-ACTTCAGGGTGACCGAAGAATCAGAA-3′
3.2 PCR amplification conditions
The PCR amplification was carried out, with an initial denaturation at 94 °C for 5 min, followed by 35 cycles of PCR amplification (denaturation at 94 °C for 60 sec, annealing at (55 °C) for 45 sec, and extension at 72 °C for 45 sec, with a final extension at 72 °C for 7 min). The PCR products were confirmed by 2% agarose gel electrophoresis, and a 100 bp DNA ladder plus (iNtRON Biotechnology, Inc, Seongnam, Korea) was used to determine the size of the obtained fragments. The electrophoresis run was achieved at 75 V in a DNA electrophoresis unit (Bio-Rad) for 90 mins.
3.3 DNA bands elution from the agarose gel
The DNA bands of the MT-CO1 gene were eluted from the agarose gel using an elution kit from iNtRON Biotechnology, Inc. Korea. For the elution, 40 l of PCR product from each sample was loaded into a 0.8% agarose medium. The elution steps were conducted according to Kit manual.
3.4 MT-CO1 gene sequence analysis
Partial sequencing of the MT-CO1 gene from thirty-six S. rivulatus samples was carried out using a BigDye® Terminator v3.1 Cycle Sequencing Kit and an Applied Biosystems 373xl DNA Analyzer (Korea). DNA sequencing was conducted using a forward-specific primer. To obtain the related sequences of MT-CO1 from GenBank, the Blast program from the National Center for Biotechnology Information (NCBI), USA (https://www.ncbi.nlm.nih.gov/Blast) was used. Related MT-CO1 gene sequences were recovered from GenBank and were aligned with the MT-CO1 gene sequences from the different locations to construct a Neighbor-Joining tree. Phylogenetic analyses were conducted using MEGA X (Kumar, et al., 2018). Firstly, a Neighbor-Joining tree was constructed from samples of every location, which were considered separately, for the two sea samples and the sample from GenBank. The positions containing alignment gaps and lost data were eliminated only in the pairwise sequence comparisons (pairwise deletion option). In MEGA X, bootstrapping of 500 replicas (Felsenstein, 1985) were used.
4 Results
4.1 Morphological measurements
In this study, the results of morphological measurements of studied samples of S. rivulatus indicated that the fish has a total body length of 17.5–19.5 cm and a depth of 6.0–6.5 cm for Red and Mediterranean Sea samples, respectively, as shown in Table 4. The total body length was about 2.9 times the depth. The depth was 34% of the length for the two sea samples. The head length was 4.0 cm, and the width was 4.5 cm for the Red Sea samples, whereas the head length for the Mediterranean Sea samples was more than those from the Red Sea (4.5 cm). The head depth was between 100 and 113% of the head length (113% for the Rea Sea and 100% for the Mediterranean Sea samples). For all of the studied samples, there were 13 spines in the dorsal fin and 7 spines in the anal fin.
Body part
Sample source
Total length (cm)
The depth (cm)
Head length (cm)
Head depth (cm)
Depth % of the length
Head length % of the total length
Head depth % of head length
Mean
Red Sea
17.50 ± 1.50
6.0 ± 1.34
4.0 ± 0.67
4.5 ± 0.24
34.1 ± 2.5
22.7 ± 1.8
113.0 ± 8.2
Mediterranean Sea
19.0 ± 2.13
6.5 ± 0.95
4.5 ± 0.74
4.5 ± 0.52
34.3 ± 3.4
23.2 ± 2.1
100.4 ± 5.9
4.2 Microsatellite markers detection
All of the twelve SSR marker locus primers that were tested for 200 S. rivulatus samples from the Red and the Mediterranean Sea gave clear amplified polymorphic fragments of DNA. As presented in Table 5, allele numbers ranged from 5 to 12 alleles. Seventy polymorphic alleles were obtained, with an average of 5.83 alleles per locus for two populations. The allele’s size ranged from 130 to 380 bp. The SSR data analyses showed that the percentage of polymorphism was 62.8 and 65.0 for the Red Sea and the Mediterranean Sea populations, respectively. The intra-population genetic diversity (Hs) was 0.314 while the GST was 0.063 for two S. rivulatus populations. In addition, the genetic distance assessed by the SSR system between the Red Sea population and the Mediterranean Sea population was 0.053 (Table 5). NPA/TNA, number of polymorphic alleles / total number of alleles; P (%), percentage of polymorphism.
Populations
Total
Red Sea
Mediterranean Sea
Locus
NPA/TNA
P (%)
NPA/TNA
P (%)
NPA/TNA
P (%)
Sfus-5
4/6
66.7
5/6
83.3
2/4
50
Sfus-6
7/12
58.4
4/7
57.1
5/8
62.5
Sfus-8
7/7
100
5/7
71.4
7/7
100
Sfus-9
9/11
81.8
4/7
57.1
3/9
33.3
Sfus-21
6/8
75.0
6/6
100
3/7
42.8
Sfus-22
9/11
81.9
5/9
55.5
5/8
62.5
Sfus-56
4/7
57.1
4/7
57.1
4/5
80
Sfus-76
6/10
60.0
4/8
50
5/8
62.5
Sfus-95
7/9
77.78
4/7
57.1
5/8
62.5
Sfus-98
3/5
60.0
2/4
50
4/5
80
Sfus-113
2/6
33.4
2/5
40
5/6
83.3
Sfus-167
6/8
75.0
4/5
80
6/8
75
Total
70/100
70.0
49/78
62.8
54/83
65.0
Mean
5.83/8.33
–
4/6.5
–
4.5/6.9
–
Total genetic diversity (Ht)
0.437 ± 0.008
intra-population genetic diversity (Hs)
0.314 ± 0.015
inter-population genetic diversity (Gst)
0.063
Estimation of gene flow (Nm)
5.37
Genetic distance
0.053
4.3 MT-CO1 gene sequence analysis
As is clear from the combination 3 of primers (Table 6) gave the best result in terms of suitable product length and quantity of PCR product (amplicon). For MT-CO1 gene amplification, the combination 3 was used to amplify about 650 bp fragment of the gene size.
Sample
T
A
C
G
Total
M1
28.3
30.3
23.5
17.9
647
M10
29.5
27.0
24.6
18.9
647
M11
28.8
24.5
22.5
24.3
552
M12
28.4
30.0
24.1
17.5
651
M13
28.4
30.0
24.1
17.5
651
M14
29.2
28.0
24.3
18.5
654
M15
30.0
28.3
23.8
17.8
629
M16
29.0
29.8
23.2
17.9
630
M17
29.3
29.6
23.7
17.4
649
M18
28.9
29.2
23.9
17.9
636
M2
28.8
31.7
22.6
16.9
638
M3
28.8
31.7
22.6
16.9
638
M4
30.3
27.7
24.0
18.1
647
M5
30.2
28.5
24.1
17.1
648
M6
31.2
28.1
22.1
18.5
551
M7
30.4
27.7
22.6
19.3
553
M8
29.7
28.8
24.0
17.5
646
M9
29.7
28.8
24.0
17.5
646
Avg
29.4
28.9
23.6
18.1
628
4.4 The Mediterranean Sea samples
The data in Tables 6 and 7 shows the phylogenetic tree between the Mediterranean Sea samples. The phylogenetic tree branched into four main clusters. The first cluster contains M10 and M11, and the second and the third contain one sample for each (M7 and M6, respectively). The other samples (14 samples) are in the fourth one. The average nucleotide composition percentage was 29.4%, 28.9%, 23.6% and 18.1% for T, C, A and G, respectively (Tables 6 and 7).
M1
M2
M3
M4
M5
M6
M7
M8
M9
M10
M11
M12
M13
M14
M15
M16
M17
M1
M2
0.06
M3
0.06
0.00
M4
0.10
0.12
0.12
M5
0.10
0.12
0.12
0.00
M6
0.12
0.14
0.14
0.05
0.05
M7
0.12
0.14
0.14
0.06
0.06
0.06
M8
0.10
0.13
0.13
0.03
0.03
0.05
0.05
M9
0.10
0.13
0.13
0.03
0.03
0.05
0.05
0.00
M10
0.15
0.17
0.17
0.09
0.09
0.08
0.08
0.09
0.09
M11
0.21
0.23
0.23
0.15
0.15
0.16
0.14
0.15
0.15
0.16
M12
0.04
0.08
0.08
0.12
0.11
0.13
0.13
0.12
0.12
0.16
0.21
M13
0.04
0.08
0.08
0.13
0.11
0.13
0.13
0.12
0.12
0.16
0.21
0.00
M14
0.11
0.15
0.15
0.05
0.04
0.07
0.07
0.05
0.05
0.11
0.17
0.13
0.13
M15
0.10
0.14
0.14
0.03
0.03
0.06
0.06
0.04
0.04
0.08
0.16
0.11
0.11
0.04
M16
0.03
0.07
0.07
0.11
0.11
0.12
0.12
0.10
0.10
0.14
0.21
0.01
0.01
0.12
0.11
M17
0.02
0.06
0.06
0.09
0.09
0.12
0.12
0.09
0.09
0.14
0.21
0.03
0.03
0.11
0.10
0.02
M18
0.03
0.07
0.07
0.11
0.11
0.12
0.12
0.11
0.11
0.15
0.20
0.03
0.03
0.12
0.10
0.02
0.02
4.5 Red Sea samples
The phylogenetic tree between the Red Sea samples is presented in Tables 8 and 9. The tree branched into three main clusters. The first cluster includes four samples (R4, R10, R12, and R18), and the second includes three samples (R1, R2 and R5), whereas there are 11 samples in the third cluster (R3, R6, R7, R8, R9, R11, R13, and R14). The average nucleotide composition percentage was 29.3%, 29.0%, 24.0%, and 17.7% for T, C, A and G, respectively (Tables 8 and 9).
Sample
T
C
A
G
Total
R1
29.4
28.6
24.1
17.8
646
R2
29.4
28.6
24.1
17.8
646
R3
29.5
28.0
24.5
18.0
633
R4
29.6
28.5
24.1
17.8
646
R5
28.7
28.7
24.8
17.7
648
R6
29.5
28.5
24.3
17.7
638
R7
29.2
28.7
24.1
17.9
647
R8
29.1
28.7
25.0
17.2
647
R9
29.9
29.0
23.6
17.5
639
R10
29.3
28.5
24.3
18.0
646
R11
29.2
29.2
24.0
17.6
641
R12
29.1
28.8
23.9
18.3
640
R13
28.7
30.6
23.3
17.3
647
R14
28.7
30.6
23.3
17.3
647
R15
30.0
27.9
25.0
17.1
560
R16
29.4
30.2
22.9
17.5
650
R17
29.7
29.8
23.0
17.5
640
R18
29.3
28.5
24.3
18.0
646
Avg.
29.3
29.0
24.0
17.7
639
R1
R2
R3
R4
R5
R6
R7
R8
R9
R10
R11
R12
R13
R14
R15
R16
R17
R1
R2
0.00
R3
0.01
0.01
R4
0.01
0.01
0.02
R5
0.01
0.01
0.02
0.02
R6
0.02
0.02
0.02
0.02
0.02
R7
0.03
0.03
0.02
0.03
0.03
0.04
R8
0.02
0.02
0.02
0.02
0.02
0.03
0.03
R9
0.03
0.03
0.02
0.02
0.02
0.01
0.04
0.03
R10
0.01
0.01
0.01
0.01
0.02
0.02
0.03
0.02
0.02
R11
0.02
0.02
0.02
0.02
0.03
0.03
0.04
0.01
0.03
0.02
R12
0.02
0.02
0.02
0.02
0.03
0.04
0.05
0.03
0.04
0.02
0.03
R13
0.10
0.10
0.10
0.10
0.10
0.10
0.10
0.10
0.10
0.10
0.10
0.10
R14
0.10
0.10
0.10
0.10
0.10
0.10
0.10
0.10
0.10
0.10
0.10
0.10
0.00
R15
0.04
0.04
0.04
0.04
0.05
0.05
0.06
0.04
0.05
0.04
0.04
0.05
0.13
0.13
R16
0.10
0.10
0.09
0.10
0.10
0.09
0.11
0.10
0.09
0.10
0.10
0.10
0.02
0.02
0.12
R17
0.10
0.10
0.09
0.10
0.10
0.09
0.11
0.10
0.09
0.10
0.10
0.10
0.02
0.02
0.12
0.00
R18
0.01
0.01
0.01
0.01
0.02
0.02
0.03
0.02
0.02
0.00
0.02
0.02
0.10
0.10
0.04
0.10
0.10
4.6 GenBank samples, Red and Mediterranean Sea samples
All of the obtained sequences of S. rivulatus from the Red and Mediterranean Sea samples and GenBank sequences were used in the Neighbor-Joining tree construction, as shown in Fig. 1. The Neighbor-Joining tree indicates that different samples from the Red and the Mediterranean Sea are distributed in different clusters. The tree branched into five clusters. Two clusters include samples from the Red and the Mediterranean Seas, and the other three clusters include samples from the Rea Sea only.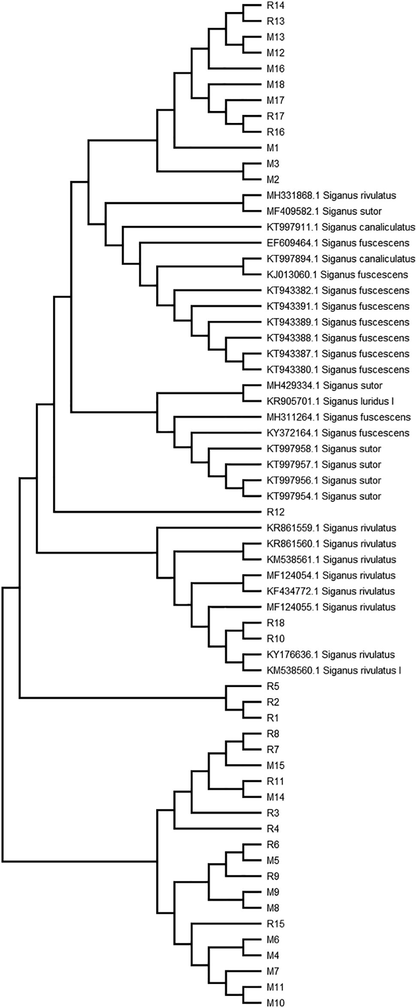
Neighbor-Joining tree of S. rivulatus MT-CO1 gene sequences from GenBank and the Red and Mediterranean Sea. Bootstrapping of 500 replicates; R: Red Sea sample; and M: Mediterranean Sea sample.
Previous results indicate that there are five haplotypes of S. rivulatus from the two seas, based on a partial sequence of the MT-CO1 gene. The Red Sea samples were more versatile than the Mediterranean Sea samples. The Red Sea samples were included in five haplotypes, whereas the Mediterranean Sea samples involved two haplotypes.
5 Discussion
The aquatic environmental conditions in the Mediterranean Sea are completely different from those in the Red Sea. The success of non-endogenous species motivates the evaluation of the gene flow associated with the adaptation of these species to the new aquatic systems (Hassan, et al., 2003). Siganida is one of the species that succeeded in occupying the Mediterranean, from the east to the west coasts (Insacco and Zava, 2016). Therefore, this species is an ideal candidate for evaluating the genetic variations between invasive and native populations of the Mediterranean and Red Sea, respectively.
The use of molecular markers in detecting genetic variations in fishes has been fully established, for instance, in (Asensio, et al., 2002; Rasmussen, et al., 2003). It has been proven that molecular markers can aid in species-specific diagnostics, in determining phylogenetic relationships, hybrid relationships, the stage of morphologically close species, and in resolving taxonomic ambiguities. There are various types of DNA markers, including SSRs, that are devolved to fish populations and reveal high genetic variation levels, spread throughout the fish genome (Chauhan and Rajiv, 2010).
In the present study, seventy polymorphic alleles were obtained, with an average of 5.83 alleles per locus. The alleles’ size ranged from 130 to 380 bp. The same results were obtained in (Ravago-Gotanco, et al., 2010) for Siganus fuscescens using eleven of the twelve SSR markers, which were tested with S. rivulatus. However, in the twelfth marker (Sfus-98), the range of the allele size was 198–248 bp, instead of 100–220 bp, as it was in our study. This is due to the difference between the species S. rivulatus and S. fuscescens of the same genus, which were used in the two studies. Microsatellites were used to study the genetic variability between the different species of fish (Hassanien and Al‐Rashada, 2019). The genetic variability of French and Czech strains of common carp (Cyprinus carpio) was studied using microsatellites (Desvignes, et al., 2001). The genetic divergence estimated within/between hatchery and wild populations of Japanese flounder via SSR markers, the GST determined based on the microsatellite markers was 0.063, demonstrating that 6.3% of the total genetic variability was between two populations and 93.7% was within populations (Sekino, et al., 2001). Estimated gene flow (Nm) between two populations was 5.37, indicating high gene flow. These data demonstrate that S. rivulatus is a separated population. On the other hand, the genetic distance estimated by the microsatellite system between the Mediterranean population and the Red Sea population had the lowest value of 0.053. Microsatellite technique as co-dominant proofed that powerful tool to determine the level of population differentiation (Hassanien and Al‐Rashada, 2019). However, the present findings did not show any strong genetic differentiation between the two populations of the Mediterranean, and the Red Sea with the SSR technique (6.3%). This could be attributed to the huge number of migrants that participated in the initial colonization or the continuous gene flow from the origin populations via the Suez canal due to the water connection between the two environments (Bonhomme, et al., 2003; Hassan, et al., 2003). Moreover, the low difference between the two studied populations in the present work could be due to the collection of samples being from one area for each population. Additionally, specific SSR marker primers need to be designed for S. rivulatus. This can be overcome through MT-CO1 sequence analysis. In this regard, thirty-six samples of S. rivulatus from the Red Sea and Mediterranean Sea were used in the current investigation to study the mtDNA sequence. The application of mtDNA in fish biology and reported that mtDNA showed a lot of interest for many species, especially for population, phylogeny, and evolutionary studies (Hallerman, 2003).
The study of mtDNA can contribute to the identification of the stock and analysis of mixed fisheries. In a previous study (Ward, et al., 2005), two hundred and seven species of Australia’s fish species were sequenced for a 655 bp region of the MT-CO1. The authors concluded that MT-CO1 sequencing could be used to identify fish species. In the current study, the average nucleotides composition percentage of the Red Sea samples were 29.3%, 29.0%, 24.0%, and 17.7%, respectively, and those for the Mediterranean Sea were 29.4%, 28.9%, 23.6%, and 18.1% for T, C, A and G, respectively. The CG content was 46.7%, and 47% for the Red and the Mediterranean Sea samples, respectively. The GC content of the 655 bp MT-CO1 region was, on average, higher in 143 studied fish species than in the others (61 species), at 47.1% and 42.2%, respectively (Ward, et al., 2005). Phylogenetic analysis of the present study of the S. rivulatus MT-CO1 gene sequences (about 650 bp) of the samples from the two seas and GeneBank sequences indicated that different samples from the two locations were distributed in different clusters. These findings suggested that there are five haplotypes from the S. rivulatus of the two seas based on the partial sequence of the MT-CO1 gene. The Red Sea samples were more versatile than the Mediterranean Sea samples. The Red Sea samples included five haplotypes, whereas the Mediterranean Sea samples included two haplotypes. This indicates the differences between the samples from the two seas. However, the absence of genetic differences among the Mediterranean and the Red Sea populations of the S. rivulatus using mtDNA (cytochrome b) was not reported (Bonhomme, et al., 2003). Their result suggests that the Mediterranean populations were not initiated by a few individuals, but rather that the immigration of fish into the Mediterranean Sea is a continuous process. The differences between the results of Bonhomme, et al. (2003) and the present study may be related to the time of sampling, which was done in 1997. That means there are over 20 years, as this time is enough to reproduce over 15 successive generations in this species in the Mediterranean Sea, which could induce some mutation and differentiation in mitochondrial DNA. Also, the difference between the studied mitochondrial genes. Population migration and increasing genetic variation (Xue, et al., 2014). The influence of migration and gene flow on genetic diversity also depends on the effective size of the receiving population and the number of migrants. The success of S. ivulatus in colonizing the Mediterranean Sea could be explained by the current findings, which showed the mtDNA variations between the Mediterranean Sea and Red Sea populations. However, the genetic alteration could induce eco-physiological adaptation in S. rivulatus, allowing for their success in the Mediterranean Sea (Hassan, et al., 2003). Cytochrome c oxidase is a key enzyme in aerobic metabolism in the animal body (Castresana, et al., 1994). This enzyme contributes to water formation and cellular energy conservation (Groening, et al., 2011). Accordingly, the adaptive mutation and variation in the mtCO1 gene between the two studied populations could be attributed to the environmental conditions and nutrition status in both the Mediterranean and Red Sea. However, mitochondrial cytochrome genes with other mitochondrial proteins are involved in the accelerated evolution concert in the kingdom, Animalia (Andrews, et al., 1998). In accordance, the Mediterranean and Red Sea populations of the Lessepsian migrant Atherinomorus lacunosus had high mtDNA diversity (Bucciarelli, et al., 2002).
6 Conclusion
The results of the present work, depending on SSR markers, indicated that there is low genetic variation between the Red and the Mediterranean Sea populations. However, the mitochondrial DNA of S. rivulatus from the Mediterranean and the Red Sea is highly variable and a good marker to detect possible genetic differences between different populations. Additionally, the variations in MT-CO1 could be due to the eco-physiological adaptation of this key enzyme through cellular metabolism. However, more studies should be conducted to estimate the mutation rates in different mtDNA in the invasive S. rivulatus populations. Additionally, future studies should investigate the genomic variation among the different populations along the Mediterranean coasts to gain greater insight into the adaptation of S. rivulatus to the new aquatic environment. The novelty of our study comes from the use of the mitochondrial cytochrome oxidase subunit I gene (MT-CO1) as a diversity biomarker and physiological indicator for the eco-physiological adaptation of Rabbitfish.
Acknowledgements
The authors would like to thank all staff members in the Genetic Engineering and Biotechnology Research Institute, Sadat City, Egypt for performing the genetic analysis. University of Sadat City, Egypt. Special gratitude goes to the staff in the Faculty of Agriculture (Saba Basha), Alexandria University and Faculty of Agriculture, Cairo University, Egypt. for their continuous help in conducting the data collection and analysis part of the study. Also, the authors appreciate Deanship of Scientific Research (DSR), King Abdulaziz University, Jeddah, Saudi Arabia for funding of this publication.
Availability of data and materials
The dataset in the current study is available from the corresponding author upon request.
Funding
This project was supported by the Deanship of Scientific Research (DSR) at King Abdulaziz University, Jeddah, Saudi Arabia. The authors therefore acknowledge the DSR for technical and financial support.
Ethical approval
The Ethical Committee of the Alexandria University approved the fish handling and samples collection procedures with the agreement number AU:14/18/01/16/01/06.
Consent to participate
Not applicable.
Consent for publication
Not applicable.
Declaration of Competing Interest
The authors declare that they have no known competing financial interests or personal relationships that could have appeared to influence the work reported in this paper.
References
- Genotype-environment interactions for survival at low and sub-zero temperatures at varying salinity for channel catfish, hybrid catfish and transgenic channel catfish. Aquaculture. 2016;458:140-148.
- [Google Scholar]
- Morphological, biochemical, molecular, and oil toxicity properties of Taxodium trees from different locations. Ind. Crops Prod.. 2019;139:111515.
- [Google Scholar]
- Effect of dietary protein level on growth performance and blood parameters of marbled spinefoot Siganus rivulatus. J. Appl. Aquacult.. 2014;26(2):103-118.
- [Google Scholar]
- Accelerated evolution of cytochrome b in simian primates: adaptive evolution in concert with other mitochondrial proteins? J. Mol. Evol.. 1998;47(3):249-257.
- [Google Scholar]
- Application of random amplified polymorphic DNA (RAPD) analysis for identification of grouper (Epinephelus guaza), wreck fish (Polyprion americanus), and Nile perch (Lates niloticus) fillets. J. Food Prot.. 2002;65:432-435.
- [Google Scholar]
- Age and growth of Lessepsian rabbitfish from the eastern Mediterranean. J. Appl. Ichthyol.. 2005;21(2):141-145.
- [Google Scholar]
- PCR based idendification and discrimination of Caranx rhonchus (Pisces, Carangidae) based on nuclear and mtDNA sequences. J. Anim. Veter. Adv.. 2009;8:518-525.
- [Google Scholar]
- Two siganid fishes of Red Sea origin in the eastern Mediterranean. Haifa: Ministry of Agriculture, Department of Fisheries, Sea Fisheries Research Station; 1964. p. :1-8.
- Lack of mitochondrial differentiation between Red Sea and Mediterranean populations of the Lessepsian rabbitfish, Siganus rivulatus (Perciformes: Siganidae) Scientia marina.. 2003;67:215-217.
- [Google Scholar]
- Genetic cryptic species as biological invaders: the case of a Lessepsian fish migrant, the hardyhead silverside Atherinomorus lacunosus. J. Exp. Mar. Biol. Ecol.. 2002;273(2):143-149.
- [Google Scholar]
- Evolution of cytochrome oxidase, an enzyme older than atmospheric oxygen. EMBO J.. 1994;13(11):2516-2525.
- [Google Scholar]
- Molecular markers and their applications in fisheries and aquaculture. Adv. Biosci. Biotechnol.. 2010;01(04):281-291.
- [Google Scholar]
- Intra-and interspecific restriction fragment length polymorphism in mitochondrial genes of Thunnus tuna species. Bull. Natl. Res. Inst. Far. Seas Fish.. 1993;30:207-225.
- [Google Scholar]
- Genetic variability in reared stocks of common carp (Cyprinus carpio L.) based on allozymes and microsatellites. Aquaculture. 2001;194(3-4):291-301.
- [Google Scholar]
- Confidence limits on phylogenies: an approach using the bootstrap. Evolution. 1985;39(4):783-791.
- [Google Scholar]
- Direct sequencing of mitochondrial DNA detects highly divergent haplotypes in blue marlin (Makaira nigricans) Mol. Mar. Biol. Biotech,. 1992;1:206-214.
- [Google Scholar]
- Trophic adaptation of Red Sea fishes to the eastern Mediterranean environment—Review and new data. Israel J. Zool.. 1993;39:391-402.
- [Google Scholar]
- The marine ichthyofauna of the Eastern Levant—history, inventory, and characterization. Israel J. Ecol. Evol.. 1996;42:15-55.
- [Google Scholar]
- Glutamine restores myocardial cytochrome C oxidase activity and improves cardiac function during experimental sepsis. J. Parenteral Enteral Nutrit.. 2011;35(2):249-254.
- [Google Scholar]
- Population Genetics: Principles And Applications For Fisheries Scientists. Bethesda, MD, USA: American Fisheries Society; 2003.
- A correction to: biological and oceanographic insights from larval labrid (Pisces: Labridae) identification using mtDNA sequences. Mar. Biol.. 1998;130(4):589-592.
- [Google Scholar]
- Lessepsian invasion without bottleneck: example of two rabbitfish species (Siganus rivulatus and Siganus luridus) J. Exp. Mar. Biol. Ecol.. 2003;291(2):219-232.
- [Google Scholar]
- Estimation of genetic variation in green tiger prawn, Penaeus semisulcatus by using random amplified polymorphic DNA, inter simple sequence repeat and simple sequence repeat markers. Aquac. Res.. 2019;50(6):1626-1633.
- [Google Scholar]
- Insacco, G., Zava, B., 2016. First record of the Marbled spinefoot Siganus rivulatus Forsskål & Niebuhr, 1775 (Osteichthyes, Siganidae) in Italy. New Mediterranean Biodiversity Records (March 2016), 230-252.
- MEGA X: molecular evolutionary genetics analysis across computing platforms. Mol. Biol. Evol.. 2018;35:1547-1549.
- [Google Scholar]
- Genetic identification of grey mullet species (Mugilidae) by analysis of mitochondrial DNA sequence: application to identify the origin of processed ovary products (bottarga) Mar. Biotechnol.. 2002;4(2):119-126.
- [Google Scholar]
- GENALEX 6: genetic analysis in Excel. Population genetic software for teaching and research. Mol. Ecol. Notes. 2006;6(1):288-295.
- [Google Scholar]
- Identification of a genetic marker that discriminates ocean-type and stream-type Chinook salmon in the Columbia River basin. Trans. Am. Fish. Soc.. 2003;132(1):131-142.
- [Google Scholar]
- Isolation and characterization of thirteen microsatellite markers for the rabbitfish, Siganus fuscescens. Conserv. Genet. Resour.. 2010;2(S1):225-227.
- [Google Scholar]
- Acute and chronic effects of aqueous ammonia on marbled spinefoot rabbitfish, Siganus rivulatus (Forsskål 1775) Aquac. Res.. 2013;44:1777-1790.
- [Google Scholar]
- Effects of stocking density on the survival, growth, size variation and condition index of juvenile rabbitfish, Siganus rivulatus. Aquacult. Internat.. 2008;16(2):109-116.
- [Google Scholar]
- Influence of salinity on survival, growth, plasma osmolality and gill Na–K–ATPase activity in the rabbitfish Siganus rivulatus. J. Exp. Mar. Biol. Ecol.. 2007;348(1-2):183-190.
- [Google Scholar]
- Sekino, M., Hara, M., Taniguchi, N., 2001. Genetic Diversity Within and Between Hatchery Strains of Japanese Flounder Paralichthys olivaceus Assessed by Means of Microsatellite and Mitochondrial DNA Sequencing Analysisδ. Ecology of Aquaculture Species And Enhancement of Stocks, 43.
- Analysis of mitochondrial DNA sequences from two Maurolicus taxa: evidence for separate species? J. Fish Biol.. 2000;57(6):1605-1609.
- [Google Scholar]
- DNA barcoding Australia’s fish species. Phil. Trans. R. Soc. B. 2005;360(1462):1847-1857.
- [Google Scholar]
- Broodstock management for imperiled and other fishes. In: Wedemeyer G.A., ed. Fish hatchery management (2nd ed.). Bethesda, Maryland: American Fisheries Society; 2001. p. :397-482.
- [Google Scholar]
- Zoogeography of the Siganidae (Pisces): an interpretation of distribution and richness patterns. Bull. Mar. Sci.. 1983;33:713-717.
- [Google Scholar]
- Geographic distance affects dispersal of the patchy distributed greater long-tailed hamster (Tscherskia triton) PloS One. 2014;9
- [Google Scholar]
- POPGENE version1. 32, Microsoft window-base software for population genetic analysis: a quick user’s guide. Alberta, Canada: University of Alberta. Center for International Forestry Research; 1999.
- Development of single nucleotide polymorphism markers for the wheat curl mite resistance gene cmc4. Crop Sci.. 2019;59(4):1567-1575.
- [Google Scholar]


