

Translate this page into:
Stock market prediction based on statistical data using machine learning algorithms
⁎Corresponding author at: Department of Basic Sciences Riyadh ELM University, Riyadh, P.O. Box 84891 - Riyadh 11681, Saudi Arabia. mohammed.akhtar@riyadh.edu.sa (Md. Mobin Akhtar),
-
Received: ,
Accepted: ,
This article was originally published by Elsevier and was migrated to Scientific Scholar after the change of Publisher.
Peer review under responsibility of King Saud University.
Abstract
The main perfect of this composition is to discover the stylish version to prognosticate the cost of the inventory request. During the procedure of analyzing the colorful ways and variables to remember, we plant that approaches similar as Random woodland, machine help Vector were not absolutely exploited. On this composition, we will introduce and assessment a in addition practicable gadget to prognosticate the motion of shares with lesser delicacy. The first issue we looked at turned into the previous time's stock price dataset. The dataset has been preprocessed and refined for actual analysis. For this reason, our composition can even focus on preprocessing the raw data of the dataset. 2nd, after preprocessing the facts, we are able to observe the use of the arbitrary wood, we can aid the vector machine on the dataset and the results it generates. Similarly, the proposed composition examines the use of the soothsaying device in actual surrounds and the problems related to the delicacy of the overall values handed. The composition additionally provides a system literacy version for prognosticating the lifestyles of shares in a aggressive request. Predicting the success of shares might be a main asset for stock request institutions and could give actual effects to the troubles facing equity investors. By Using Stock Prediction algorithm overall accuracy is 80.3%.
Keywords
Machine learning data pre-processing
Statistics
SVM

1 Introduction
The inventory request is principally an aggregation of colorful shoppers and merchandisers of shares one inventory (additionally recognized more generally as shares) represents typically the strength rights to the business through a selected man or woman or group of humans. The strive (Zhang et al., 2018) to determine the unborn value of the inventory request is referred to as a stock request cast. Soothsaying have to be robust, particular and powerful. The device need to function beneath real life scripts and ought to be well applicable to real global settings. To remember any variables which can have an effect on the value and performance of the security. There are exceptional styles and approaches to apply the soothsaying system, similar as abecedarian evaluation, specialized evaluation, gadget literacy, request belittlement, and structuring of time series elements. With the development of the virtual age, ratiocination has shifted to the area often technology most crucial and (Zhang et al., 2018) most promising fashion involves the usage of synthetic neural networks, intermittent neural networks, which might be essentially the perpetration of device literacy. Gadget literacy includes synthetic intelligence that lets in the machine to research and ameliorate from once gests without being programmed time and again. Conventional gadget mastering vaticination patterns use algorithms similar as backward propagation, additionally known as backward propagation crimes. Lately, several experimenters have used several studying methods together. Any other community could use staggered vertices to prognosticate unborn vertices. Those vaticinations had been used to shape stock prices. (Sharma et al., 2017) Predicting inventory fees for brief- term home windows looks as if a erratic procedure.
The movement of the inventory price over a protracted period of time typically develops an instantaneous wind. Human beings have a tendency to buy shares that are predicted to rise in rate in the near future. The question of the stock request prevents humans from investing in shares. Hence, it's vital to at once prognosticate the inventory request which can be utilized in a real script.
The styles used to prognosticate the inventory request include time series soothsaying in addition to logical ways, device literacy modeling, and variable inventory soothsaying. The records set of the inventory request soothsaying model consist of information just like the open rate of the near charge, information and colorful other variables demanded to prognosticate the item variable that's the charge on a given day. The former version used conventional soothsaying patterns similar as multivariate evaluation with a soothsaying time series version. From request statistics using device literacy techniques and assessing unborn styles of the bracket is achieved by using chancing the hyper plane that explicitly differentiates the 2 training (Inthachot et al., 2016). For the identical prophetic styles comparable because the arbitrary timber style is used. The Random wooded area set of rules follows a usual literacy approach for bracket and retrogression. Random woodland takes the normal of the one-of-a-kind subsamples of the dataset, which increases prophetic delicacy and decreases over fitting of the dataset.
2 Problem definition
Request vaticination is principally described as the try and determine the fee of the stock and offer a solid idea for humans to know and prognosticate the request and inventory fees. It is generally provided using the everyday economic file using the dataset, so counting on just one dataset won't be sufficient for soothsaying and may deliver a misguided result. Hence, we're considering the examiner of system literacy with the integration of colorful information sets to prognosticate the request and the trend of stocks. The hassle of estimating the stock rate will remain a hassle unless a higher stock request vaticination set of rules is proposed. Predicting the stock request is surprisingly delicate (Loke, 2017). The motion of the inventory request is generally driven through the sentiments of heaps of traders. Request vaticinations undergo the capability to prognosticate the impact of latest occasions on investors these occasions can be political events comparable as a declaration by a political chief, information about the fiddle, and so on. It can also be a transnational event like strong actions of currencies and items and so on. All of these occasions affect commercial earnings, which in turn affects investor sentiment. It's past the attain of almost any investor to rightly and continuously (Park et al., 2007) prognosticate those hyper parameters. All of these factors make it usually sensitive to prognosticate the inventory rate. As soon as the perfect facts is collected, it is able to be used to train a machine and result in a vaticination result.
3 Literature survey
Throughout a literature check, we gathered a number of the statistics on the inventory request soothsaying mechanisms currently in use. Specialized evaluation, but those styles don't always produce accurate consequences. It's consequently important to increase patterns for an extra particular vaticination. Normally, investments are made using vaticinations attained from the inventory rate after thinking about all the elements that could impact it.
The fashion that turned into employed in this situation was retrogression. Since financial brands set off massive quantities of statistics at any person time, a large extent of statistics needs (Hakob, 2016) to be anatomized earlier than you could make a forged. Every of the ways listed in the retrogression has its personal advantages and boundaries over othercounterparts. One of the amazing approaches that had been referred to become direct retrogression. The way direct retrogression fashions work is that they are often geared up the usage of the least location’s technique, however they can also be outfitted in other approaches, for illustration via reducing the“ lack of match “in a situation. Any other trendy, or with the aid of dwindling a handicap interpretation of the least places’ loss function. Again, the least locations technique may be used to suit nonlinear models.
3.1 Impact of economic ratios and technical analysis on Predicting inventory charge the use of Random
Timbers the use of device literacy and synthetic intelligence approaches to prognosticate inventory fees is a developing trend. in addition, and further experimenters are making an investment their time every day in chancing approaches to locate ways that may in addition ameliorate the delicacy of the stock vaticination model. Within the equal manner. The affair varies for each style certainly even though the same information set is applied. Inside the stated report, the stock charge vaticination became done the use of the arbitrary wood set of rules which is used to prognosticate the inventory fee the usage of the previous region's monetary reporting module. That is simply one way to approach the trouble by means of coming near it the usage of a prophetic (Bujari et al., 2017) version, the use of the arbitrary wooden to prognosticate the unborn fee of the stock from literal statistics. Nonetheless, there are usually different factors that affect the inventory charge, comparable as investor sentiment, public opinion about the corporation, information from colorful outlets, and certainly events that beget the inventory to trade. Whole inventory request. Through the usage of the fiscal record with a model capable of efficaciously assaying sentiment, the delicacy of the stock rate soothsaying version may be elevated. Source learning directly prognosticating the inventory request is a delicate project, but the ultramodern web has demonstrated to be a assuredly useful device in simplifying this venture. Due to the linked layout of the facts, it's clean. The connection between the extraordinary statistics factors is taken into consideration and a vaticination is made on these data points. The model changed into (Gupta et al., 2013) appropriate to make prognostications about unborn inventory values. Retrogression models are hamstrung at checking out out-of- sample pungency. The reason for this inefficiency changed into the insecurity of the parameters and the question of the version. Research have additionally plant conventional strategies that promise to break this hassle.
3.2 Analyzing stock cost direction using SVM
The stock request shows a sturdy connection among inventory costs and the inventory indicator. Predicting stock fee direction, the use of aid Vector Machines financial associations and sellers have created several precise models in an attempt to beat the request for themselves or their guests, but every now and additionally, a person has performed superior than ordinary situations of profitability. Nonetheless (SachinSampat, 2016), the venture of soothsaying pressure is so compelling in light of the reality that perfecting many charge targets can make a whole lot of plutocrats for these associations.
The problem of soothsaying time series has been studied in the work facilities of colorful economic establishments. The solid model, grounded on SVM and unbiased analysis, mixed referred to as marketplace Vaticinations the full-size maturity of inventory brokers have used the technical, abecedarian or time collection analysis machine while making their vaticinations. On the entire, those approaches weren't absolutely reliable, for this reason the want to give a strong strategy to the soothsaying of fiscal exchanges.
3.3 SVM market prediction
SVM classifier with a volition and a set of a list of features. Most of the device literacy approach to coping with commercial enterprise troubles (2) had its benefit over substantiation- grounded methods that barred AI, in spite of the reality that there was a great method for specific issues. Swarm Intelligence (2) optimization device called Ditz; the search changed into simpler to acclimate SVM parameters. The proposed mongrel CSSVM method has shown the performance to produce decreasingly specific outcomes unlike ANN. Likewise, the CSSVM display (2) done greater in prognosticating the inventory price cast. Price analysis statistics used to calculate vaticinations, shoot them to the stoner, and singly carry out obligations like buying and dealing shares the use of the theory of robotization.
4 Disadvantages of theexisting system
The being gadget fails while there are uncommon consequences or predictors, due to the fact the set of rules is grounded on bootstrap slice.
-
The former outcomes indicate that the stock price is changeable when the use of the traditional classifier (Aharon et al., 2010).
-
The actuality of the device stated in large part prophetic values, opting a relevant term for their enjoy with a purpose to benefit in large part prophetic rankings.
The being gadget does not serve properly whilst there is a exchange inside the running terrain.
-
It would not concentrate on outside occasions within the terrain, similar as modern-day occasions or social media. • operate a single fact The being gadget desires some form of interpretation of the inputs, so it desires to be gauged. • doesn't exploit statistics preprocessing methods to exclude statistics inconsistency and area (Inthachot et al., 2016).
5 Proposedsystem
On this proposed system, we focus on vaticination of stock request values the usage of gadget literacy algorithms comparable as Random Forest and aid Vector Machines. We proposed We used the pandas Python library for facts processing, which mixed more (https://www.cs.princeton.edu/sites/default/files/uploads/Saahil_magde.pdf) than one dataset into one data block. The optimized statistics frame allowed us to put together the information for factor start. The traits of the database had been the ending date and the charge for a given day. We used all of those functions to educate the device on arbitrary timber version and prognosticate the item variable, that's the fee for a given day.
6 Methodologies
In this Methodology we are using SVM and R Forest Classifier for accuracy of Prediction because this algorithm is easy to handle different kinds, various types of attributes.
6.1 Classification
Bracket is a case of supervised literacy wherein a hard and fast is anatomized and categorized consistent with a commonplace trait. From the values or data surpassed, the bracket draws some conclusions approximately the observed value (Ali Khan, 2016). But the bracket will essay to prognosticate one or similarly troubles for the equal, If further than one entry is handed. Some classifiers used then for inventory vaticination consist of Random wooded area Classifier.
6.2 R – forest classifier
It creates a fixed of choice timber, which produces an end result. Votes from the arbitrary subset of selection timber of choice trees and other hyperactive parameters comparable as the rating to determine the perfection of the arbitrary wood concept, max_features which incorporates the variety of capabilities (Venkatesh and Tyagi, 2011).
6.3 SVM classifier
The SVM Classifier is a kind of differencing classifier. SVM makes use of supervised literacy, which is categorized education facts. The affair are hyper planes that classify the new data set. They may be supervised literacy fashions that use the related literacy set of rules for bracket and retrogression. The parameters of the SVM classifier.
7 Systemarchitecture
Kaggle is a web information analysis and prophetic modeling community. It also carries datasets of different fields, surpassed through records miners. colorful facts scientists contend to provide the stylish fashions for prognosticating and representing statistics. It permits druggies to apply their datasets to make models and paintings with colorful records wisdom masterminds to interrupt colorful (Hakob, 2016) real statistics wisdom demanding situations. The dataset used inside the proposed design turned into downloaded from Kaggle. We are using Kaggle Dataset Because of his size and security we can share either public or private based on necessity.
Nevertheless, this dataset is present in what we name the raw layout. The dataset is a collection of stock request data about certain companies. Step one is to transform these uncooked records into reused data. This is achieved the use of point beginning, as there are multiple attributes inside the raw statistics collected, but only a few of these attributes are useful for vaticination purposes. The first step is as a result the delivery of characteristics, in which the important attributes are uprooted from the complete listing of attributes (RautSushrut et al.,) to be had within the raw dataset. Point birth starts from an authentic state of the measured facts and creates deduced values or capabilities (Venkatesh and Tyagi, 2011) those functionalities are intended to be academic and no longer spare, easing the after degrees of literacy and thought. factor beginning is a system of dimensionality discount, in which the original set of raw variables are reduced to gradationally affordable traits for ease of operation, while at once and absolutely representing the primary series of records. The factor birth technique is followed by way of a bracket (Ali Khan, 2016).
The schooling statistics set is used to train the version at the same time as the check information is used to prognosticate the delicacy of the version. The division is done in order that the schooling information keeps a bigger proportion than the test facts (Nair and Mohandas, 2015). The Random Forest algorithm uses a set of arbitrary choice timber to dissect the data. Virtually positioned, from the overall variety of choice trees within the wooden, a collection of choice timber by means of assaying its literal facts (Fig. 1). We are using R Forest algorithm in the place of Summarization result. Result is based on keywords and test Summarization Comparison.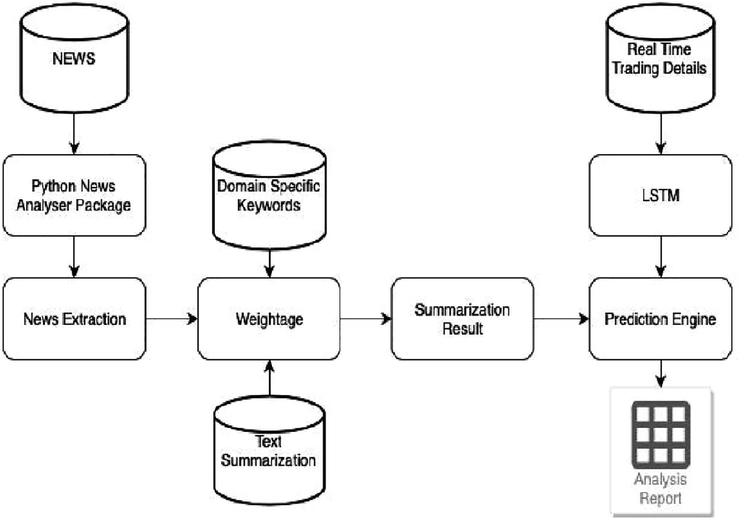
System architecture.
8 Moduleidentification
8.1 Data collection
An assuredly easy shape and the first step closer to the project. Commonly it is about gathering the proper set of information. The dataset it is for use in the request cast have to (Gupta et al., 2013) be was once filtered grounded on colorful components. Information collection also complements to ameliorate the dataset with the aid of including in addition outside records. The Maximum data size per data set is 100 GB while we using Kaggle dataset and sampling Techniques we are using are SVM, Forest Algorithm, LSTM.
8.2 Pre-processing
Our records are composed considerably of stock fees from the former time. First, we will dissect the Kaggle dataset, and relying at the perfection, we're going to use the model along with the records to at once dissect the prognostications. Entails transubstantiating the uncooked statistics into a further harmonious (Bujari et al., 2017) layout. Raw records is generally inconsistent or poor and normally carries numerous crimes. Facts preprocessing includes checking for missing values, chancing specific values, dividing the information set into schooling units and test sets, and in the end spanning the functions to restrict the variety of variables so they can be brazened on common environments.
8.3 Training the machine
Device pressure system pressure is similar to passing statistics to the set of rules to first-class tune the test records. Schooling units are used to upgrade and acclimatize models. Take a look at units aren't changed due to the fact a model should not be judged on unnoticeable statistics. Model training includes cross-validation wherein we get a nicely- innovated approximate overall performance of the version (Venkatesh and Tyagi, 2011) the usage of the schooling data. Hyper parameters comparable because the wide variety of trees in a arbitrary wooden. We run the entire cross-validation cycle on each set of hyperparameter values. Sooner or later, we can calculate throughout-tested rating for person sets of hyper parameters. Next, let's choose the stylish hyper parameters. Hence, it is divided in the ratio of 75:25 where 75% is for the training set and the rest 25% for a testing set of the data.
9 Experimental results
The xlxs file consists of the uncooked records based totally mostly on which we're going to put up our findings (Zhou and Keith). There are eleven columns or eleven attributes that describe the rise and fall in inventory fees. A number of these attributes are (1) HIGH (2) LOW (3) OPENP (4) CLOSE P (5) YCP (6) TRADE (7) VOLUME (8) DATA, other attributes are not important. Which describes the satisfactory value the stock had in previous 12 months. We are using 75 Percentage of dataset for training and usage. This is to show (Fig. 2) the trend of closing price of stock as time varies over a span of two years. The figure provided below is the candle stick plot, which was generated using the library. Table 1 shows the Sample data of janatamf.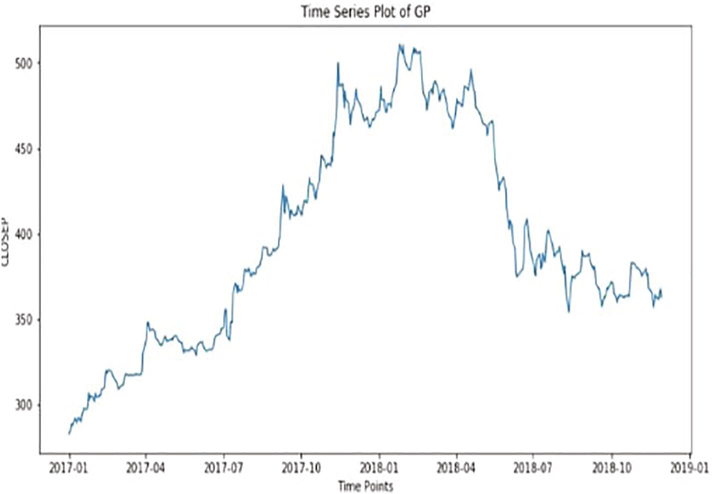
Time series Vs price prediction.
Date
TRADING CODE
LTP
HIGH
LOW
OPENP
CLOSEP
YCP
TRADE
VALUES
VOLUME
28–12-2017
1JANATAMF
6.4
6.5
6.4
6.4
6.4
6.5
79
1.8
24,347
27–12-2017
1JANATAMF
6.5
6.5
6.4
6.5
6.5
6.5
78
2.4
64,543
26–12-2017
1JANATAMF
6.5
6.6
6.4
6.5
6.5
6.6
43
3.2
34,347
24–12-2017
1JANATAMF
6.6
6.6
6.4
6.5
6.5
6.6
56
1.04
76,821
21–12-2017
1JANATAMF
6.6
6.6
6.4
6.4
6.5
6.6
98
5.6
54,686
20–12-2017
1JANATAMF
6.4
6.5
6.4
6.4
6.4
6.5
208
2.1
12,389
19–12-2017
1JANATAMF
6.4
6.6
6.4
6.5
6.4
6.6
43
9.8
56,329
18–12-2017
1JANATAMF
6.4
6.5
6.4
6.4
6.5
6.5
67
3.7
56,923
17–12-2017
1JANATAMF
6.5
6.5
6.4
6.5
6.4
6.5
34
4.2
34,901
14–12-2017
1JANATAMF
6.5
6.6
6.5
6.6
6.6
6.6
54
6.8
37,893
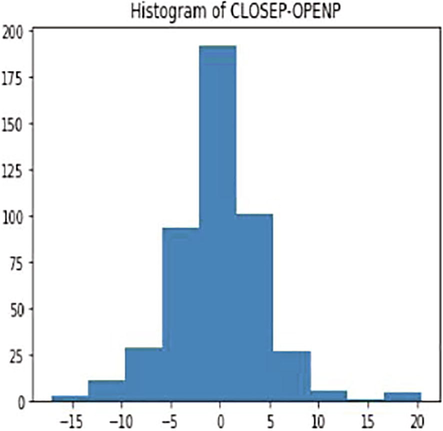
The above (Table 2 and Fig. 3) are histograms plotted between „CLOSEP‟ and „OPENP‟ and the attributes „OPEN‟ define the Open value of that day and attribute” CLOSEP” closing value of the stock that day. It is a pictorial instance of the facts observed in our xlxs file. This particular document carries 121,608 such records. Greater diffused dataset that could now be used to teach the tool Figs. 4 and 5.
Parameters
NO.OF. Epochs
Training RMSE
Testing RMSE
Open/Close
300
0.01521
0.01432
Open/Close
600
0.01110
0.00967
High/Low/Close
350
0.01478
0.0123
High/Low/Close
600
0.01098
0.01078
High/Low/Open/Close
350
0.0121
0.01245
High/Low/Open/Close
600
0.00896
0.00786
Histogram of closed loop.
PredictedVS actual stock price.
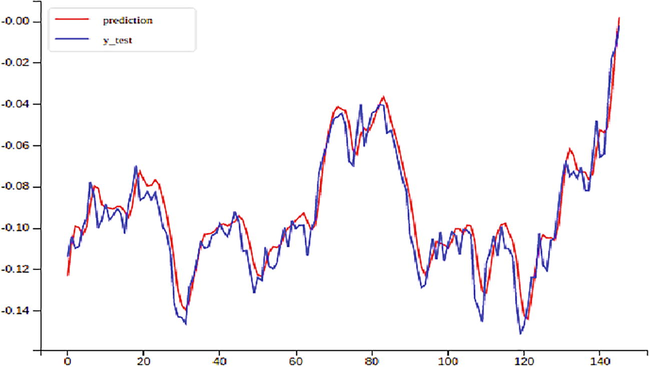
PredictedVS actual stock price.
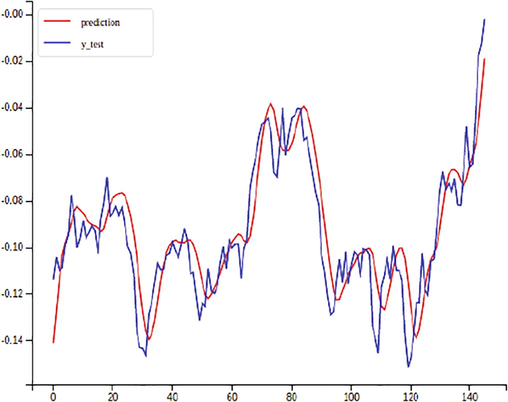
TFLANN- Fast Library for Approximate Nearest Neighbors this are library functions used for calculation. FLANN and CFLANN models (Table 3) were trained with Back Propagation and Jaya successfully (Fig. 6). A remarkable difference was observed in the values of MSE in Jaya as compared to BP. It almost got reduced by 90%.
Stock data
Flann model
Prediction
MSE (train)
MAPE In % (train)
MSE (test)
MAPE In % (test)
BSE500
TFLANN
1-day
0.7277
1.956
0.036
1.642
1-week
0.8524
6.77
0.045
4.9
CFLANN
1-day
0.2885
1.02
0.006
0.415
1-week
0.2925
1.75
0.39
0.424
DJIA
TFLANN
1-day
0.579
5.06
0.11
1.71
1-week
0.9824
4.27
0.486
2.7
1-day
0.2433
2.35
0.0143
1.09
NASDAQ
TFLANN
1-week
0.2484
2.09
0.115
1.31
1-day
0.6171
9.33
0.025
3.15
CFLANN
1-week
0.8326
11.13
0.082
3.96
1-day
0.2737
3.37
0.047
1.78
1-week
0.2778
6.9
0.061
2.59
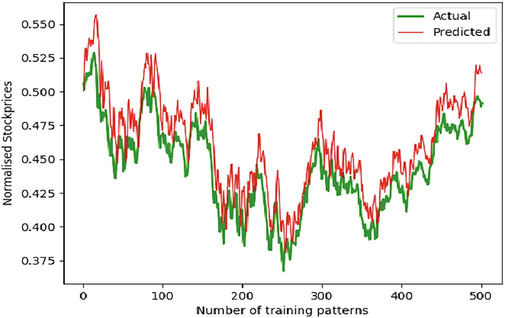
Training Data Set VS Actual Stock Price.
10 Conclusion
By way of measuring the precision of the notable algorithms, we observed that the maximum appropriate algorithm for predicting the market charge of a inventory primarily based on numerous elements of recording antique facts is the random wooded area algorithm. The set of rules may be a remarkable aid for (Fama, 1995) agents and traders to make investments inside the stock market as it is aware of a extensive variety of historical data and became selected after being tested on a statistical pattern. To sum it up, the accuracy of the SVM Model in Test Set is 78.7% whereas the accuracy score of the random forest classifier is calculated to 80.8%. The challenge demonstrates the device learning model to are expecting inventory charge greater correctly than formerly carried out machine learning fashions.
11 Future enhancement
The fate of this business will involve adding extra parameters and objects like financial ratios, more than one times and so on. Be applied to investigate the content material of public comments and, consequently, determine on the relations among the client and the employee of the business enterprise. The usage of conventional algorithms and facts mining techniques also can assist expect employer overall performance.
Declaration of Competing Interest
The authors declare that they have no known competing financial interests or personal relationships that could have appeared to influence the work reported in this paper.
References
- Aharon, D.Y.; Gavious, I.; Yosef, R. Stock market bubble effects on mergers and acquisitions. Q. Rev. Econ. Financ. 2010, 50, 456–470. [CrossRef].
- Predicting Trend in Stock Market Exchange Using Machine Learning Classifiers. Sci. Int.. 2016;28:1363-1367.
- [Google Scholar]
- Bujari, A.; Furini, M.; Laina, N. On using cashtags to predict companies stock trends. In Proceedings of the 2017 14th IEEE Annual Consumer Communications & Networking Conference (CCNC), Las Vegas, NV, USA, 8–11 January 2017; pp. 25–28.
- Gupta, R.; Garg, N.; Singh, S. Stock Market Prediction Accuracy Analysis Using Kappa Measure. In Proceedings of the 2013 International Conference on Communication Systems and Network Technologies, Gwalior, India, 6–8 April 2013; pp. 635–639.
- Hakob GRIGORYAN, “A Stock Market Prediction Method Based on Support Vector Machines (SVM) and Independent Component Analysis (ICA)”, DSJ 2016.
- Artificial neural network and genetic algorithm hybrid intelligence for predicting thai stock price index trend. Comput. Intell. Neurosci.. 2016;2016:1-8.
- [Google Scholar]
- Loke.K.S. Impact Of Financial Ratios And Technical Analysis On Stock Price Prediction Using Random Forests IEEE 2017.
- Nair, B.B.; Mohandas, V. An intelligent recommender system for stock trading. Intell. Decis. Technol. 2015, 9, 243–269. [CrossRef].
- Park, C.-H.; Irwin, S.H. What Do We Know about the Profitability of Technical Analysis? J. Econ. Surv. 2007, 21, 786–826. [CrossRef].
- RautSushrut Deepak, ShindeIshaUday, Dr. D. Malathi, “Machine Learning Approach In StockMarket.
- SachinSampatPatil, Prof. KailashPatidar, Asst. Prof. Megha Jain, “A Survey on Stock Market Prediction Using SVM”, IJCTET2016.
- Ashish Sharma, Dinesh Bhuriya, Upendra Singh. “Survey of Stock Market Prediction Using Machine Learning Approach”, ICECA 2017.
- Fundamental analysis as a method of share valuation in comparison with technical analysis. Bangladesh Res. Publ. J.. 2011;1:167-174.
- [Google Scholar]
- Xi Zhang, Siyu Qu, Jieyun Huang, Binxing Fang, Philip Yu, “Stock Market Prediction via Multi-Source Multiple Instance Learning.” IEEE2018.
- Pei-Yuan Zhou , Keith C.C. Chan, Member, IEEE, and Carol XiaojuanOu, “Corporate Communication Network and Stock Price Movements: Insights From Data Mining”, IEEE.


