

Translate this page into:
Impact of water salinity levels on the spectral behavior and yield of tomatoes in hydroponics
⁎Corresponding author. rmadugundu@ksu.edu.sa (Rangaswamy Madugundu)
-
Received: ,
Accepted: ,
This article was originally published by Elsevier and was migrated to Scientific Scholar after the change of Publisher.
Peer review under responsibility of King Saud University.
Abstract
In Saudi Arabia, irrigation water is mainly obtained from aquifers and is mostly characterized by moderate to high levels of salinity. Hence, detailed information on crop response to salinity is of great importance in order to optimize irrigation and fertilizer management. Therefore, this study was conducted to evaluate the effect of salinity and grafting on the spectral behavior and yield of three tomato (Solanum lycopersicum) cultivars (Valouro-RZ, Ghandowra-F1 and Feisty-Red) grown in a hydroponic glass greenhouse. Three salinity levels (2.5, 6.0 and 9.5 dS m−1) were used in this study. For the three tomato cultivars, the increase in salinity level was associated with an increase in the spectral reflectance in the Visible, Red-Edge and NIR regions of the electromagnetic spectrum. However, Valouro-RZ and Feisty-Red cultivars showed no significant differences in the spectral reflectance in the Visible range between salinity1 (2.5 dS m−1) and salinity2 (6.0 dS m−1). Slight reduction, but not significant, in the total fruit yield was recorded under salinity2 compared to salinity1 (2.5 dS m−1) for Valouro-RZ (6.76%) and Feisty-Red (6.79%). For salinity3 (9.5 dS m−1), significant reductions in total fruit yield were recorded compared to salinity1 (Valouro-RZ: 31.77%, Feisty-Red: 33.53%). Ghandowra-F1 cultivar was found to be the most salt tolerant among the studied tomato cultivars, where a significant reduction was observed in the total fruit yield only when the salinity increased from 2.5 to 6.0 dS m−1 (10.85%) and 9.5 dS m−1 (30.63%). Grafting on Maxifort rootstock showed neither a significant effect on the spectral response nor a significant yield improvement; hence, no positive change in salinity tolerance, due to grafting, of the studied tomato cultivars. Therefore, further research on rootstock and fruit variant combinations for the feasibility of grafting for salinity tolerance is necessary. The results of this study indicated that the Valouro-RZ and Feisty-Red tomato cultivars could be grown successfully under a hydroponic system using irrigation water of up to 6.0 dS m−1 salt concentration without sacrificing the total fruit yield while taste may improve.
Keywords
Hydroponics
Electromagnetic spectrum
Spectral reflectance
Salinity
Grafting

1 Introduction
The Kingdom of Saudi Arabia (KSA) is located in a very harsh natural desert environment without rivers or lakes with an average annual rainfall of <100 mm, which results in a severe water shortage in the country (Ouda, 2013). The rapid development in the KSA during the last two decades, in addition to the high living standards of the population, have led to drastic changes in the water needs of irrigated agriculture, which consumed about 88 % of the available water (Gabr et al., 2020). However, the high rate of depletion of aquifers has forced the KSA to phase out the production of water-intensive crops, and strongly encourage crop production under controlled environment (e.g. greenhouse farming). Other effective strategies, to face the scarcity of good quality water, include all agricultural practices to make use of available resources, such as using saline water to irrigate crops (Alomran et al., 2012).
Controlled environment agriculture is considered as being one of the most efficient forms of agricultural enterprises. This is due to the fact that this form of agriculture is highly productive, conserves water and soils and protects the environment. Other potential advantages of environmentally controlled agriculture include providing of a clean source of food, greatly reducing the pest and drought problems and minimizing the cost related to transportation and fossil fuels (Benke and Tomkins, 2017). Hydroponics, aeroponics and aquaponics are among the popular types of soilless culture growing methods used in controlled environment agriculture. Hydroponic production technologies in greenhouses ensure increased food production, improved quality, conserved resources and preserved environment. As reported by the World Bank (2017), hydroponics is a climate-smart technology that is highly efficient at producing more food with at least 80 % less water compared to open agriculture. Also, Biggs and Giles (2013) reported that hydroponics increased crop yields by 38 % in cabbage and up to 3000 % in tomato. As a result of this large increase in production, hydroponics could increase fuel efficiency by more than 100 %. While, comparisons under controlled greenhouse conditions indicated that yield of tomatoes increased from 15 to 20 lb yr−1 plant−1 in soil culture to 50–70 lb yr−1 plant−1 in soilless culture, i.e. an increase of about 250 % (Resh, 2013).
In soilless (hydroponics) systems, where root zone salinity can be better managed by controlling nutrient solution composition and watering frequency, tomatoes can tolerate total salt concentrations of up to 2.5–2.9 dS m−1 without yield losses (Passam et al., 2007). However, Chookhampaeng et al. (2007) reported a decrease in tomato yield when plants were grown with a nutrient solution of 2.5 dS m−1 or higher; where, at salinity levels of above 3 dS m−1, an increase of 1 dS m−1 in salinity resulted in a decrease in yield of up to 10 %. Previous investigations have shown that the tomato plant is moderately sensitive to salinity, with significant differences between different cultivars (Singh et al., 2011; Ladewig et al., 2021). Oztekin and Tuzel (2011) reported that tomato plant moderately tolerated salinity stress, which caused several types of damage, suchrowth inhibition, metabolic disturbance, loss of quality and reduced yield (a 50 % yield reduction was recorded at an electrical conductivity of 7.6 dS m−1).
The development of field, airborne and satellite sensors over the past 30 years has greatly encouraged the remote sensing community to come up with methods and techniques that could efficiently be utilized to monitoring the growth and health of vegetation (Ustin and Jacquemoud, 2020). Plant leaf spectroscopy is influenced by several factors, including a diverse set of stress factors (leaf age, phenology, salinity and nutrients levels, etc.); hence, it is usually used to detect the hard-to-see nutritional plant deficiencies in order to improve the nutritional management of these plants (Suarez et al., 2015). On the other hand, the use of spectral data, provided by some hyper-spectrometers in the visible and near-infrared ranges, has significantly contributed in detecting early changes in plant physiology due to biotic and abiotic stresses (Abdulridha et al., 2018). Sankaran et al. (2010) also reported that spectral reflectance data was useful for detecting several types of biotic and abiotic plant stresses by measuring the changes in the degree of light absorption in the VIS and NIR bands of the electromagnetic spectrum. Similarly, Ustin and Jacquemoud (2020) reported that the light reflection from plant leaves and transmission through them were determined by the wavelengths of light absorbed by different biochemical compounds in leaves, such as water, chlorophyll, carotenoids, proteins, cellulose and lignin. The amount of radiation reflected by plants at a particular wavelength depends mainly on the color, thickness and structure (cell structure) of the leaves, as well as, the amount of water in the leaf tissue (Tempfli et al., 2009). The spectral signature of a healthy green plants is characterized by a reflectance peak in the visible range (VIS, 400–750 nm), a plateau in the near-infrared (NIR, 750–1300 nm), and two observed peaks in the short-wave infrared (SWIR, 1300–2500 nm); where leaf pigment, water contents and anatomy are the main factors involved (Jacquemoud and Ustin, 2001). Healthy plants absorb more light in the visible part of the electromagnetic spectrum; and therefore, less reflectance, while reflecting more light in the near-infrared part of the spectrum than stressed plants (McVeagh et al., 2012). Suarez et al. (2015) reported that healthy plants with more chlorophyll content absorbed more red (620–700 nm) and blue (400–500 nm) from the visible light spectrum and reflected more infrared light than unhealthy ones. On the other hand, Roman and Ursu (2016) reported that healthy leaves absorbed 70–90 % of visible radiation, mainly in the blue and red wavelengths, and reflected most of the green light to make the healthy plant leaf appear green to the human eye. However, most wavelengths in the NIR region are reflected or transmitted through the leaves; where, healthy leaves reflect 40–60 % of the NIR light.
Electromagnetic spectrum includes a wide range of wavebands of different wavelengths, of which, the three most important spectral regimes for vegetation studies are the visible, near infrared (NIR) and shortwave infrared (SWIR). Based on previous research results, understanding the electromagnetic spectral behavior of plants is very important in analyzing their responses to different stress sources. The purpose of this study was to understand the effects of salt stress on the biophysical variables of tomato plants and to address the ability of hyperspectral measurements to predict plant stress caused by salinity. Therefore, the main goal of this study was to investigate the effect of water salinity levels and grafting on the performance of selected tomato cultivars, grown under a hydroponic system, through the variability in their spectral responses and total fruit yield.
2 Materials and methods
2.1 Experimental details
Experiments on the effects of saline water on the performance of three tomato cultivars (Valouro-RZ, Ghandowra-F1, and Feisty-Red) were carried out in a controlled 32 m × 28 m glass hydroponic greenhouse (Fig. 1). The greenhouse, located at the Educational Farm of the College of Food and Agriculture Sciences at King Saud University, is equipped with an environmental control and a semi-closed hydroponic irrigation system. Perlite bags (100 cm × 25 cm × 20 cm) were used as a growing medium. Tomato seedlings and grafts, where Maxifort variety was used as rootstock, were transplanted into the perlite that was soaked with a nutrient solution.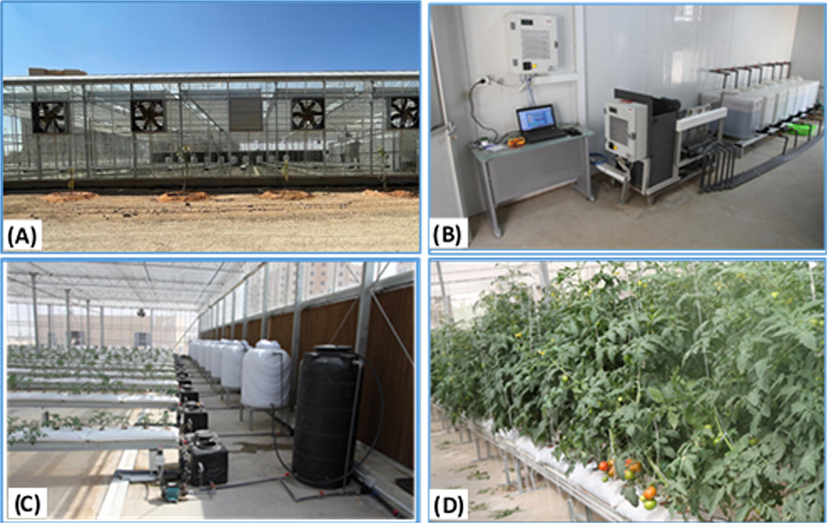
The study greenhouse of 12 experimental lines with separate automatic setting for Irrigation frequencies and nutrients with possibilities for recycling: (A) a side view of the glasshouse, (B) the hydroponic system control unit, (C) the troughs and hydroponic irrigation system, and (D) the studied tomatoes.
The Valouro -RZ, a beefsteak tomato with round shaped variety obtained from Rijk Zwaan Seeds, has resistance to multiple diseases and pests. Ghandowra F1 (Enza Zaden) has a high fruit setting capacity under high temperatures and a good resistance to tomato mosaic virus along with other pests and diseases. Feisty-red variety has a strong balanced vigor with medium internode length and fair fruit cover with high potential and consistent yield; as well as a resistance to tomato mosaic virus (TYLCV, ToMV), leaf mold, fusarium and verticillium wilt. Maxifort, an interspecific hybrid tomato root-stock (Solanum lycopersicum × Solanum habrochaites), is widely used and demonstrated as one of the best salt-tolerant rootstocks (Koleska et al., 2018; Asins et al., 2015) with multiple resistances including corky root, Verticillium Spp., Fusarium spp. and nematodes (Pico et al., 2017). Self-rooted and grafted tomato seedlings were placed in the perlite bags 25 cm apart in the row and 1.78 cm between rows. A climate control and hydroponic systems (MACQU, Geosmart, Athens, Greece) was installed to implement the planned treatments.
The study was conducted during the period from November 2021 to February 2022, where seedlings of three studied tomato cultivars (grafted and non-grafted) were transplanted 60 days after sowing using a semi-closed hydroponic system on November 24th, 2021. The experimental layout was a split-split plot design with three replications. The three salinity treatments (Salinity1: 2.5 dS m−1, Salinity2: 6.0 dS m−1, and Salinity3: 9.5 dS m−1) were distributed as sub-treatments, where different salinity levels were reached by adding different amounts of sodium chloride (NaCl) to the irrigation water. Nutrient solutions were supplied at different crop growth stages as recommended by Hochmuth and Hochmuth (2018). Fertilizer solution was irrigated providing macronutrients in ppm (N 100 ± 20; P 50; K 150 ± 30, Ca 150, Mg 40 ± 5, S 50 ± 5) and micronutrients Fe – 2.8; Cu −0.2, Mn −0.8, Zn-0.3, B-0.7, and Mo-0.05 ppm).
Plants were supplied with nutrient solutions through a drip-fertigation system, which was designed to deliver 100 (initial growth stage) to 1600 (late growth stage) ml day−1 of nutrient solutions per plant using one dripper for each plant at a flow rate of three liters per hour. Automatic irrigation was scheduled based on the measured incoming radiation. The irrigation frequency was determined based on the crop growth stage, plant transpiration demands and solar radiation. Drainage water was properly disposed of through a gutter system placed along each row. Air temperatures were set at threshold values of 24 °C and 18 °C to activate the temperature control system during the days and nights, respectively. Necessary maintenance of greenhouse plants, including leaf pruning and removal of side shoots, was performed at weekly intervals.
2.2 Data collection and statistical analysis
Spectral reflectance data of tomato plants was collected under controlled laboratory conditions using the FieldSpec® 3 spectroradiometer (Analytical Spectral Devices Inc., USA), with a wavelength range of 350 to 2500 nm, in the direct contact probe mode. Spectral observations were collected four times at 15-day intervals, namely: at 20, 35, 50, and 65 days after transplanting (DAT). Spectral reflectance was collected from three young, fully open leaves that were randomly selected in each of the three replicates. Spectral observations, however, were collected by placing the contact probe on the plant leaf. The three collected spectra were averaged to produce a single spectral reflectance for each replicate. The collected spectral observations were grouped into four main distinctive wavelength ranges: (i) visible (400 to 700 nm), (ii) near-infrared (NIR: 700 to 1300 nm), (iii) shortwave infrared 1 (SWIR-1: 1300 to 1900 nm) and (iv) shortwave infrared 2 (SWIR-2: 1900 to 2500 nm), in addition to the Red-Edge component.
Every-seven days, the tomato fruits, that have reached at least 80 % of their red ripeness stage, were harvested. For each tomato cultivar (non-grated and grafted) and at the three salinity levels, the total yield (kg m−2) was determined as the cumulative weight of all fruits harvested during the entire period per unit area.
Statistical analysis was performed, using ANOVA (analysis of variance) statistical tool within the Statistical Analysis System (SAS for Windows v. 9.4, SAS Institute Inc.), for the collected spectral and yield data to examine the effects of salinity levels and grafting on the performance of tomato crop cultivars. Differences between means were tested using the least significant difference test at the 5 % level (LSD0.05).
3 Results and discussions
Responses of tomato cultivars cultivated under a hydroponic system to different salinity levels were studied through their spectral behavior at different crop ages. In general, the results of this study showed different responses of the three studied tomato cultivars to the three salinity treatments (Fig. 2).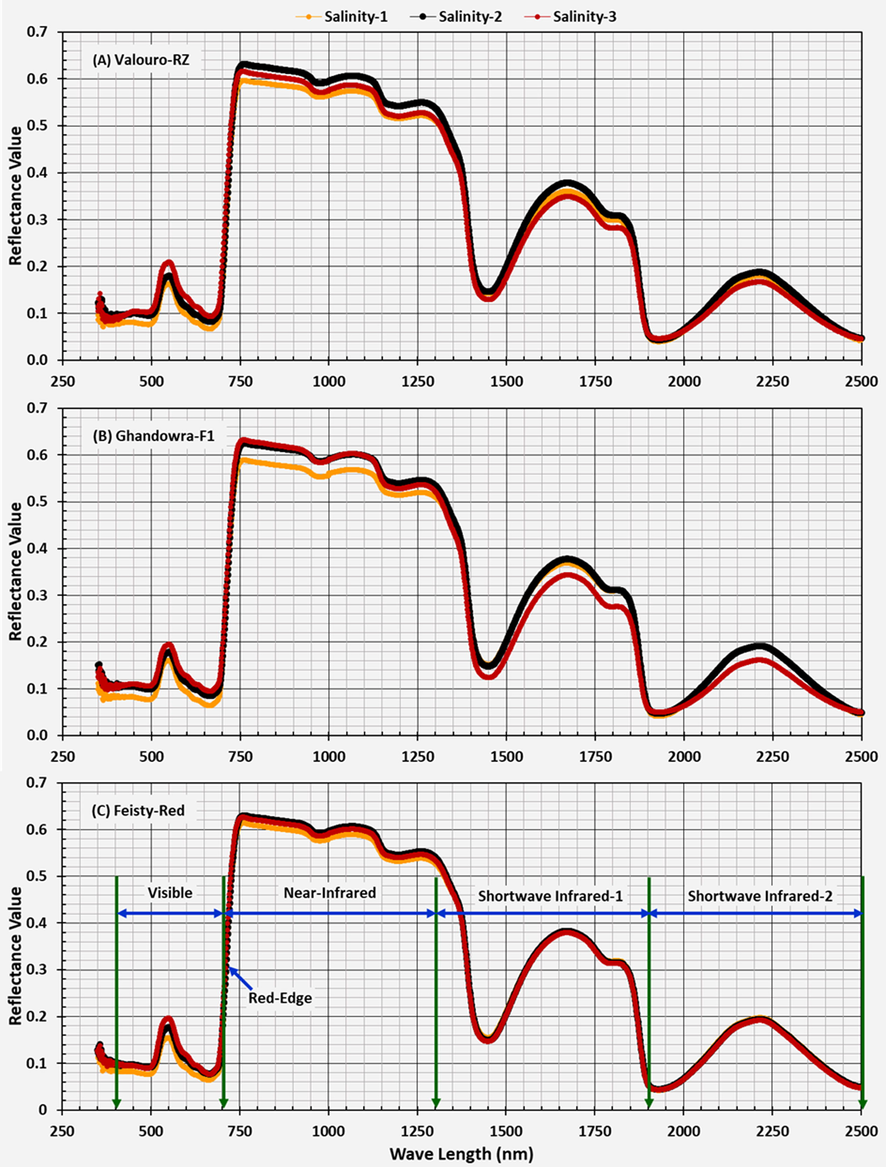
Spectral behavior of the three studied tomato cultivars at a crop age of 65 (days after transplantation-DAT) and under three water salinity levels.
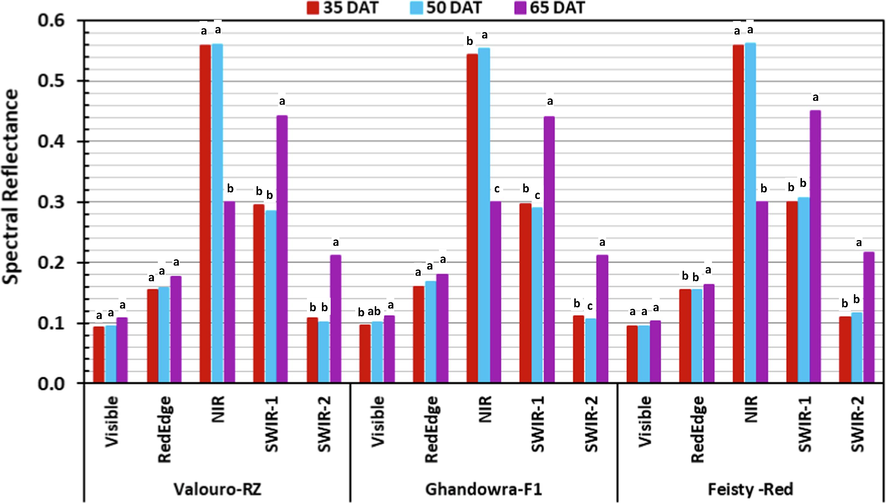
To investigate the impact of water salinity levels on the spectral response of tomato cultivars, the spectral behavior of plant leaves was then studied in more details in each range of the spectrum. As effective indicators of plant health, spectral reflectance values were collected at different crop ages (35, 50 and 65 DAT) and studied across the major ranges of the spectrum. The average spectral reflectance values in the major ranges of the spectrum (Visible, Red-Edge, Near-Infra-Red: NIR; Short-Wave-Infra-Red1: SWIR-1; Short-Wave-Infra-Red2: SWIR-2), as influenced by salinity levels, grafting and crop age (DAT) are shown in Figs. 3–5 for the Valouro-RZ, Ghandowra-F1 and Feisty-Red tomato cultivars, respectively. The statistical results; however, are summarized in Tables 1–3. Grg = Grafting, DAT = Days After Transplanting, Sal = salinity, CV = Coefficient of Variation, RMSE = Root Mean Square Error, LSD = Least Significant Difference. Grg = Grafting, DAT = Days After Transplanting, Sal = salinity, CV = Coefficient of Variation, RMSE = Root Mean Square Error, LSD = Least Significant Difference. Grg = Grafting, DAT = Days After Transplanting, Sal = salinity, CV = Coefficient of Variation, RMSE = Root Mean Square Error, LSD = Least Significant Difference.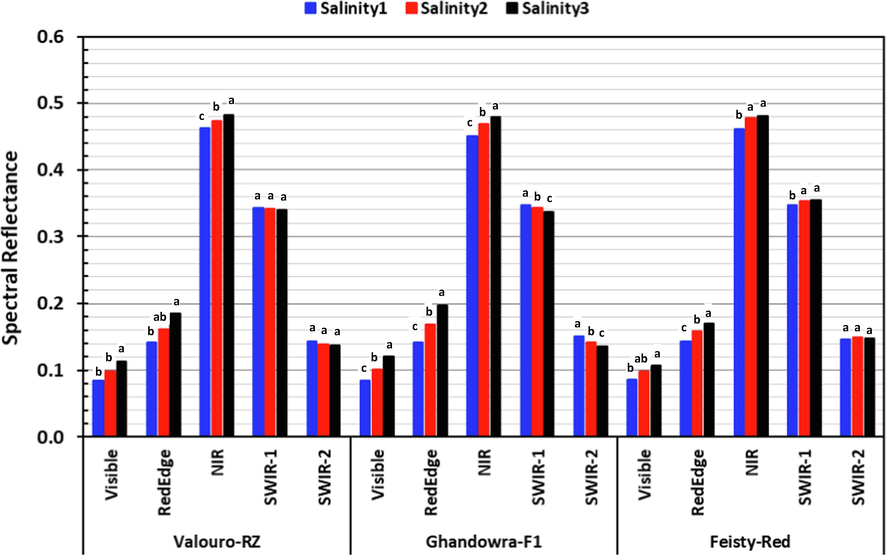
Spectral reflectance in the major ranges of the spectrum for the three studied tomato cultivars under three salinity levels.
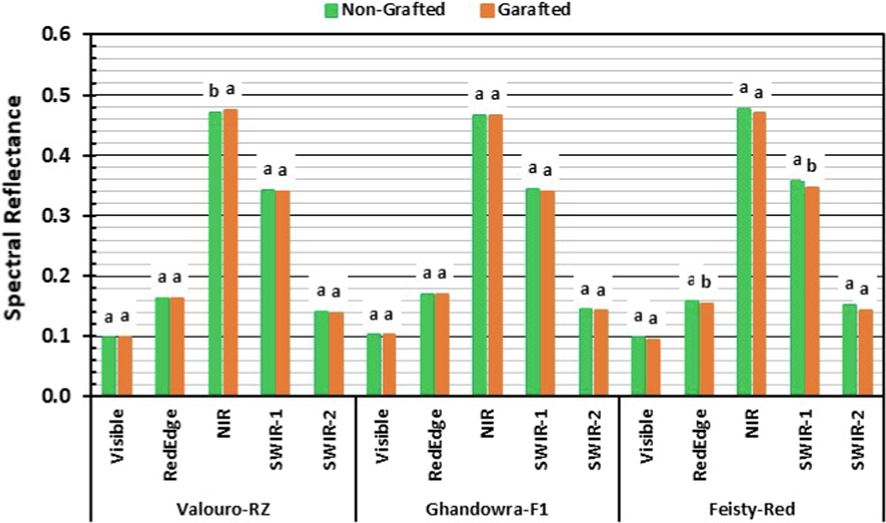
Spectral response of the three studied tomato cultivars to grafting.
Spectral response of the three studied tomato cultivars as a function of crop age.
Source
Blue
Green
Red
Visible
Red-Edge
NIR
SWIR-1
SWIR-2
Pr > F
Grg
0.3252
0.0996
0.5427
0.4089
0.9268
0.3244
0.7407
0.8224
DAT
<0.0001
0.0013
<0.0001
<0.0001
<0.0001
<0.0001
<0.0001
<0.0001
Grg*DAT
0.0036
0.0844
0.0050
0.0159
0.0019
0.3375
0.0710
0.1491
Sal
<0.0001
<0.0001
<0.0001
<0.0001
<0.0001
<0.0001
0.1239
0.0633
Grg*Sal
0.0344
0.8975
0.6799
0.7188
0.6283
0.2821
0.5579
0.5582
DAT*Sal
0.0003
0.0004
<0.0001
0.0001
0.0003
0.0004
0.0003
0.0340
Grg*DAT*Sal
0.0170
0.5916
0.2423
0.3382
0.0897
0.2604
0.0012
0.1768
R-Square
0.90
0.86
0.89
0.88
0.88
0.99
0.99
0.98
CV
6.49
9.04
8.49
7.72
7.22
2.62
3.30
7.14
RMSE
0.0053
0.0118
0.0072
0.0076
0.0118
0.0129
0.0107
0.0092
LSD0.05
0.0068
0.0233
0.0150
0.0149
0.0241
0.0032
0.0124
0.0094
Source
Blue
Green
Red
Visible
Red-Edge
NIR
SWIR-1
SWIR-2
Pr > F
Grg
0.7685
0.6204
0.9473
0.8237
0.9867
0.5896
0.1691
0.2107
DAT
<0.0001
0.0736
0.0014
0.0008
0.0048
<0.0001
<0.0001
<0.0001
Grg*DAT
0.4007
0.7938
0.8803
0.8588
0.9718
0.3236
0.8276
0.8236
Sal
<0.0001
<0.0001
<0.0001
<0.0001
<0.0001
<0.0001
0.1051
0.0003
Grg*Sal
0.1214
0.4837
0.2964
0.3130
0.3570
0.4180
0.2059
0.1807
DAT*Sal
0.0001
0.0081
0.0037
0.0031
0.0042
0.0373
0.0084
0.0196
Grg*DAT*Sal
0.1983
0.3753
0.5100
0.4329
0.2985
0.2193
0.0526
0.4016
R-Square
0.90
0.81
0.83
0.84
0.82
0.99
0.99
0.99
CV
6.70
11.82
11.90
10.01
9.90
2.18
3.30
6.50
RMSE
0.0057
0.0156
0.0102
0.0101
0.0166
0.0106
0.0108
0.0086
LSD0.05
0.0028
0.0164
0.0117
0.0102
0.0205
0.0059
0.0035
0.0031
Source
Blue
Green
Red
Visible
Red-Edge
NIR
SWIR-1
SWIR-2
Pr > F
Grg
0.7329
0.5909
0.0522
0.1236
0.0815
0.2180
0.1666
0.1813
DAT
<0.0001
<0.0001
<0.0001
0.1035
<0.0001
0.0166
0.0050
<0.0001
Grg*DAT
0.1370
0.1697
0.2874
0.8030
0.3504
0.6863
0.4892
0.5399
Sal
0.0069
0.0392
<0.0001
<0.0001
<0.0001
0.0002
<0.0001
0.0014
Grg*Sal
<0.0001
<0.0001
0.8832
0.0766
0.9535
0.0295
0.0215
0.1156
DAT*Sal
<0.0001
<0.0001
<0.0001
0.4077
<0.0001
0.2868
0.0002
0.1665
Grg*DAT*Sal
<0.0001
<0.0001
0.0004
0.7510
0.0002
0.5686
0.0096
0.0971
R-Square
0.89
0.89
0.88
0.70
0.89
0.70
0.84
0.93
CV
6.50
6.67
6.62
10.36
6.65
11.32
6.00
11.95
RMSE
0.0049
0.0057
0.0052
0.0173
0.0043
0.0167
0.0093
0.0150
LSD0.05
0.0066
0.0080
0.0032
0.0176
0.0028
0.0152
0.0044
0.0098
Results presented in Fig. 3 and Tables 1–3 indicated that the three tested tomato cultivars showed a significant response to changes in the salinity concentration of irrigation water. The increase in salinity level was associated with an increase in the spectral reflectance in the Visible, Red-Edge and NIR regions of the electromagnetic spectrum for the three tested tomato cultivars. That was attributed to the fact that the increase in salinity exerted more stress on the plants and caused them to be less absorbent of incident light in these spectrum ranges due to reduced chlorophyll content and damage in the internal structure of the leaves. These results are consistent with the results reported by Katsoulas et al. (2016), where they stated that the spectral reflectance of stressed plants in the NIR region increased due to radiation scattering as a result of higher air content in the spongy cavities of plant leaves (i.e., lower water content). Although, the results reported by Zhang and Qin (2004), which revealed that healthy tomato plants exhibited the lowest reflectance in the visible range were in agreement with the results of this study, their other results, which stated that the highest reflectance was observed for the healthy tomatoes in the NIR range, were in contradiction with the results of this study. Results of this study are in partial agreement with the results reported by McVeagh et al. (2012), where they concluded that healthy plants absorbed more light in the visible region of the electromagnetic spectrum and; therefore, reflected less, while reflected more light in the NIR region of the spectrum compared to plants under stress. The highest salinity level (salinity3) showed significantly higher reflectance in the Visible, Red-Edge and NIR ranges for the three tomato cultivars. On the other hand, the differences between the spectral reflectance in the SWIR range (1300–2500 nm) were significant only for the Ghandowra-F1 cultivar. Also, the results of Valouro-RZ and Feisty-Red cultivars showed no significant differences in the spectral reflectance in the Visible range between salinity1 (2.5 dS m−1) and salinity2 (6.0 dS m−1). In general, these results indicated that both Valouro –RZ and Feisty-Red tomato cultivars could tolerate salinity of up to 6.0 dS m−1. The Ghandowra-F1 cultivar; however, was found to be more sensitive to salinity, as the increase in salinity concentration resulted in a significant negative spectral response. Table 4 summarizes the spectral reflectance of tomato plant idifferent region of the light spectrum.
Spectral Region
Current study
Published Studies
Visible
Increase in salinity level was associated with an increase in the spectral reflectance in the Visible region.
Healthy tomato plants exhibited the lowest reflectance in the visible range (Zhang and Qin, 2004).Healthy plants absorbed more light in the visible region, and therefore, less reflection compared to plants under stress
(McVeagh et al., 2012).
Red-Edge
Increase in salinity level was associated with an increase in the spectral reflectance in the Red-Edge region.
At 680 to 780 nm (red edge range), the influence of salinity on vegetation spectrum increases with the increase in salinization degree (Abd El-Hamid and Hong, 2020).
NIR
Increase in salinity level was associated with an increase in the spectral reflectance in the NIR region.
The spectral reflectance of stressed plants increased in the NIR region compared to health plants (Katsoulas et al., 2016).Healthy plants reflected more light in the NIR region of the spectrum compared to plants under stress
(McVeagh et al., 2012).
SWIR (1300–2500 nm)
No significant differences in the spectral reflectance due to salinity stress in the SWIR range.
Spectral reflectance results confirmed that wavelengths in the VIS region were more effective than NIR or SWIR regions in detecting salinity stress in tomatoes (FAO, 2022).
The results presented in Fig. 4 combined with the statistical results (Tables 1–3) showed that grafting had no significant influence on the spectral reflectance for the three studied tomato cultivars in almost all the major ranges of the electromagnetic spectrum. Exclusions were in the NIR range for the Valouro-RZ cultivar and the Red-Edge and SWIR-1 ranges for the Feisty-Red cultivar, where significant differences were observed as a result of grafting. These results indicated that grafting with Maxifort rootstock showed no significant change in the salinity tolerance of the studied tomato cultivars. This can be explained as that Maxifort rootstock is either incompatible with grafting under hydroponic systems or incompatible with the studied tomato cultivars. Hence, further research on grafting under hydroponic systems is essential because rootstock is usually doing well with respect to root diseases, but a more specific evaluation of rootstock regarding salinity tolerance and productivity along with top grafting variety is needed.
The spectral behavior of the studied tomato cultivars showed no significant differences in the early growth stages of the plants (35 and 50 DAT) in all the major ranges of the spectrum (Fig. 5). However, high significant differences in the spectral reflectance were observed between the late crop growth stage (65 DAT) and the early growth stages, especially in the NIR and SWIR ranges of the spectrum. Comparisons of the spectral results with those of previous studies are presented in Table 4.
3.1 Response of total tomato fruit yield to salinity level and grafting
The total yield, determined as the cumulative weight of all tomato fruits harvested during the entire period per unit area (kg m−2), was studied against both salinity levels (Fig. 6) and grafting (Fig. 7). In general, the results of this study showed that the increase in salinity imposed a negative effect on the total tomato fruit yield. However, both Valouro-RZ and Feisty-Red cultivars revealed moderate tolerance to water salinity, especially for non-grafted treatments. For the Ghandowra-F1 cultivar, increasing salinity concentration resulted in significantly low tomato yield for both grafted and non-grafted treatments. The average total fruit yield of both non-grafted and grafted tomato cultivars, depicted in Fig. 6, showed that growing Valouro-RZ tomato cultivar under salinity levels of up to 6.0 dS m−1 (salinity2) resulted in no significant differences (LSD = 2.0 kg m−2), where the average total yield under salinity2 was 20.6 kg m−2 compared to 22.1 kg m−2 under salinity1. However, the average total fruit yield under salinity3 (15.1 kg m−2) was significantly lower than that under both salinity1 and salinity2. Almost the same trend was observed for the Feisty-Red cultivar, where the average total yield of the non-grafted and grafted treatments showed no significant differences between the total fruit yield under salinity1 (25.1 kg m−2) and that under salinity2 (23.4 kg m−2). However, the total fruit yield under salinity3 (16.7 kg m−2) was significantly lower compared to that under both salinty1 and salinity2. Results of the Ghandowra-F1 cultivar indicated that the increase in salinity concentration resulted in a significant decrease in the total fruit yield for both grafted and non-grafted treatments. The total fruit yield of the Ghandowra-F1 cultivar decreased as salinity increased from 2.5 dS m−1 to 6.0 dS m−1 and 9.5 dS m−1, by 10.9 % and 30.6 %, respectively. These results revealed that both the Valouro-RZ and Feisty-Red tomato cultivars could be grown successfully under a hydroponic system using irrigation water of up to (6.0 dS m−1) salt concentration without sacrificing total fruit yield.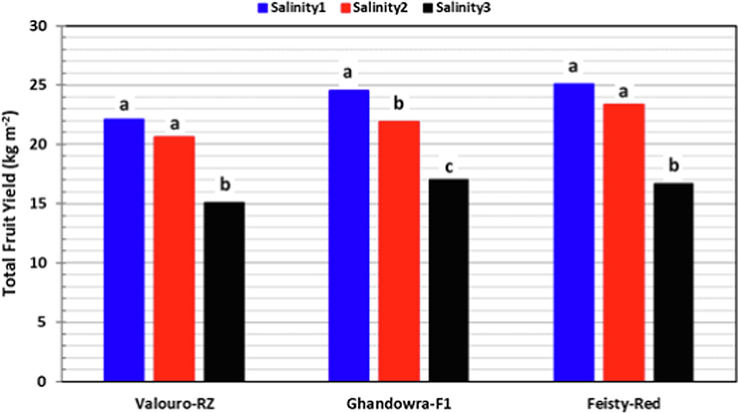
Impact of salinity level on the overall mean of the total tomato fruit yield for the three studied cultivars.
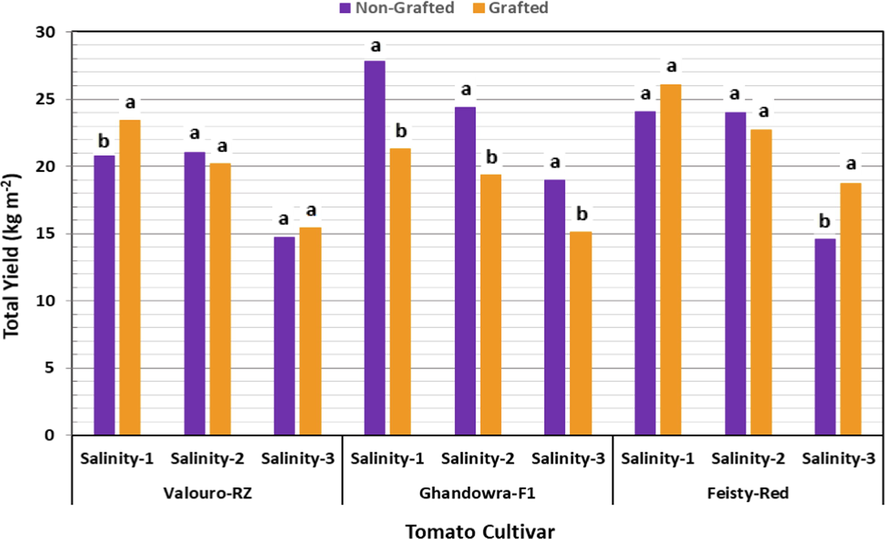
Impact of grafting on the total tomato fruit yield under different salinity levels.
The results presented in Fig. 7 indicated that the influence of grafting on the total fruit yield of the studied tomato cultivars was significant only under the low salinity level (2.5 dS m−1) for Valouro-RZ and Feisty-Red cultivars. Another significant increase due to grafting was observed for the Feisty-Red cultivar under a high salinity level (9.5 dS m−1). A negative impact of grafting on the total fruit yield was observed under the medium salinity level (6.0 dS m−1) for both Valouro-RZ and Feisty-Red cultivars. However, grafting resulted in a significantly low yield of the Ghandowra-F1 cultivar under the three salinity levels. In general, grafting on Maxifort rootstock showed no significant improvement in the yield of the studied tomato cultivars. These results are consistent with the results reported by Savvas et al. (2011), which indicated that the differences in the yield of tomatoes, grown in a hydroponic system, between grafting treatments at low and medium salinity resulted from differences in the number of fruits per plant, while the fruit weight was not influenced by grafting. In contrast, Rahmatian et al. (2014) reported that the average fruit weight, number of fruits, and yield were significantly increased by 11, 17.8, and 27 %, respectively, in the grafted tomato plants grown in hydroponics.
4 Conclusions
A study was designed to investigate the influence of three salinity levels (2.5, 6.0 and 9.5 dS m−1) and grafting on Maxifort rootstock on the spectral response and total fruit yield of three tomato cultivars (Valouro-RZ, Ghandowra-F1 and Feisty-Red) grown in a hydroponic glasshouse. The following conclusions can be drawn from this study:
-
Increase in salinity level was associated with an increase in the spectral reflectance in the Visible, Red-Edge and NIR regions of the electromagnetic spectrum for the studied tomato cultivars. Valouro-RZ and Feisty-Red cultivars showed no significant differences in the spectral reflectance in the Visible range between salinity1 (2.5 dS m−1) and salinity2 (6.0 dS m−1).
-
Growing Valouro-RZ and Feisty-Red tomato cultivars hydroponically under salinity levels of up to 6.0 dS m−1 (Sainity2) resulted in no significant differences in the total fruit yield. However, a slight reduction in the total fruit yield was recorded under salinity2 compared to salinity1 (2.5 dS m−1) for Valouro-RZ (6.76 %) and Feisty-Red (6.79 %). Under salinity3 (9.5 dS m−1), significant reductions in total fruit yield were recorded compared to salinity1 (Valouro-RZ: 31.77 %, Feisty-Red: 33.53 %) and Salinity2 (Valouro-RZ: 26.82 %, Feisty-Red: 28.69 %).
-
As indicated by its negative response to the increase in salinity concentration, Ghandowra-F1 was characterized as the most salinity sensitive among the studied tomato cultivars. A significant reduction was observed in the total yield as salinity increased from 2.5 dS m−1 to 6.0 dS m−1 (10.85 %) and 9.5 dS m−1 (30.63 %).
-
Grafting on Maxifort rootstock showed neither a significant effect on the spectral reflection nor a significant improvement on the yield; hence, no positive change in salinity tolerance of the studied tomato cultivars. Therefore, further research on the feasibility of grafting under hydroponic systems is necessary.
-
Valouro-RZ and Feisty-Red tomato cultivars can be grown successfully under the hydroponic system using irrigation water of up to 6.0 dS m−1 salt concentration without sacrificing the total fruit yield.
Acknowledgments
This project was funded by the National Plan for Science, Technology, and Innovation (MAARIFAH), King Abdulaziz City for Science and Technology, Kingdom of Saudi Arabia, award number (11-AGR1939-02). The authors are also grateful to the Research Chairs Program, Deanship of Scientific Research, King Saud University, Riyadh for providing facilities for the study.
Declaration of Competing Interest
The authors declare that they have no known competing financial interests or personal relationships that could have appeared to influence the work reported in this paper.
References
- Hyperspectral remote sensing for extraction of soil salinization in the northern region of Ningxia. Model Earth Syst. Environ.. 2020;6:2487-2493.
- [CrossRef] [Google Scholar]
- Evaluating the performance of spectral features and multivariate analysis tools to detect laurel wilt disease and nutritional deficiency in avocado. Compute. Electron. Agric.. 2018;155:203-211.
- [CrossRef] [Google Scholar]
- Management of irrigation water salinity in greenhouse tomato production under calcareous sandy soil and drip irrigation. J. Agr. Sci. Tech.. 2012;14:939-950.
- [Google Scholar]
- Genetic dissection of tomato rootstock effects on scion traits under moderate salinity. Theor. Appl. Genetics.. 2015;128:667-679.
- [Google Scholar]
- Future food-production systems: vertical farming and controlled-environment agriculture. Sustain.: Sci Pract. Policy.. 2017;13:13-26.
- [CrossRef] [Google Scholar]
- Biggs, L., Giles, D., 2013. Current and future agricultural practices and technologies which affect fuel efficiency, Version: 1. Europe Intelligent Energy for Sustainable Future, IEE/09/764/SI2.558250. Available at: https://ec.europa.eu/energy/intelligent/projects/sites/iee-projects/files/projects/documents/efficient20_review_of_agricultural_practices_and_technologies_en.pdf .
- Screening Some Tomato Commercial Cultivars from Thailand for Salinity Tolerance. Asian J. Plant Sci.. 2007;6:788-794.
- [CrossRef] [Google Scholar]
- FAO, 2022. Early stress detection in tomato (Solanum lycopersicon) induced by moderate salinity using spectral reflectance and molecular approaches. Accessed on 10 November, 2022 from: https://agris.fao.org/agris-search/search.do?recordID=QC2013200808.
- Irrigation water consumption and its impact on the groundwater aquifer of Wadi Uranah, Makkah, Saudi Arabia using remote sensing techniques. The Egypt. J. Remote Sens. Space Sci.. 2020;23:167-180.
- [CrossRef] [Google Scholar]
- Hochmuth, G.J., Hochmuth, R.C., 2018. Nutrient Solution Formulation for Hydroponic (Perlite, Rockwool, NFT) Tomatoes in Florida. Univ. Florida, IFAS Extension, Publication #HS796, https://edis.ifas.ufl.edu/pdf/CV/CV216/CV216-2297144.pdf. (accessed 11 September 2022).
- Jacquemoud, S., Ustin, S.L., 2001. Leaf optical properties: a state of the art. Proc. 8th Int. Symposium Physical Measurements & Signatures in Remote Sensing, Aussois (France), 8-12 January 2001, CNES, pages 223-232. https://citeseerx.ist.psu.edu/viewdoc/download;jsessionid=016558C7722FF10C8568 DDB8C0E2DFCB?doi=10.1.1.489.882&rep=rep1&type=pdf (accessed 11 September 2022).
- Crop reflectance monitoring as a tool for water stress detection in greenhouses: A review. Biosyst. Eng.. 2016;151:374-398.
- [CrossRef] [Google Scholar]
- Grafting influence on the weight and quality of tomato fruit under salt stress. Ann. Appl. Biology. 2018;172:187-196.
- [Google Scholar]
- Growth, yield and fruit quality of Mexican tomato landraces in response to salt stress. Not. Bot. Horti. Agrobot. Cluj Napoca.. 2021;49(1):12005.
- [CrossRef] [Google Scholar]
- McVeagh, P., Yule, I., Grafton, M., 2012. Pasture yield mapping from your ground spread truck. In: Currie, L.D., Christensen, C.L. (Eds.), Advanced Nutrient Management: Gains from the Past—Goals for the Future, Occasional Report No. 25; Fertilizer and Lime Research Centre: Palmerston North, New Zealand, 2012, pp. 1–5. https://www.massey.ac.nz/∼flrc/workshops/12/Manuscripts/McVeagh_2 012.pdf.
- Towards Assessment of Saudi Arabia Public Awareness of Water Shortage Problem. Resour. Environ.. 2013;3:10-13.
- [CrossRef] [Google Scholar]
- Comparative salinity responses among tomato genotypes and rootstocks. Pak. J. Bot.. 2011;43(6):2665-2672.
- [Google Scholar]
- A Review of Recent Research on Tomato Nutrition, Breeding and Post-Harvest Technology with Reference to Fruit Quality. Eur. J. Plant Sci. Biotechnol.. 2007;1:1-21.
- [Google Scholar]
- Genetic resources for rootstock breeding. In: Colla G., Perez-Alfocea F., Schwarz D., eds. Vegetable Grafting: Principles and Practices. Oxfordshire, Oxford, U.K: CAB International; 2017. p. :22-69.
- [Google Scholar]
- Effect of grafting on growth, yield and fruit quality of single and double stemmed tomato plants grown hydroponically. Hortic. Environ. Biotechnol.. 2014;55(115–119):2014.
- [CrossRef] [Google Scholar]
- Resh, H.M., 2013. Hydroponic Food Production: A definitive guidebook for the advanced home Gardner and the commercial Hydroponic Grower. Seventh Edition. California: CRC Press, Taylor & Francis Group, Boca Raton. ISBN-13: 978-1-4398-7869-9 (eBook - PDF). http://www.crcpress.com.
- Roman, A., Ursu, T., 2016. Multispectral satellite imagery and airborne laser scanning techniques for the detection of archaeological vegetation marks, In: Opero C.H., Lăzărescu, V., (Eds), Landscape Archaeology on the Northern Frontier of the Roman Empire at Porolissum: An Interdisciplinary Research Project, MEGA Publishing House, ISBN: 978-606-543-787-6, pp. 141–152.
- A review of advanced techniques for detecting plant diseases. Comput. Electron. Agric.. 2010;72:1-13.
- [CrossRef] [Google Scholar]
- Effects of three commercial rootstocks on mineral nutrition, fruit yield, and quality of salinized tomato. J. Plant Nutr. Soil Sci.. 2011;174:154-162.
- [CrossRef] [Google Scholar]
- Effect of salinity on tomato (Lycopersicon esculentum Mill.) during seed germination stage. Physiol. Mol. Biol. Plants. 2011;18(1):45-50.
- [CrossRef] [Google Scholar]
- Suarez, L., Restrepo-Coupe, N., Hueni, A., Chisholm, L.A., 2015. Vegetation spectroscopy, In: Held, A., Phinn, S., Soto-Berelov, M., Jones, S., (Eds.), AusCover Good Practice Guidelines: A technical handbook supporting calibration and validation activities of remotely sensed data product, Version 1.1. TERN AusCover, ISBN 978-0-646- 94137-0, pp. 221–233.
- Tempfli, K., Huurneman, G.C., Bakker, W.H., Janssen, L.L.F., et. al., 2009. Principles of remote sensing: an introductory textbook. (ITC Educational Textbook Series; Vol. 2). International Institute for Geo-Information Science and Earth Observation. http://www.itc.nl/library/papers_2009/general/PrinciplesRemoteSensing.pdf.
- Ustin, S.L., Jacquemoud, S., 2020. How the Optical Properties of Leaves Modify the Absorption and Scattering of Energy and Enhance Leaf Functionality, In: Jeannine Cavender-Bares, J., Gamon, J.A., Townsend, P.A., (Eds), Remote Sensing of Plant Biodiversity, pp. 349–384. https://link.springer.com/content/pdf/10.1007%2F978-3-030-33157-3.pdf.
- World Bank, 2017. Frontier Agriculture as a solution to improve refugee livelihoods: Unleashing Climate-Smart & Water-Saving Agriculture Technologies in MENA. Report No: AUS22794, GWA05 Middle East and North Africa, 19 September 2017. http://documents.worldbank.org/curated/en/103361524057787356/pdf/RWSAT-AUS.pdf. (accessed 8 September 2022).
- Zhang, M., Qin, Z., 2004. Spectral analysis of tomato late blight infections for remote sensing of tomato disease stress in California. IEEE 2004 International Geosciences and Remote Sensing Symposium, VI, September 20-24, 2004, Anchorage, Alaska, USA: 4091–4094. https://doi.org/10.1109/IGARSS.2004.1370031.


