

Translate this page into:
Dielectric performance of CeO2/ZnO core–shell nanocomposite with their structural, optical and morphological properties
⁎Corresponding author. punithavelan.n@vit.ac.in (N. Punithavelan)
-
Received: ,
Accepted: ,
This article was originally published by Elsevier and was migrated to Scientific Scholar after the change of Publisher.
Peer review under responsibility of King Saud University.
Abstract
Binary CeO2/ZnO nanocomposite was synthesized by combined co-precipitation and hydrothermal method. The dielectric property of the CeO2/ZnO was investigated. The grain boundaries were responsible for the increase and decrease of dielectric constant and AC conductivity which is discussed in the dielectric study. The prepared sample was carried out for the thermogravimetric, structural, optical, morphological investigations. The thermal stability of the sample was examined using the thermogravimetric analysis. Both the CeO2 and ZnO phases were confirmed from the Powder X-ray diffraction analysis (PXRD). The fourier transform infrared spectroscopy (FTIR) study further affirmed the presence of ceria and ZnO metal oxides in the nanocomposite is reported in detail. The particle size distribution graph was plotted from the high resolution-scanning electron microscopic image. CeO2/ZnO nanocomposite exhibited the spherical like structures which was confirmed from the high resolution transmission microscopy (HRTEM) images.
Keywords
Kubelka-Munk function model
CeO2/ZnO nanocomposite
Diffuse reflectance spectroscopy
Dielectrics Properties
Electron microscopy
Thermogravimetric analysis

1 Introduction
Nanocomposite is a type of nanomaterial which has one or more phases existing in nano-scale dimension with exceptional thermal stability, stiffness, and other physical properties (Kennedy et al., 2017). Combined semiconductor metal oxide nanostructures as composite materials has been receiving extensive attention nowadays due to their engineered structural, optical, morphological properties (Hassanpour and Safardoust, 2017). The existence of more than one phase or constituent material coupling between transition metal oxides like CuO-NiO (Krishnan et al., 2022), ZnO-CuO (Zhang et al., 2016), NiO-ZnO (Kim et al., 2017) has been reported so far for their catalytic, sensor and dielectric applications. However, rare earth metals in oxide forms are known for their unique structural, optical and morphological properties. Understanding the effect of coupling rare earth metal oxides and transition metal oxides is quite fascinating. Cerium oxide (CeO2) is a rare earth metal oxide which is widely used in energy storage applications when doped with transition metal oxides, was also reported (Murugan et al., 2017; Ojha et al., 2017). CeO2 has also been considered in applications like electrochemical gas sensors (Rajgure et al., 2014), photocatalyst (Ahmad et al., 2015), and energy storage devices (Manibalan et al., 2019). The bulk CeO2 has a bandgap of 3.2 eV and acts as a potential candidate in photovoltaic applications (Montini et al., 2016). Zinc oxide (ZnO), a hexagonal wurtzite n-type semiconductor material, has a wide bandgap of 3.37 eV and a large exciton of 60 meV. (Lanje et al., 2013). Both CeO2 and ZnO have comparable bandgaps, and it is expected that the coupling of these two oxides will results in metal oxides structures with tunable physical properties (Diao et al., 2018).
This paper reports the structural, optical, morphological and mainly dielectric characterization results of core–shell like structured CeO2/ZnO nanocomposite. The synthesis of CeO2/ZnO have been reported already using several methods like sol–gel (Akbari et al., 2017), co-precipitation (Fabbiyola et al., 2015), hydrothermal (Kalubarme et al., 2013), hybridized hydrothermal (Ranjith Reddy et al., 2016), solid stabilized emulsion route (He et al., 2006), electrodeposition (Hajji et al., 2014) and soft solution chemical route (Li Ruixing et al., 2002). The synthesis method of CeO2/ZnO nanocomposite followed in the current work combines co-precipitation and hydrothermal method, which is more simpler and economical, with zero utilization of capping agents and surfactants. We have achieved the core-shell like nanoparticle in the size of quantum dots. The dielectric measurements have only been performed individually on CeO2 and ZnO metal oxides (Lanje et al., 2013; Prabaharan et al., 2016) but not for CeO2/ZnO nanocomposite. Therefore, the present work is focused on dielectric properties of core–shell like structured CeO2/ZnO nanocomposite and their structural, optical and morphological investigations.
2 Synthesis methods of CeO2/ZnO nanocomposite
2.1 Synthesis procedure
Cerium (III) nitrate hexahydrate with 99.99 % purity was obtained from Alfa Aesar, and Zinc chloride (ZnCl2) with analytical reagent grade was obtained from Sisco Research Lab (SRL). 0.5 M cerium nitrate and 0.5 M zinc chloride were dissolved in 25 mL of deionized water. In a beaker, a 99.99 % solution of sodium hydroxide (NaOH) was dissolved in 10 mL of deionized water. The prepared acidic precursors cerium nitrate hexahydrate and zinc chloride solution were stirred in a magnetic stirrer for 1 h to obtain a clear homogeneous solution and then NaOH solution was added drop by drop to this solution until a precipitate was formed. The precipitate was transferred to a 100 mL Teflon beaker and stored in a stainless steel autoclave. The autoclave was then heated in the muffle furnace to 180 °C for twelve hours. The obtained precipitate was washed with distilled water after heating, to remove volatile compounds. The precipitate was dried for 2 h in a hot air oven at 120 °C which resulted in a powder sample. The sample was annealed in a vacuum furnace at 500 °C for 48 h (Srinivasan and Punithavelan, 2022).
2.2 Characterization details of CeO2/ZnO nanocomposite
The synthesized core–shell like structured CeO2/ZnO nanocomposite was characterized and its studies were reported in the previous results. The thermal stability of the synthesised nanocomposite was determined using thermogravimetric analysis on a Seiko Thermo - Analyzer (7200) instrument at a heating rate of 10° C/min in an argon atmosphere. Powder X-ray diffraction (PXRD) of the synthesised nanocomposite was performed using Rigaku (Smart Lab) with CuKα radiation of wavelength = 0.15406 nm and diffraction angle between 20°−80°. Using a Thermo Scientific Nicolet iS10 infrared spectrophotometer, the Fourier transform IR spectrum (FTIR) was recorded between 400 and 4000 cm−1. UV-Diffuse reflectance spectrometry (DRS-UV) (Thermo Scientific Evolution 300 UV–vis) was used to examine the optical properties for 200 nm to 800 nm range of wavelength. The morphology was analysed using a high resolution scanning electron microscope (HR-SEM) and a high resolution transmission electron microscope (HR-TEM). The dielectric data were collected at various temperatures with the HIOKI HITESTER model 3532–50 LCR metre.
3 Results and discussion
The thermogravimetric (TG) and differential thermal analysis (DTA) of CeO2/ZnO nanocomposite heated from 100 and 800 °C and at a rate of 10 °C/min in Argon gas atmosphere is shown in Fig. 1. Both endothermic and exothermic peaks were observed, which indicated the weight loss of CeO2/ZnO nanocomposite. The weight loss at 146 °C indicated the physisorption of water molecules on CeO2/ZnO nanocomposite. On further heating of the samples another weight loss was observed around 400 °C, attributed to the loss of OH– ions and chemisorbed molecules. The weight loss was due to the synthesis condition, which caused the reduction in the average particle size. As a result, it increases the efficiency of thermal conduction.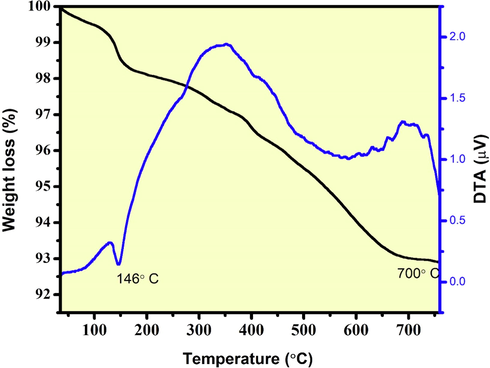
TG-DTA pattern of CeO2/ZnO nanocomposite.
The X-ray diffraction pattern of CeO2/ZnO nanocomposite is shown in Fig. 2, and it confirmed the presence of both CeO2 phases with the space group Fm-3 m of cubical fluorite structure and ZnO phases with the space group P63mc of hexagonal wurtzite structure. The JCPDS Card No. 00–034-0394 for CeO2 and JCPDS Card No. 00–036-1451 for ZnO were well matched with the observed CeO2/ZnO nanocomposite peaks. The peak positions of 28.64°, 31.81°, 33.18°, 34.53°, 36.35°, 47.62°, 56.55°, 59.22°, 62.93°, 66.36°, 68.02°, 69.54°,76.89° and 78.56° were labelled with the corresponding CeO2 and ZnO phases as shown in Fig. 2. The corresponding (hkl) planes were (1 1 1), (1 0 0), (2 0 0), (0 0 2), (1 0 1), (2 2 0), (3 1 1), (2 2 2), (1 0 3), (2 0 0), (1 1 2), (4 0 0), (3 3 1) and (4 2 0) were also mentioned. The high-intensity peaks reflected the highly crystalline nature of the synthesised CeO2/ZnO nanocomposite, which was due to the 500 °C annealing process. The lattice parameters for the corresponding phases of cubic and hexagonal structures were calculated using the following equations: where d is the inter-atomic spacing, a, b and c are the lattice constants:
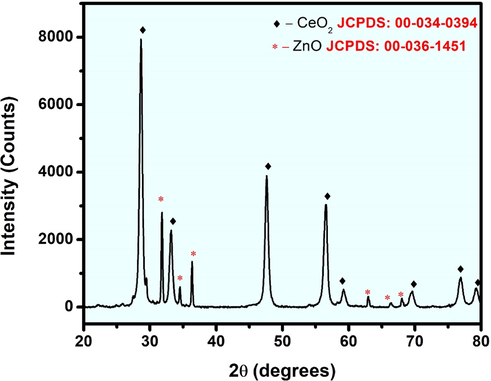
X-ray diffraction pattern of CeO2/ZnO nanocomposite.
In Table 1, we observed that the a, b, c and unit cell volume (V) (Morris et al., 2006) values are slightly lesser than the actual values which may be attributed to the surface tension while preparing the sample. The increase in surface energy of nanoparticles tends to contract their sizes by elastically distorting their crystal lattices (Qi et al., 2003). The Debye Scherrer formula was used to calculate crystallite sizes (Cullity, n.d.),
CeO2/ZnO
Lattice Parameter
Crystallite Size (nm)
a
(Å)
b
(Å)
c
(Å)
d-spacing
(Å)
Unit Cell Volume
(Å)3
Scherrer formula
Actual
Observed
Actual
Observed
Actual
Observed
Actual
Observed
Actual
Observed
CeO2 (Cubical Fluorite)
5.4113
5.3884
5.4113
5.3884
5.4113
5.3884
3.1233
3.1101
158.46
156.45
14.49
ZnO (Hexagonal Wurtzite)
3.2498
3.24470
3.2498
3.24470
5.2066
5.1845
2.4759
2.4688
47.62
47.26
32.41
From Eqs. (4) and (5), the concentration of CeO2 was found to be 45 %, and ZnO is 55 % for Zinc oxide of the volume occupied from the synthesized sample. The values were calculated with the prominent peaks (i) 28.65° with the corresponding plane (1 1 1) for CeO2 and (ii) 36.35° with the corresponding plane (1 0 1) for ZnO. The FTIR measurements of the CeO2/ZnO nanocomposite in the form of KBr pellet is as shown in Fig. 3. The bands around 720 and 903 cm−1 are due to CeO2 stretching modes (Harish et al., 2018), and the band around 453 cm−1 is the ZnO's vibrational mode (Arif et al., 2018). The band at a higher frequency around 1390 cm−1 is attributed to CO2 molecules absorption. The rise in the peak around 1638 cm−1 is a result of the absorption of water molecules, and the increase in the peak around 2360 cm−1 is owing to the presence of CO2 in the atmosphere. The presence of O—H stretching vibrations is also indicated by the wide peak at 3495 cm−1 (Zamiri et al., 2015). Diffuse reflectance spectroscopy (DRS) was used to examine the optical properties of the synthesized nanocomposite in the electromagnetic spectrum's UV and visible region. The bandgap was measured using the Kubelka-Munk function model. (Zhu et al., 2010),
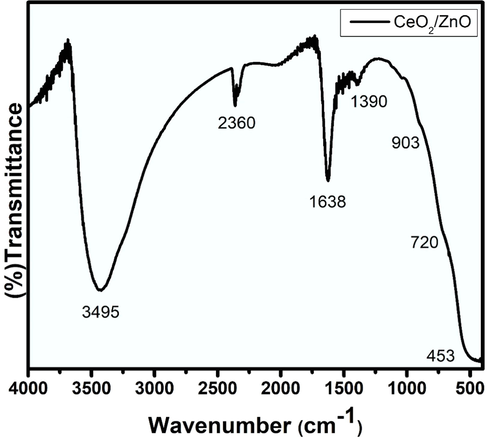
FTIR Spectra of CeO2/ZnO nanocomposite.
F(R) is the Kubelka-Munk function, α - absorbance coefficient and R - Reflectance value.
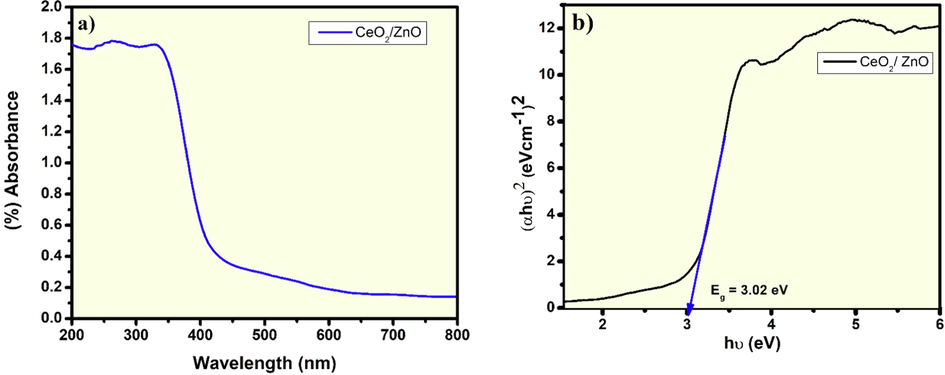
DRS (UV–vis) spectra: (a) absorbance and; (b) Bandgap formation of CeO2/ZnO nanocomposite.
The morphology of the CeO2/ZnO nanocomposite was investigated using high resolution scanning electron microscopy. This clearly identified spherical agglomerated particles in the 500 nm image as shown in Fig. 5(a). The particle size distribution analysis was measured using Imagej software in an average range of particles size with 23.5 nm as shown in Fig. 5(b). In Fig. 5(c), the EDAX analysis shows the presence of Ce, Zn and O peaks with their corresponding composition and atomic weight percentages. The appearance of carbon peak in the spectra at 0.277 keV is due to the carbon coating in the process of analysis of the sample. The peak positioned at 2.1 keV indicates Au's presence, which could be traced from the sputter coating process of the sample preparation required for the morphological studies. No other impurities were present in the synthesized nanocomposite sample. For further thorough study about the particle size the high-resolution transmission electron microscope images of the synthesized CeO2/ZnO nanocomposite was captured and as shown in Fig. 6(a). The formation of nanoparticles was confirmed as a core–shell like structure, and the sizes were measured in the range of 2 nm. The darker portions correspond to the CeO2 core, while the lighter portion shows the presence of ZnO shell. The d-spacing values for both CeO2 and ZnO were well matched with the significant value shown in Fig. 6(b). The d-spacing value 0.31 nm matched with the high-intensity peak of CeO2 with the corresponding Bragg's angle of 28.64°. The SAED pattern in Fig. 6(c) is the evidence of the polycrystalline nature of the CeO2/ZnO nanocomposite. The measured lengths of 6.40 and 7.84 nm shows the corresponding CeO2 (1 1 1) and ZnO (1 0 0) (hkl) planes. The grain boundaries were tiny, and average particle sizes were measured in the range of 10–20 nm, as shown in Fig. 6(d). Combined semiconductor metal oxide structures (CSMOS), as are potential dielectric material that is more suitable for barrier layer capacitors (BLC) applications due to their layered conducting grain boundaries (Gürbüz and Okutan, 2016). The transfer mechanism of microwaves into these materials is difficult to understand since electric polarization of molecules or ions electrical polarization occurs through many contributions (Lanje et al., 2013). When a microwave electric field is applied, the atoms or molecules in the nanomaterials become polarized and rotate with microwave energy that is transferred into the material (Santha et al., 2004). CeO2/ZnO nanocomposite dielectric properties at different temperatures (32–300 °C) and frequencies (5 Hz−5 MHz) were studied in their pellet form with 10 mm diameter in size. The dielectric constant was measured using the Eq. (8) as follows below:
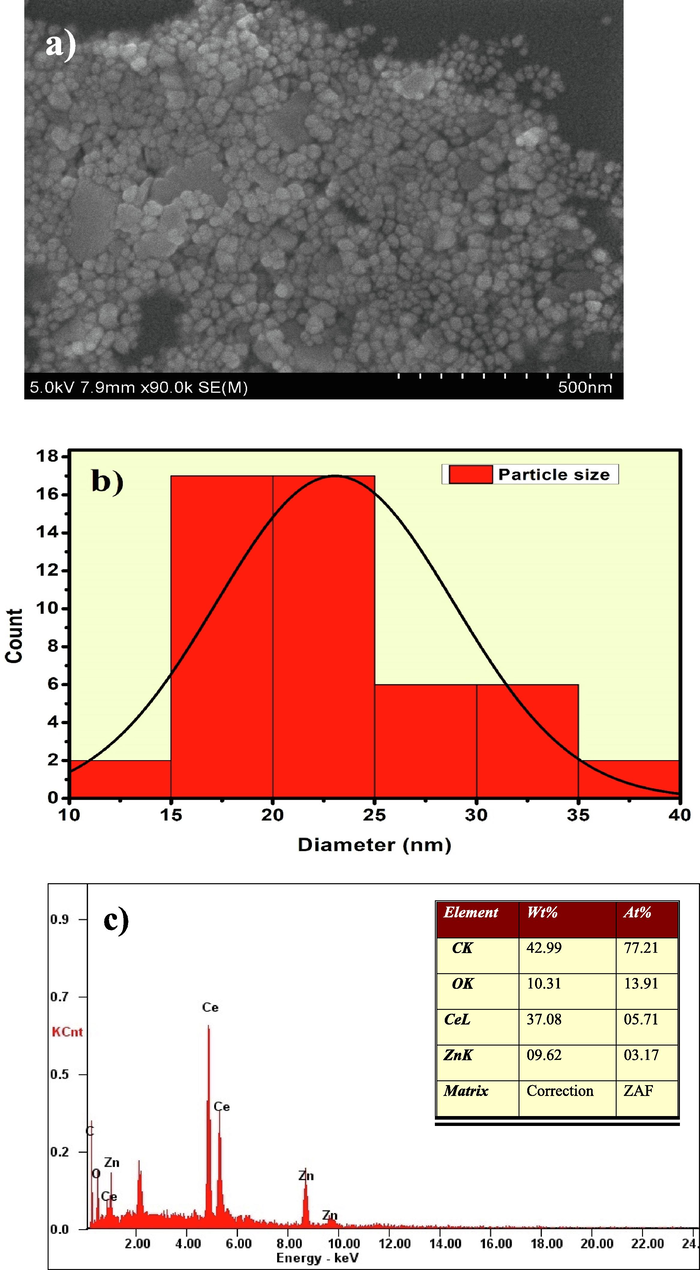
(a). HR-SEM image of 500 nm; (b) Particle size distribution and; (c) EDAX analysis of CeO2/ZnO nanocomposite.
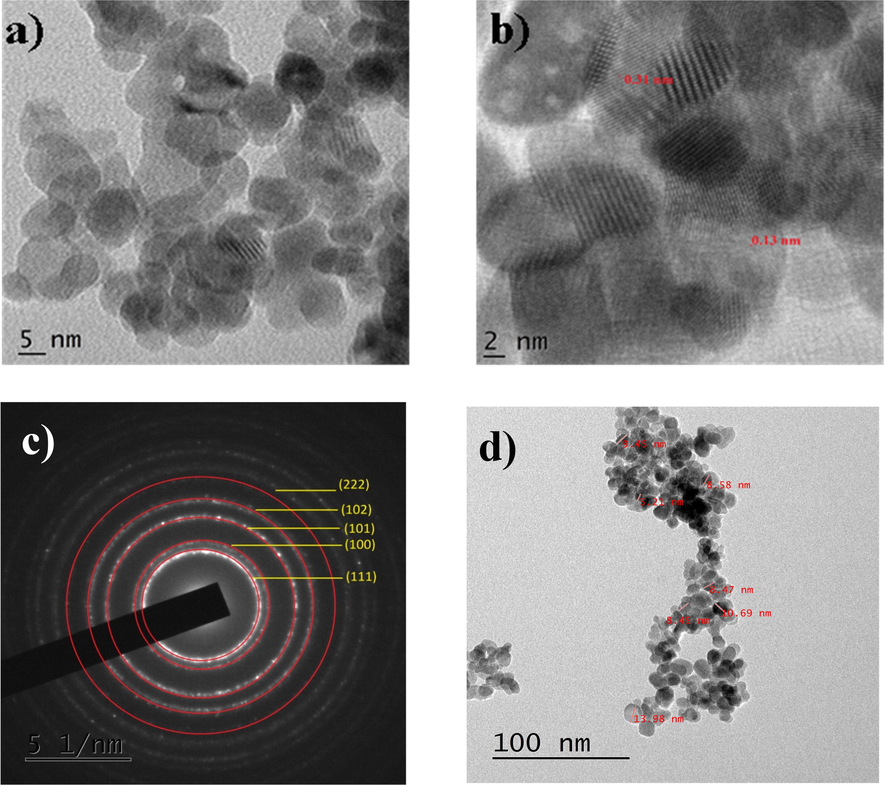
HR-TEM images of CeO2/ZnO nanocomposite; (a) 5 nm image; (b) d-Spacing marked; (c) SAED pattern and; (d) Particle size.
In Fig. 7(a), the variation of the dielectric constant with Log F was shown. The dielectric constant is higher at lower frequencies, decreases steadily towards the higher frequencies, and becomes almost constant at the higher end of frequency. The Maxwell-Wagner (M−W) model predicts that the layered conducting grain boundaries are poor in conducting grains. (O’Neill et al., 2000). An external electric field's application migrates the charge carriers and accumulates them at the grain boundary regions, leading to high polarization and dielectric constants (Bellino et al., 2006). The ionic conductivity is weaker at the grain boundary regions, increasing the space charge effect in nanocomposite particles. Hence, the dielectric constant is higher at lower frequencies (Singh et al., 2014). However, it is not the same over the entire frequency regions; as the frequency increases, the dielectric constant decreases and reaches saturation. Polarization occurs via space charge effect, and the rotation direction at the interfaces could explain the high dielectric constant at lower frequencies (Oruç and Altındal, 2017). A chance of induced dipole moment occurs at the CeO2/ZnO nanocomposite interface region upon the applied external electric field, which allows the rotations of atoms or ions towards the applied electric field direction which in turn causes rotation direction polarization. In general, the atoms in nanocomposite or nanocrystalline materials prefer to occupy the grain boundary regions. The charge trapping makes them electrically tuned up within the grains (Sagadevan et al., 2017). The dipole moment can be induced easily at the lower frequencies upon applying an external electric field. Summarizing, both the space charge and the rotation direction polarization were very active in lower frequencies. Therefore, a high dielectric constant occurs at the lower frequencies and decreases at higher frequencies. Hence, it is expected that the materials show a higher dielectric constant in their nano form over the conventional bulk materials. The well-structured grain boundary interfaces will increase the space charge polarization at a higher temperature, and therefore, a high dielectric constant was observed at 300 °C.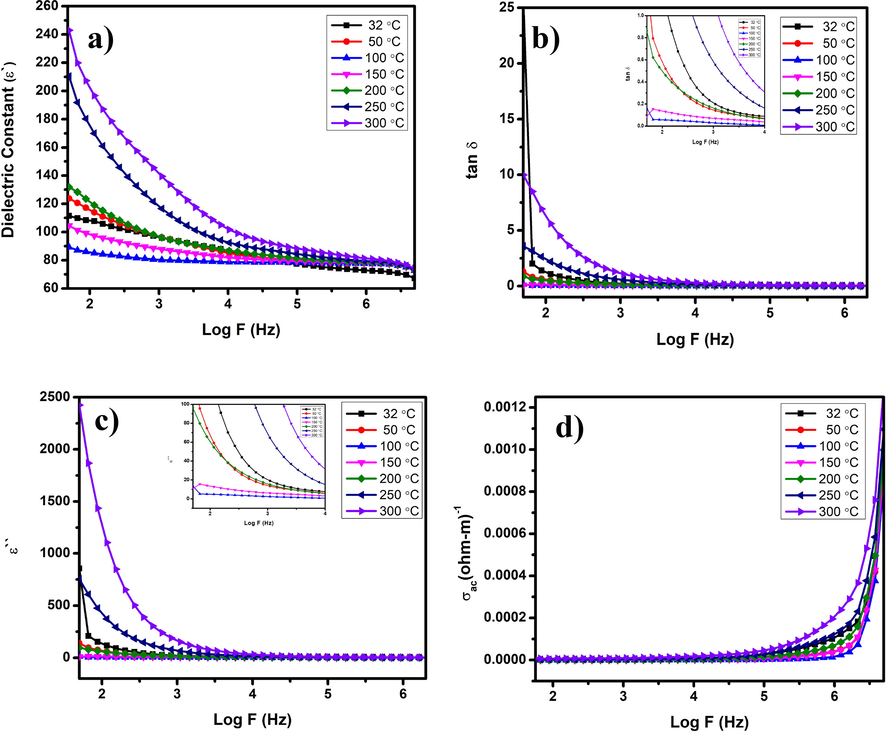
(a) Dielectric constant; (b) Dielectric loss in terms of tan δ; (c) Imaginary loss and; (d) Conductivity in AC.
The dielectric loss in dielectric materials was due to the production of absorption current. The tan δ and dielectric loss were shown in Fig. 7(b) and 7(c) decreases when the frequency increases, reaches saturation. The dielectric loss is due to the following reasons: Only an inevitable part of electrical energy is needed for the molecules to orient along the electric field's direction to minimize the internal friction (Mangalam et al., 2016). The other amount of electrical energy is required for rotations and transfer of molecules. The presence of defects like oxygen vacancies may also produce an absorption current. The AC conductivity of CeO2/ZnO nanocomposite shows zero value at lower frequencies and increases sharply at higher frequencies, as displayed in Fig. 7(d). The hopping mechanism of charge carriers in the poorly conducting grains trapped by oxygen vacancies could be responsible for rise in conductivity at higher frequencies. The space charge polarization dominates at the lower frequencies, resulting in very low AC conductivity (Singh et al., 2015). The increased electrical conductivity in CeO2/ZnO nanocomposite could also be due to the increase in electron concentration when the extra electrons were generated in order to compensate the charge balance by adding Ce4+ for Zn2+, thus the increased concentration of electrons slightly increases the electrical conductivity.
4 Conclusion
The current report has reported the synthesis of core–shell-like structured CeO2/ZnO nanocomposite powder using the combined co-precipitation - hydrothermal method. This synthesis method is observed to be more economical, and the synthesized nanoparticle sizes were in the quantum dots range with a core–shell like structure. In thermogravimetric analysis, the weight loss was possibly due to the synthesis conditions, which could have caused the reduction in the average particle size. As a result, it increases the efficiency of thermal conduction. The Powder X-ray diffraction pattern of CeO2/ZnO nanocomposite confirmed the presence of both CeO2 phase with the space group of Fm-3 m of cubical fluorite structure and ZnO phase with the space group P63mc of the hexagonal wurtzite structure. The bandgap of 3.02 eV for CeO2/ZnO nanocomposite was obtained from the direct interband transition. This showed the electron transportation phenomenon would occur in the UV–visible junction region. The average particle size distribution of the nanocomposite is 23.5 nm. According to the Maxwell-Wagner (M−W) model, the dielectric properties showed a trend in which the layered conducting grain boundaries are poor in conducting grains. Both the space charge and the rotation direction polarization were very active in lower frequencies. Therefore, a high dielectric constant and dielectric loss occurs at the lower frequencies and decreases at higher frequencies. The hopping mechanism of charge carriers in the poorly conducting grains trapped by oxygen vacancies could be responsible for increased conductivity at higher frequencies. The space charge polarization dominates at the lower frequencies, resulting in very low AC Conductivity.
Declaration of Competing Interest
The authors declare that they have no known competing financial interests or personal relationships that could have appeared to influence the work reported in this paper.
References
- Enhanced photocatalytic activity of Ce-doped ZnO nanopowders synthesized by combustion method. J. Rare Earths. 2015;33:255-262.
- [CrossRef] [Google Scholar]
- Zinc-doped cerium oxide nanoparticles: sol-gel synthesis, characterization, and investigation of their in vitro cytotoxicity effects. J. Mol. Struct.. 2017;1149:771-776.
- [CrossRef] [Google Scholar]
- Sol-gel deposited ZnO thin films on glass substrate: investigation of structural, optical and vibrational properties. Vacuum. 2018;155:662-666.
- [CrossRef] [Google Scholar]
- Enhanced ionic conductivity in nanostructured, heavily doped ceria ceramics. Adv. Funct. Mater.. 2006;16:107-113.
- [CrossRef] [Google Scholar]
- Origin of visible light photoactivity of the CeO2 /ZnO heterojunction. ACS Appl. Energy Mater.. 2018;1:4247-4260.
- [CrossRef] [Google Scholar]
- Cullity, B.D., n.d. Elements of X-RAY DIFFRACTION SECOND EDITION.
- Solvothermal synthesis of dual-porous CeO2-ZnO composite and its enhanced acetone sensing performance. Ceram. Int.. 2018;45:4103-4107.
- [CrossRef] [Google Scholar]
- Synthesis of Co-doped ZnO nanoparticles via co-precipitation: Structural, optical and magnetic properties. Powder Technol.. 2015;286:757-765.
- [CrossRef] [Google Scholar]
- Structural, electrical, and dielectric properties of Cr doped ZnO thin films: role of Cr concentration. Appl. Surf. Sci.. 2016;387:1211-1218.
- [Google Scholar]
- Electrodes prepared by electrodeposition for electrochemical degradation of dye. Int. J. Electrochem. Sci. 2014;9:4297-4314.
- [Google Scholar]
- Influence of zinc on the structural and electrical properties of cerium oxide nanoparticles. Mater. Today Proc.. 2018;5:3070-3077.
- [CrossRef] [Google Scholar]
- Nano-sized CuO/ZnO hollow spheres: synthesis, characterization and photocatalytic performance. J. Mater. Sci. Mater. Electron. 2017
- [CrossRef] [Google Scholar]
- Preparation of CeO2/ZnO nanostructured microspheres and their catalytic properties. Powder Technol.. 2006;166:72-76.
- [CrossRef] [Google Scholar]
- Synthesis and characterization of CuO-NiO-ZnO mixed metal oxide nanocomposite. J. Alloys Compd.. 2017;723:866-872.
- [Google Scholar]
- One step hydrothermal synthesis of a carbon nanotube/cerium oxide nanocomposite and its electrochemical properties. Nanotechnology. 2013;24(36):365401.
- [CrossRef] [Google Scholar]
- Synthesis and enhanced field emission of zinc oxide incorporated carbon nanotubes. Diam. Relat. Mater.. 2017;71:79-84.
- [CrossRef] [Google Scholar]
- Morphological characterization of sphere-like structured ZnO-NiO nanocomposites with annealing temperatures. Mater. Lett.. 2017;186:364-367.
- [CrossRef] [Google Scholar]
- CuO/NiO bimetallic nanocomposite: a facile DNA assisted synthetic approach and evaluation of bio efficacy. J. King Saud Univ. - Sci.. 2022;34(1):101718.
- [Google Scholar]
- Low temperature dielectric studies of zinc oxide (ZnO) Nanoparticles Prepared. 2013;24:331-335.
- [Google Scholar]
- Structural, optical, morphological and dielectric properties of cerium oxide nanoparticles 2. Experimental Procedure 3. Results Discussion. 2016;19:478-482.
- [Google Scholar]
- High electrochemical performance and enhanced electrocatalytic behavior of a hydrothermally synthesized highly crystalline heterostructure CeO2@NiO nanocomposite. Inorg. Chem.. 2019;58:13843-13861.
- [CrossRef] [Google Scholar]
- Fundamentals and catalytic applications of CeO2-based materials. Chem. Rev.. 2016;116:5987-6041.
- [CrossRef] [Google Scholar]
- Lattice constant dependence on particle size for ceria prepared from a citrate sol-gel. J. Phys. Conf. Ser.. 2006;26:119-122.
- [CrossRef] [Google Scholar]
- Ni-CeO2 spherical nanostructures for magnetic and electrochemical supercapacitor applications. Phys. Chem. Chem. Phys.. 2017;19:4396-4404.
- [CrossRef] [Google Scholar]
- Dielectric enhancement and Maxwell-Wagner effects in ferroelectric superlattice structures. Appl. Phys. Lett.. 2000;77:1520-1522.
- [CrossRef] [Google Scholar]
- Synthesis and characterization of reduced graphene oxide decorated with CeO2 -doped MnO2 nanorods for supercapacitor applications. J. Colloid Interface Sci.. 2017;494:338-344.
- [CrossRef] [Google Scholar]
- Structural and dielectric properties of CuO nanoparticles. Ceram. Int.. 2017;43:10708-10714.
- [CrossRef] [Google Scholar]
- Structural, optical, morphological and dielectric properties of cerium oxide nanoparticles. Mater. Res.. 2016;19:478-482.
- [CrossRef] [Google Scholar]
- Comment on “size effect on the lattice parameters of nanoparticles”. J. Mater. Sci. Lett.. 2003;22:1333-1334.
- [CrossRef] [Google Scholar]
- Gas sensing performance of hydrothermally grown CeO2-ZnO composites. Ceram. Int.. 2014;40:5837-5842.
- [CrossRef] [Google Scholar]
- Structural and Morphological Studies of ZnO-CeO2 Nanocomposites. Mater. Today Proc.. 2016;3:4146-4150.
- [CrossRef] [Google Scholar]
- Synthesis and UV-shielding properties of ZnO- and CaO-doped CeO2 via soft solution chemical process. Solid State Ionics. 2002;151:235-241.
- [Google Scholar]
- Fabrication of CuO nanoparticles for structural, optical and dielectric analysis using chemical precipitation method. J. Mater. Sci. Mater. Electron.. 2017;28:12591-12597.
- [CrossRef] [Google Scholar]
- Santha, N.I., Sebastian, M.T., Alford, N.M., Sarma, K., Pullar, R.C., 2004. 2004 - Sebastian, Santha - J. Am. Ceram. Soc. - Effect of doping on the dielectric properties of cerium oxide in the microwave and far ‐.pdf 1237, 1233–1237.
- Enhancement of dielectric constant in transition metal doped ZnO nanocrystals. Appl. Phys. Lett.. 2014;105(9):092903.
- [Google Scholar]
- Study of dielectric, AC-impedance, modulus properties of 0.5Bi 0.5 Na 0.5 TiO30.5CaCu3Ti4O12 nano-composite synthesized by a modified solid state method. Mater. Sci. Semicond. Process.. 2015;31:386-396.
- [CrossRef] [Google Scholar]
- Investigation of electronic polarization – AC and DC conductivities of CeO2/MnO2 nanocomposite. J. King Saud Univ. - Sci.. 2022;34(4):101990.
- [CrossRef] [Google Scholar]
- Dielectrical properties of CeO2 nanoparticles at different temperatures. PLoS One. 2015;10(4):e0122989.
- [CrossRef] [Google Scholar]
- Enhanced photocatalytic activity of flowerlike CuO – ZnO nanocomposites synthesized by one-step hydrothermal method. J. Mater. Sci. Mater. Electron.. 2016;27(10):10667-10672.
- [Google Scholar]
- Zhu, H., Yang, D., Yu, G., Zhang, H., Jin, D., Yao, K., 2010. Hydrothermal synthesis of Zn2SnO4 nanorods in the diameter regime of Sub-5 nm and their properties 110, 7631–7634. https://doi.org/10.1021/jp060304t.


