

Rapid discrimination of Brassica napus varieties using visible and Near-infrared (Vis-NIR) spectroscopy
⁎Corresponding author. sisohn@korea.kr (Soo-In Sohn)
-
Received: ,
Accepted: ,
This article was originally published by Elsevier and was migrated to Scientific Scholar after the change of Publisher.
Peer review under responsibility of King Saud University.
Abstract
Brassica napus is an oilseed plant that is mostly used to produce edible oils, industrial oils, modified lipids and biofuels. The number of varieties/cultivars is high for the species, owing to their higher level of economic use. The aim of this study is to assess the use of visible-near infrared (Vis-NIR) spectroscopy in combination with multiple chemometric methods that have been explored for the discrimination of eight Brassica napus varieties in Korea. In this study, the spectra from leaves of the eight B. napus varieties were measured in the Vis-NIR spectra in the range of 325–1075 nm with a stepping of 1.5 nm in reflectance mode. The spectral data were preprocessed with three different preprocessing methods and eight different chemometric analyses were used for effective discrimination. After the outlier detection, the samples were split into two sets, one serving as a calibration set and the remaining one as a validation set. When using multiple preprocessing and chemometric methods for the discrimination, the maximum classification accuracy was witnessed in the combination of standard normal variate and support vector machine up to 98.2 %. The use of Savitzky-Golay filter smoothing as a preprocessing method had the best and most satisfactory discrimination of all other chemometric methods. The results suggest that the use of handheld Vis-NIR spectroscopy in combination with chemometric approaches can be used as an effective tool for the discrimination of B. napus varieties in the field.
Keywords
Visible-near infrared
Spectroscopy
Brassica napus
Chemometrics
Deep learning
Preprocessing

1 Introduction
Brassica napus, also known as rapeseed, oilseed rape and canola, is one of the most important oil seed crop; globally, it ranks third in oilseed production next to palm and soybean (Rahaman et al. 2017). It belongs to the family Brassicaceae, which comprises 419 genera and 4,130 species. Further, the number of varieties in B. napus is massive and each variety was cultivated for its own characteristics. The innovative use of germplasm resources is strongly intertwined with rapeseed breeding and industrial growth (Hu et al. 2021). Cultivation of different varieties/cultivars simultaneously in nearby fields may lead to complications in identification. Traditionally, morphological characters have been used to identify varieties. However, due to modern breeding technologies, a lack of phenotypic variation makes traditional morphological methods difficult to identify varieties (Xu et al. 2009; Sohn et al. 2021a, 2021b). Furthermore, current crop production necessitates rapid discrimination technologies. In recent years, much research has been done on various techniques for realizing a robust identification method, such as molecular markers and gene expression profiling, but these methods are not competent for field level assessment and they are both costly and time-consuming (Sohn et al. 2021a). Hence, it is imperative to find a rapid method for the identification of plant varieties in the environment.
Near-infrared spectroscopy has rapidly progressed from a laboratory technique to a main tool for a wide range of qualitative and quantitative analysis applications. In general, modern NIR spectroscopy, combined with chemometrics, has the advantages of speed, high efficiency, low cost, and non-destructiveness (Cozzolino, 2014; Sohn et al. 2021a). It has been used in various industrial applications, including the food industry, petroleum chemical engineering, medicine, etc. However, their usage in agricultural industry is important for quality assessment and discrimination of plants and weeds. Hitherto, it has been used for the discrimination of plant varieties and species, and it has also been used for several agricultural and food characterizations (Cozzolino et al. 2003; Sohn et al. 2021a). Generally, visible near infrared (Vis-NIR) spectroscopy is used for discriminating plants by measuring the amount of light absorbed by functional groups over the Vis-NIR region (due to vibrations produced from stretching and bending of H bonds associated with C, O, and N, etc.) (Martens and Naes, 1989). The samples are grouped based on their spectral similarity and thus used for species discrimination and adulterations in foods. The main aim of this study was to use Vis-NIR reflectance spectroscopy for the discrimination of eight commercial B. napus varieties in South Korea. The precise goals were (1) to assess the potential of handheld Vis-NIR spectroscopy to discriminate the plant varieties and (2) to compare the eight chemometric methods and their combinations with different preprocessing techniques for the effective discrimination of different B. napus varieties.
2 Materials and methods
2.1 Plant materials
Eight varieties of oilseed rape belonging to the B. napus L. variety were selected from the Korean penisula with the following local names: ‘Youngsan’ ‘Hanla’ ‘Joongmo 7002′ Joongmo7001′ ‘Naehan’ ‘Tamla’ ‘Tammi’. A commercial variety, ‘Westar’ (Fig. 1) was also procured from the National Agrobiodiversity Center, Jeonju, Republic of Korea. All the varieties were grown in soil pots at the greenhouse of the National Institute of Agricultural Sciences, Jeonju, Republic of Korea, during May–July 2020. A total of 80 plants were used in this study, 10 samples from each of the eight varieties (8 × 10 = 80).
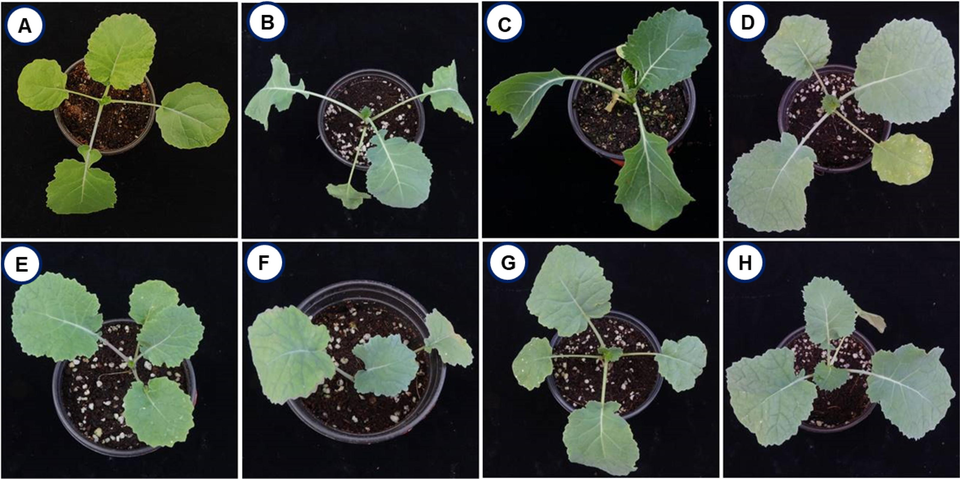
- The representative figures of eight Brassica napus varieties used in the study. A, Westar; B, Naehan; C, Youngsan; D, Joongmo 7001; E, Joongmo 7002; F, Tamla; G, Tammi; H, Hanla.
2.2 Vis-NIR spectral data collection
The Vis-NIR diffuse reflectance spectra of intact leaves of eight B. napus varieties were acquired using a handheld integrated portable spectrum analyzer (FieldSpec HandHeld 2, ASD Inc., Longmont, CO, USA) in the range of 325–1075 nm with a stepping of 1.5 nm in reflectance mode (log/R). The spectra were taken on the fully inflated leaves' adaxial surface, which may easily capture light. In each group, 10 spectra were acquired from three distinct sections of the leaf blade. Each group yielded a total of 300 spectra (3 × 10 × 10 = 300) to use for further investigation. To remove unnecessary noise, the Vis-NIR device's optical window was placed directly on the leaf's face during each spectrum capture, ensuring that the sensor window was entirely covered.
2.3 Preprocessing and chemometric analysis
In general, the background signals appeared in the raw spectra of samples due to the system settings and external noise. Hence, to minimize spectral noise and increase the accuracy of modeling approaches, different preprocessing methods, namely, normalization (area), standard normal variate (SNV), and derivatives (Savitzky–Golay (first differentiation)) were applied. The effectiveness of preprocessing methods was compared with raw spectra. Unscrambler X software, version 10.5.1, was used to execute the preprocessing computations (CAMO ASA, Oslo, Norway).
Several machine learning approaches were utilized and compared for effective visualisation and discrimination of spectral data. RapidMiner Studios Version 9.0.002 (RapidMiner, Inc., Boston, MA, USA) was used for the modeling. In this study, deep learning, decision tree, support vector machine (SVM), random forest, generalized linear model, rapid large margin, Naive Bayes, and linear discriminant analysis were employed to discover the optimal modeling strategy with the highest classification accuracy. The Aquap2 package developed by Pollner and Kovacs, (2014) was also used to apply the different preprocessing techniques and to perform linear discriminant analysis in R-studio. The inputs for each method were the spectral data points, and the classes were the identifying labels for eight B. napus varieties. For the reliability of the models in predicting multiple sample types, cross-validation was performed. The data was divided into two sets for this purpose: a training set and a validation set. The training set had two-thirds of the data and the rest was used as the validation set. The data splitting was done three times in order to make sure that each sample was tested at least once in the calibration and validation set.
2.4 Statistical analysis
The influence of (1) the scatter correction method, (2) the eight machine learning methods, and (3) the interaction between preprocessing and machine learning methods was determined using one-way analysis of variance (ANOVA). Tukey's range test was employed as a mean comparison procedure with a significance level of p ≤ 0.05.
3 Results and discussion
3.1 Spectral analysis and preprocessing
Fig. 2 shows the average Vis-NIR spectra obtained from the eight B. napus varieties. That includes raw spectra and preprocessed with three different preprocessing methods. The raw spectra (Fig. 2A) are the spectra with no changes. However, other spectra (Fig. 2B-2D) were preprocessed with three different methods, namely Savitzky–Golay, standard normal variate and normalization, respectively. There are numerous crossovers and overlapping across the eight samples (Fig. 2); in other words, the spectra of each variety are quite similar to those of other varieties. Consequently, discrimination of varieties directly based on absorbance spectra is difficult. Therefore, it is necessary to use machine learning methods for the effective discrimination of eight varieties. From 325 to 550 nm, the spectral curve is flat and between 550 and 600 nm there is a small peak before dropping back to their normal position. This demonstrates that the leaves actively absorb blue (400–500 nm) and red (680 nm) light while reflecting green light (550 nm) in the visible range (Li and He, 2008) which is responsible for chlorophylls and carotenoids (Xu et al. 2009; Smith et al. 2017). From 650 to 750 nm, there was a sharp increase in the peak that remained the highest absorbance value; later, there were no variations in the remaining wavelength until 1200 nm. The spectra were preprocessed to reduce systemic noise and emphasize differences between samples. Using a number of preprocessing methods simultaneously will help us obtain a greater degree of classification accuracy and will allow us to select the best preprocessing approach for each sample (Feng et al. 2017; Sohn et al. 2022). It is difficult to discriminate the plant varieties only with the spectra shown in Fig. 2. For effective discrimination, Vis-NIR spectroscopy was combined with several models and machine learning methods such as discriminant analysis and principal component analysis (PCA) (Sohn et al. 2021a). To investigate the qualitative differences between the eight B. napus varieties, PCA analysis was performed using raw spectra. PCA analysis is a powerful data mining technique. The principle of PCA is to determine the linear combinations of the initial variables that contribute to the differences between samples (Li et al. 2007). These combinations are referred to as principal components (PCs). As shown in Fig. 3A, all of the different PCs showed the same slight pattern of separation for the different samples in the PCA paired plot from PC1 to PC6, but PC1 vs PC2 (Fig. 3B) showed the most visual differences. Therefore, outlier detection was performed using these two PCs before initiating preprocessing for the machine learning methods. Generally, the computerized iterations make PC1 have the maximum amount of information and PC2 have the maximum share of residual information (Li et al. 2007).
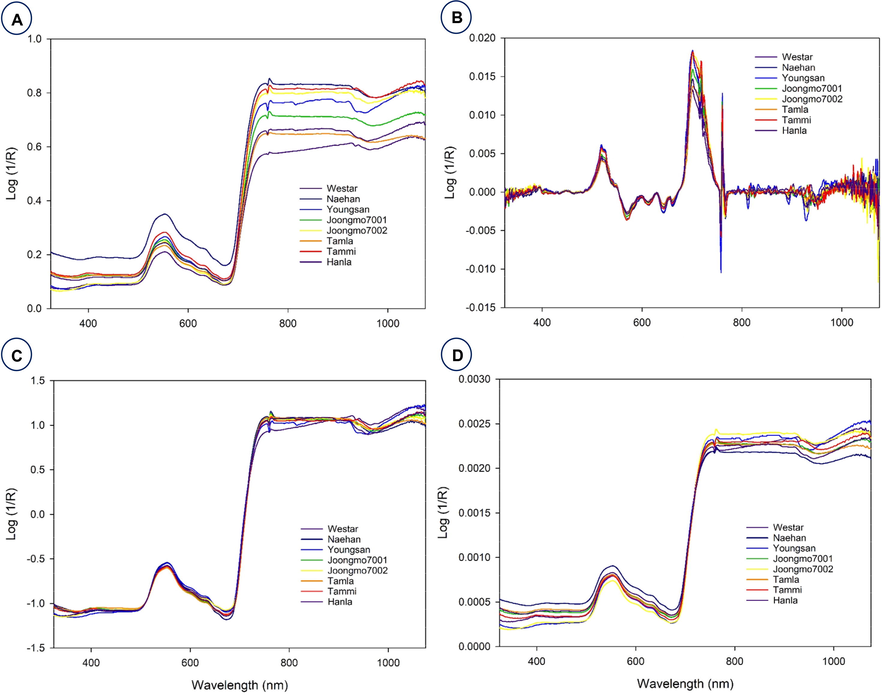
- Average raw and preprocessed spectra of eight B. napus varieties. Average raw (A) and preprocessed with different preprocessing methods, namely Savitzky–Golay (B), standard normal variate (C), and normalization (D).
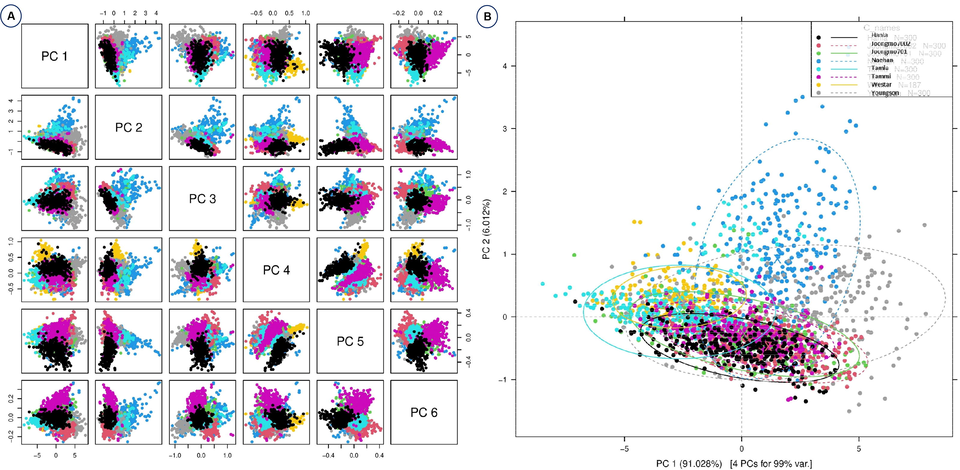
- Principal component analyses based on the Vis-NIR spectra of eight B. napus varieties. Raw spectra have been used. (A) Paired blot; (B) axes are first and second principal components.
3.2 Chemometric analysis for discrimination of eight B. napus varieties
The potential of visible-NIR spectroscopy to discriminate or identify plant varieties is based on leaf spectral properties related to biochemical composition and structure, which are influenced by a variety of factors such as plant species, leaf development or microclimate position of the plant, etc. (Jacquemoud and Ustin, 2001; Xu et al. 2009). To determine the most accurate method for distinguishing eight B. napus varieties, the classification accuracy of various chemometric methods combined with different preprocessing methods was assessed. Table 1 shows a summary of the classification accuracy for the various methods. The classification accuracy of the various methods ranged from 22.0 to 98.2 %. Both raw and preprocessed spectra analyzed using chemometric methods demonstrated effective discrimination with diverse classification accuracies.
| S. No | Model | Preprocessing | Average Accuracy (%) | Run Time (ms) |
|---|---|---|---|---|
| 1. | Linear Discriminant analysis |
Raw spectra | 74.91 | – |
| Normalization (Area) | 85.60 | – | ||
| Standard Normal Variate | 92.52 | – | ||
| Derivative (Savitzky-Golay) | 95.24 | – | ||
| 2. | Deep Learning | Raw spectra | 77.4 | 8908.1 |
| Normalization (Area) | 85.6 | 8694.4 | ||
| Standard Normal Variate | 94.5 | 8930 | ||
| Derivative (Savitzky-Golay) | 97.9 | 9131.4 | ||
| 3. | Support Vector Machine |
Raw spectra | 78.8 | 68415.6 |
| Normalization (Area) | 50.1 | 174966.3 | ||
| Standard Normal Variate | 98.2 | 50676.3 | ||
| Derivative (Savitzky-Golay) | 96.8 | 75943.9 | ||
| 4. | Generalized Linear Model |
Raw spectra | 42.6 | 8715.3 |
| Normalization (Area) | 49.3 | 8714.7 | ||
| Standard Normal Variate | 63.1 | 8773 | ||
| Derivative (Savitzky-Golay) | 92.2 | 8692.8 | ||
| 5. | Decision Tree | Raw spectra | 21 | 9010.1 |
| Normalization (Area) | 16.7 | 8465.8 | ||
| Standard Normal Variate | 29.3 | 8027.8 | ||
| Derivative (Savitzky-Golay) | 55.6 | 8524.6 | ||
| 6. | Naive Bayes | Raw spectra | 28.9 | 10248.9 |
| Normalization (Area) | 30.6 | 9261.2 | ||
| Standard Normal Variate | 42.2 | 10134.1 | ||
| Derivative (Savitzky-Golay) | 72 | 9816.8 | ||
| 7. | Fast Large Margin |
Raw spectra | 66.2 | 49314.1 |
| Normalization (Area) | 45.8 | 43485.6 | ||
| Standard Normal Variate | 92.7 | 43439.6 | ||
| Derivative (Savitzky-Golay) | 95.1 | 43831.2 | ||
| 8. | Random Forest | Raw spectra | 22 | 9512.3 |
| Normalization (Area) | 38.8 | 10036.9 | ||
| Standard Normal Variate | 39.6 | 9060.4 | ||
| Derivative (Savitzky-Golay) | 64.5 | 11601.5 |
In most chemometric analyses, however, preprocessed spectra were found to have a higher classification accuracy than raw spectra. In some cases, the use of raw spectra yielded very less classification accuracy with the use of Decision tree (21 %), Random Forest (22 %) and Naïve Bayes (28.9 %). The maximum classification accuracy (98.2 %) was achieved with the preprocessing method SNV in combination with SVM. As shown in Table 1, among different preprocessing methods, Savitzky-Golay found to have higher classification accuracy with the combination of all other chemometric methods with a range of 55.6 to 97.9 %. Among the different chemometric analyses, SVM, deep learning, linear discriminant analysis and fast large margin were found to have higher levels of classification accuracy (SVM/SNV, 98.2 %; deep learning/SG, 97.9 %; SVM-SG, 96.8 %; LDA-SNV, 95.2 %; FLM/SG, 95.1 %). Even when using the raw spectrum without preprocessing the data, the SVM model had a high accuracy of 78.8 %. The SVM is particularly well suited to high-dimensional data because the value of each attribute is arbitrary (Gaye et al. 2021). Overall, the combination of SVM and SNV was found to be more effective in the discrimination of eight B. napus varieties. The preprocessing method Savitzky-Golay (97.9 %) was the best preprocessing method for use with multiple chemometric methods. Previously, several reports used multiple preprocessing and chemometric methods for discriminating between of plant varieties. For the discrimination of potato tuber varieties, Yee et al. (2006) used NIR spectra in combination with LDA analysis, resulting in a classification accuracy of 93 %. Chen et al. (2007) studied the differentiation of three tea varieties using SVM. Similarly, Vis-NIR spectroscopy combined with artificial neural networks (ANN) discriminated tea plant varieties with an accuracy of 77.3 % (Li and He, 2008). Xu et al. (2009) used PCA, LDA, and discriminant partial least squares (DPLS) regression methods for the on-site discrimination of tomato varieties. The LDA plot for the discrimination of eight B. napus varieties is shown in Fig. 4. The variety “Hanla” was completely separated from the clusters of other varieties, while other clusters of the other seven varieties were closely placed. This suggests that the other seven varieties share a higher level of similarity in their biological composition, whereas “Hanla” shares very little with the other varieties. Previously, the LDA analysis has been used for the discrimination of several plant varieties, such as sprouted mung bean (Tjandra et al. 2021) and melon varieties (Li et al. 2019).
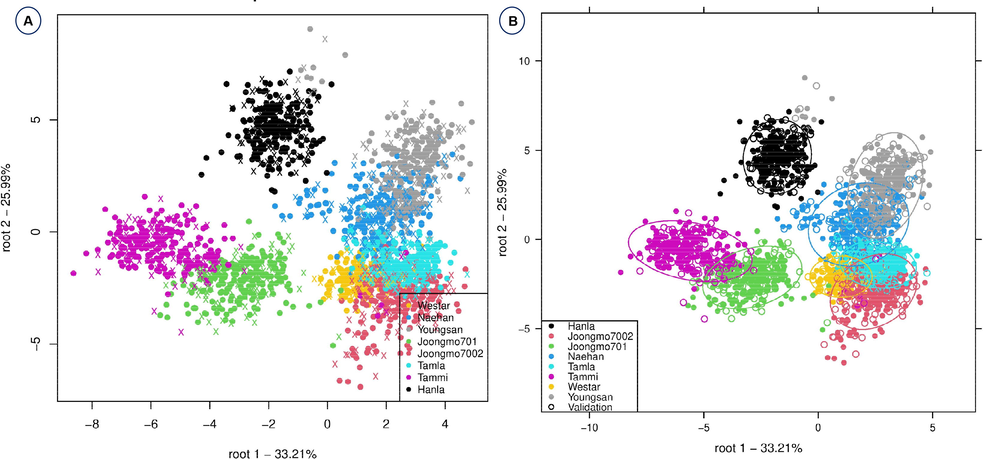
- Linear discriminant analysis for the effective discrimination of eight B. napus varieties without confidence circles (A) and with confidence circles (B).
3.3 Selection of significant preprocessing and chemometric methods for discrimination
The efficiency of preprocessing and machine learning approaches were statistically analyzed (Table 2). After cross-validation, the mean percentage of classification accuracy of each chemometric method combined with various preprocessing methods revealed the significant modeling for the discrimination of eight B. napus varieties (Table 2). The statistical analysis using ANOVA (Table 3) revealed that the sum of square and mean sum of square values had statistical significance at p ≤ 0.0001. However, when a combination of preprocessing and multiple machine learning approaches was used, there was no significance at p ≤ 0.0001 (p value of 0.0003). The confusion matrix illustrates the degree of error in the identification of the assessed plants, suggesting that SNV combined with SVM was the most accurate classification method (Table 4). Similar results were witnessed by the use of Vis-NIR spectroscopy in the discrimination of Amaranthus sp. (Sohn et al. 2021b).
| Model | Species accuracy (%±SE) | ||||
|---|---|---|---|---|---|
| Raw spectra | Normalization (Area) |
Derivative (Savitzky-Golay) |
SNV | significance | |
| Naive Bayes | 23.7 ± 6.4B c | 33.7 ± 9.8B b | 73.4 ± 2.6 A bc | 41.8 ± 8.7B cd | ** |
| Generalized Linear Model | 46.6 ± 5.8C bc | 60.8 ± 6 BC ab | 92.3 ± 1.8 A ab | 66.1 ± 4.6B bc | ** |
| Fast Large Margin | 78.1 ± 9.3 A ab | 51.2 ± 6.6B b | 95.6 ± 1.1 A ab | 92.7 ± 1.7 A ab | ** |
| Deep Learning | 79.5 ± 3.3C ab | 87.9 ± 3.6 BC a | 98 ± 1.1 A a | 95.1 ± 1.4 AB ab | ** |
| Decision Tree | 21.7 ± 10B c | 2.1 ± 2.1B c | 61.3 ± 12.2 A c | 29.1 ± 12.6 AB d | ** |
| Random Forest | 40.3 ± 14.1c | 47.8 ± 7.4b | 74.7 ± 7 abc | 52.6 ± 10.9 cd | ns |
| Support Vector Machine | 85.4 ± 5.7 A a | 56 ± 6.1B b | 97.4 ± 1 A a | 98.2 ± 0.8 A a | ** |
| significance | ** | ** | ** | ** | |
ns; not significant, *; significant with the P ≤ 0.05; Different alphabetical small and capital letters shows the significance of the value in the order of column and row respectively.
| Source | df | SS | MS | F-value | P-value |
|---|---|---|---|---|---|
| Preprocessing (P) | 3 | 4.42549073 | 1.47516358 | 37.49 | ≤0.0001 |
| Model (M) | 6 | 10.01502715 | 1.66917119 | 42.43 | ≤0.0001 |
| P × M | 18 | 1.62062017 | 0.09003445 | 2.29 | ≤0.003 |
| Error | 196 | 7.71132541 | 0.0393435 | ||
| Total | 223 | 23.77246347 |
| SNV/ | Classified as | ||||||||
|---|---|---|---|---|---|---|---|---|---|
| SVM | Westar | Naehan | Youngsan | Joongmo701 | Joongmo7002 | Tamla | Tammi | Hanla | True positive (%) |
| Westar | 100 | 0 | 0 | 0 | 0 | 0 | 0 | 0 | 100 |
| Naehan | 0 | 98.37 | 0 | 0 | 0 | 1.63 | 0 | 0 | 98.37 |
| Youngsan | 0 | 0 | 100 | 0 | 0 | 0 | 0 | 0 | 100 |
| Joongmo701 | 0 | 0 | 0 | 100 | 0 | 0 | 0 | 0 | 100 |
| Joongmo702 | 0 | 0 | 0 | 1.86 | 97.22 | 0.92 | 0 | 0 | 97.22 |
| Tamla | 0 | 0 | 0.47 | 0 | 0 | 99.53 | 0 | 0 | 99.53 |
| Tammi | 0 | 1.25 | 0 | 5.67 | 0 | 0 | 93.08 | 0 | 93.08 |
| Hanla | 0 | 0.87 | 0.44 | 0.87 | 0 | 0 | 0.44 | 97.38 | 97.38 |
| SNV/ | Classified as | ||||||||
| LDA | Westar | Naehan | Youngsan | Joongmo701 | Joongmo7002 | Tamla | Tammi | Hanla | True positive (%) |
| Westar | 93.55 | 0 | 0 | 0 | 0 | 0.33 | 0 | 0 | 93.55 |
| Naehan | 0 | 91 | 0 | 0 | 0 | 0.33 | 0 | 0 | 91.00 |
| Youngsan | 0 | 0 | 93 | 0 | 0 | 0 | 0 | 0 | 93.00 |
| Joongmo701 | 0 | 2.33 | 0 | 98.33 | 0 | 0 | 8.33 | 0 | 98.33 |
| Joongmo702 | 2.15 | 0 | 0 | 0 | 99.67 | 0.33 | 1.33 | 0 | 99.67 |
| Tamla | 4.31 | 0 | 3 | 1.67 | 0.33 | 99.01 | 0.67 | 0 | 99.01 |
| Tammi | 0 | 0 | 0 | 0 | 0 | 0 | 89.67 | 0 | 89.67 |
| Hanla | 0 | 6.67 | 4 | 0 | 0 | 0 | 0 | 100 | 100 |
| SGolay/ | Classified as | ||||||||
| SVM | Westar | Naehan | Youngsan | Joongmo701 | Joongmo7002 | Tamla | Tammi | Hanla | True positive (%) |
| Westar | 100 | 0 | 0 | 0 | 0 | 0 | 0 | 0 | 100 |
| Naehan | 0 | 99.46 | 0.54 | 0 | 0 | 0 | 0 | 0 | 99.46 |
| Youngsan | 0 | 0 | 99.48 | 0 | 0 | 0 | 0 | 0.52 | 99.48 |
| Joongmo701 | 0 | 0 | 0 | 92.89 | 0 | 0 | 6.34 | 0.47 | 92.89 |
| Joongmo702 | 0 | 0 | 0 | 0 | 99.03 | 0 | 0.97 | 0 | 99.03 |
| Tamla | 0 | 0.45 | 1.38 | 0 | 0.45 | 97.27 | 0.45 | 0 | 97.27 |
| Tammi | 0 | 0 | 0 | 2.22 | 0 | 0 | 97.78 | 0 | 97.78 |
| Hanla | 0 | 0.40 | 4.75 | 0.40 | 0.80 | 0 | 0.40 | 93.25 | 93.25 |
4 Conclusions
In conclusion, a simple and rapid discrimination method for B. napus varieties was established using Vis-NIR spectroscopy combined with different machine learning methods. Among the different combinations of preprocessing and machine learning methods used, the combination of SNV and SVM was found to be more accurate with higher classification accuracy (98.2 %) followed by deep learning and Savitzky-Golay (97.9 %). However, the Savitzky-Golay smoothing also performed well with other chemometrics compared to SNV, suggesting that it has more potential for discrimination when using multiple chemometric methods. Therefore, it is concluded that this nondestructive method of using handheld Vis-NIR spectroscopy in combination with chemometric methods can be used in the field for the discrimination of plant varieties for rapid identification. It is also suggested that a database be created with large-scale germplasm collections of B. napus and/or other plant varieties for the effective utilization of the technology globally.
Funding
This study was carried out with the support of “Research Program for Agricultural Science & Technology Development and Post-doctoral Fellowship Program (Project No. PJ01494301 and PJ01672604)”, National Institute of Agricultural Sciences, Rural Development Administration, Korea.
Declaration of Competing Interest
The authors declare that they have no known competing financial interests or personal relationships that could have appeared to influence the work reported in this paper.
References
- Feasibility study on identification of green, black and oolong teas using near infrared reflectance spectroscopy based on support vector machine. Spectrochim. Acta A. 2007;66:568-574.
- [Google Scholar]
- An overview of the use of infrared spectroscopy and chemometrics in authenticity and traceability of cereals. Food Res. Int.. 2014;60:262-265.
- [Google Scholar]
- Feasibility study on the use of visible and near-infrared spectroscopy together with chemometrics to discriminate between commercial white wines of different varietal origins. J. Agric. Food Chem.. 2003;51:7703-7708.
- [Google Scholar]
- Discrimination of CRISPR/Cas9-induced mutants of rice seeds using near-infrared hyperspectral imaging. Sci. Rep.. 2017;7:15934.
- [Google Scholar]
- Improvement of support vector machine algorithm in big data background. Mat. Prob. Eng.. 2021;2021:5594899.
- [Google Scholar]
- Exploring the gene pool of Brassica napus by genomics-based approaches. Plant Biotechnol. J.. 2021;19:1693.
- [Google Scholar]
- Jacquemoud, S., Ustin, S.L., 2001. January. Leaf optical properties: A state of the art. In: 8th International Symposium of Physical Measurements & Signatures in Remote Sensing (pp. 223-332). CNES Aussois France.
- Non-destructive measurement of soluble solids content of three melon cultivars using portable visible/near infrared spectroscopy. Biosys. Eng.. 2019;188:31-39.
- [Google Scholar]
- Non-destructive discrimination of Chinese bayberry varieties using Vis/NIR spectroscopy. J. Food Eng.. 2007;81:357-363.
- [Google Scholar]
- Discriminating varieties of tea plant based on Vis/NIR spectral characteristics and using artificial neural networks. Biosys. Eng.. 2008;99:313-321.
- [Google Scholar]
- Assessment, validation and choice of calibration method. Multivar. Calib. 1989:237-266.
- [Google Scholar]
- Pollner, B., Kovacs, Z., 2014. Dedicated Aquaphotomics-Software R-Package „aquap2“General Introduction and Workshop. Aquaphotomics: Understanding Water in the Biological World. In: Proceedings of the 5th Kobe University Brussels European Centre Symposium Innovation, Environment and Globalization—Latest EU-Japan Research Collaboration, Bruxelles, Belgium, 14 October 2014.
- Association mapping of agronomic traits of canola (Brassica napus L.) subject to heat stress under field conditions. Aust. J. Crop Sci.. 2017;11:1094.
- [Google Scholar]
- Don’t ignore the green light: Exploring diverse roles in plant processes. J. Exp. Bot.. 2017;68:2099-2110.
- [Google Scholar]
- Vis-NIR spectroscopy and machine learning methods for the discrimination of transgenic Brassica napus L. and their hybrids with B. juncea. Processes. 2022;10:240.
- [Google Scholar]
- Identification of Amaranthus species using visible-near-infrared (vis-NIR) spectroscopy and machine learning methods. Remote Sens.. 2021;13:4149.
- [Google Scholar]
- An overview of near infrared spectroscopy and its applications in the detection of genetically modified organisms. Int. J. Mol. Sci.. 2021;22:9940.
- [Google Scholar]
- Near-Infrared spectroscopy and aquaphotomics for monitoring mung bean (Vigna radiata) sprout growth and validation of ascorbic acid content. Sensors. 2021;21:611.
- [Google Scholar]
- On-site variety discrimination of tomato plant using visible-near infrared reflectance spectroscopy. J. Zhejiang Univ. Sci. B. 2009;10:126-132.
- [Google Scholar]
- Use of near infrared spectra to identify cultivar in potato (Solanum tuberosum) crisps. New Zeal J. Crop Hort.. 2006;34:177-181.
- [Google Scholar]
Appendix A
Supplementary material
Supplementary data to this article can be found online at https://doi.org/10.1016/j.jksus.2022.102495.
Appendix A
Supplementary material
The following are the Supplementary data to this article:


